NIKKEI FULL TRADE-ABLE SETUPSBelow are Dual-Scenario Trade Setups for three trader types—Short-Term, Swing, and Macro—based on the previously completed top-down technical analysis. Each category includes a Primary (Bias-Aligned) setup reflecting the overall bullish consolidation bias, plus an Alternate (Contrary) setup in case price breaks key levels and invalidates the primary scenario.
1. Short-Term Trader (Intraday to Multi-Day)
A) Primary (Bias-Aligned) Setup
• Rationale:
Aligns with the broader uptrend and the ongoing range support near 38,900–39,000 on lower timeframes. Looks for a short-term rally if price reclaims local resistance.
• Execution Parameters:
• Entry Trigger:
• Await a 1H candle close above ~39,300 (near local lower-high pivot).
• Look for an uptick in volume or a bullish engulfing bar on the 1H chart confirming momentum.
• Stop-Loss Placement:
• Under 39,000, just below the bullish order block / recent intraday support.
• Take-Profit Levels:
• TP1: ~39,500 (immediate overhead supply).
• TP2: ~39,700–39,800 (previous swing highs).
• Risk Management:
• Position size to risk 1–2% of trading capital, with an approximate 1:2 or 1:3 R:R ratio depending on final entry fill.
B) Alternate (Contrary) Setup
• Rationale:
Activates if the support region (38,900–39,000) fails, flipping short-term bias to downside momentum.
• Execution Parameters:
• Alternate Entry Trigger:
• Break and 1H close below 38,900, confirming invalidation of the bullish order block.
• Any retest that fails to reclaim 39,000 becomes a secondary entry.
• Stop-Loss Placement:
• Just above 39,100 to cover a potential reclaim attempt.
• Take-Profit Levels:
• TP1: ~38,600 (recent minor support).
• TP2: ~38,200 or deeper if intraday selling accelerates.
• Risk Management:
• Adjust position size for volatility around a breakdown; aim for a 1:2 R:R or better.
2. Swing Trader (Multi-Week)
A) Primary (Bias-Aligned) Setup
• Rationale:
Builds on the daily chart’s bullish structure near 38k support, looking for a potential run toward the 40k–41k resistance region.
• Execution Parameters:
• Entry Trigger:
• Daily close above ~39,500 with sustained volume, suggesting an attempt at the next resistance band (40k+).
• Bullish crossover on daily MACD or RSI crossing above ~55 can reinforce the entry.
• Stop-Loss Placement:
• Beneath 38,500 on a daily closing basis, below the recent consolidation floor to allow for volatility.
• Take-Profit Levels:
• TP1: ~40,000–40,200 (major daily supply zone).
• TP2: ~41,000 (upper band of daily range).
• Risk Management:
• Aim for a moderate position size, seeking a 1:2 or 1:3 R:R. Consider partial profit at TP1 and trailing stops thereafter.
B) Alternate (Contrary) Setup
• Rationale:
Triggered if daily price closes convincingly under 38k support, negating the bullish mid-range bias and opening downside toward deeper weekly support.
• Execution Parameters:
• Alternate Entry Trigger:
• Daily close below ~38,000, plus follow-through selling on the next session.
• This invalidates the bullish structure, suggesting a larger correction could unfold.
• Stop-Loss Placement:
• Above 38,800 on a daily closing basis, covering a possible reclaim of the broken support.
• Take-Profit Levels:
• TP1: ~37,000 (prior daily pivot and potential institutional demand).
• TP2: ~36,000 or lower if the weekly chart’s deeper support is tested.
• Risk Management:
• Use swing-sized position. Target a 1:2 R:R minimum, reducing or trailing stops near key fib or structural supports.
3. Macro Trader (Multi-Month to Longer-Term)
A) Primary (Bias-Aligned) Setup
• Rationale:
Leverages the long-term uptrend visible on the weekly chart, anticipating that consolidation near ~38k–39k eventually resolves to the upside toward prior highs (~42k).
• Execution Parameters:
• Entry Trigger:
• Weekly close above 40k, demonstrating a clear breakout from the consolidation range.
• Confirmation via weekly momentum indicators turning bullish (e.g., weekly MACD crossing positive).
• Stop-Loss Placement:
• Under 36k on a weekly closing basis, below major prior structure and the 100/200-week MAs.
• Take-Profit Levels:
• TP1: ~42,000–43,000 (historic weekly resistance).
• TP2: Potential extension beyond 45k if the bull trend accelerates.
• Risk Management:
• Lower leverage or a smaller position. Potentially add on retests of the breakout zone. Seek a 1:3 or better R:R over a longer horizon.
B) Alternate (Contrary) Setup
• Rationale:
Engaged if price fails at the top of the range and breaks down significantly below the multi-year trendline or major weekly support.
• Execution Parameters:
• Alternate Entry Trigger:
• Weekly close below 35,500–36,000, confirming the breakdown of the bullish structure from a macro standpoint.
• Negative slope on weekly MAs or a strongly negative MACD cross might reinforce the short bias.
• Stop-Loss Placement:
• Above ~37,500 on a weekly closing basis, allowing some volatility above the broken support region.
• Take-Profit Levels:
• TP1: ~32,000–33,000 (major prior pivot / weekly volume node).
• TP2: ~30,000 or lower if a full cyclical retrace unfolds.
• Risk Management:
• Employ conservative position sizing given the longer timescale. Aim for a balanced risk-reward approach, partial profit around TP1, and trailing stop for the remainder.
Summary of the Dual-Scenario Approach
• Primary Setups in each category lean bullish, reflecting the broader uptrend and stable support around 38k–39k.
• Alternate (Contrary) Setups engage only if key supports break or resistance strongly rejects price, confirming a structural shift.
This dual approach covers both sides of the market, ensuring readiness for continued consolidation/breakout to the upside or a sudden downside invalidation of the current range.
JAPAN225CFD trade ideas

NIKKEI FULL-TRADEABLE SETUPS
1. Short-Term Trader (Intraday to Multi-Day)
A) Primary (Bias-Aligned) Setup
• Rationale:
Aligns with the broader uptrend and the ongoing range support near 38,900–39,000 on lower timeframes. Looks for a short-term rally if price reclaims local resistance.
• Execution Parameters:
• Entry Trigger:
• Await a 1H candle close above ~39,300 (near local lower-high pivot).
• Look for an uptick in volume or a bullish engulfing bar on the 1H chart confirming momentum.
• Stop-Loss Placement:
• Under 39,000, just below the bullish order block / recent intraday support.
• Take-Profit Levels:
• TP1: ~39,500 (immediate overhead supply).
• TP2: ~39,700–39,800 (previous swing highs).
• Risk Management:
• Position size to risk 1–2% of trading capital, with an approximate 1:2 or 1:3 R:R ratio depending on final entry fill.
B) Alternate (Contrary) Setup
• Rationale:
Activates if the support region (38,900–39,000) fails, flipping short-term bias to downside momentum.
• Execution Parameters:
• Alternate Entry Trigger:
• Break and 1H close below 38,900, confirming invalidation of the bullish order block.
• Any retest that fails to reclaim 39,000 becomes a secondary entry.
• Stop-Loss Placement:
• Just above 39,100 to cover a potential reclaim attempt.
• Take-Profit Levels:
• TP1: ~38,600 (recent minor support).
• TP2: ~38,200 or deeper if intraday selling accelerates.
• Risk Management:
• Adjust position size for volatility around a breakdown; aim for a 1:2 R:R or better.
2. Swing Trader (Multi-Week)
A) Primary (Bias-Aligned) Setup
• Rationale:
Builds on the daily chart’s bullish structure near 38k support, looking for a potential run toward the 40k–41k resistance region.
• Execution Parameters:
• Entry Trigger:
• Daily close above ~39,500 with sustained volume, suggesting an attempt at the next resistance band (40k+).
• Bullish crossover on daily MACD or RSI crossing above ~55 can reinforce the entry.
• Stop-Loss Placement:
• Beneath 38,500 on a daily closing basis, below the recent consolidation floor to allow for volatility.
• Take-Profit Levels:
• TP1: ~40,000–40,200 (major daily supply zone).
• TP2: ~41,000 (upper band of daily range).
• Risk Management:
• Aim for a moderate position size, seeking a 1:2 or 1:3 R:R. Consider partial profit at TP1 and trailing stops thereafter.
B) Alternate (Contrary) Setup
• Rationale:
Triggered if daily price closes convincingly under 38k support, negating the bullish mid-range bias and opening downside toward deeper weekly support.
• Execution Parameters:
• Alternate Entry Trigger:
• Daily close below ~38,000, plus follow-through selling on the next session.
• This invalidates the bullish structure, suggesting a larger correction could unfold.
• Stop-Loss Placement:
• Above 38,800 on a daily closing basis, covering a possible reclaim of the broken support.
• Take-Profit Levels:
• TP1: ~37,000 (prior daily pivot and potential institutional demand).
• TP2: ~36,000 or lower if the weekly chart’s deeper support is tested.
• Risk Management:
• Use swing-sized position. Target a 1:2 R:R minimum, reducing or trailing stops near key fib or structural supports.
3. Macro Trader (Multi-Month to Longer-Term)
A) Primary (Bias-Aligned) Setup
• Rationale:
Leverages the long-term uptrend visible on the weekly chart, anticipating that consolidation near ~38k–39k eventually resolves to the upside toward prior highs (~42k).
• Execution Parameters:
• Entry Trigger:
• Weekly close above 40k, demonstrating a clear breakout from the consolidation range.
• Confirmation via weekly momentum indicators turning bullish (e.g., weekly MACD crossing positive).
• Stop-Loss Placement:
• Under 36k on a weekly closing basis, below major prior structure and the 100/200-week MAs.
• Take-Profit Levels:
• TP1: ~42,000–43,000 (historic weekly resistance).
• TP2: Potential extension beyond 45k if the bull trend accelerates.
• Risk Management:
• Lower leverage or a smaller position. Potentially add on retests of the breakout zone. Seek a 1:3 or better R:R over a longer horizon.
B) Alternate (Contrary) Setup
• Rationale:
Engaged if price fails at the top of the range and breaks down significantly below the multi-year trendline or major weekly support.
• Execution Parameters:
• Alternate Entry Trigger:
• Weekly close below 35,500–36,000, confirming the breakdown of the bullish structure from a macro standpoint.
• Negative slope on weekly MAs or a strongly negative MACD cross might reinforce the short bias.
• Stop-Loss Placement:
• Above ~37,500 on a weekly closing basis, allowing some volatility above the broken support region.
• Take-Profit Levels:
• TP1: ~32,000–33,000 (major prior pivot / weekly volume node).
• TP2: ~30,000 or lower if a full cyclical retrace unfolds.
• Risk Management:
• Employ conservative position sizing given the longer timescale. Aim for a balanced risk-reward approach, partial profit around TP1, and trailing stop for the remainder.
Summary of the Dual-Scenario Approach
• Primary Setups in each category lean bullish, reflecting the broader uptrend and stable support around 38k–39k.
• Alternate (Contrary) Setups engage only if key supports break or resistance strongly rejects price, confirming a structural shift.
This dual approach covers both sides of the market, ensuring readiness for continued consolidation/breakout to the upside or a sudden downside invalidation of the current range.

NIKKEI SWING SET UPS
## SWING-TRADING (MULTI-WEEK) NIKKEI SETUP
### Overall Context
- **Market Sentiment & Positioning**: Institutional flows remain cautiously optimistic, with elevated hedging but steady inflows into key equity segments. The broader late-cycle expansion continues, while inflation shows signs of moderating.
- **Monetary Policy & Macro Factors**: Central banks globally are shifting toward accommodative policies, generally supporting equities. However, pockets of economic slowdown or negative surprises in data releases can quickly alter sentiment.
- **Technical Structure**: On the daily timeframe, the Nikkei has been building a bullish structure near the 38k zone, suggesting that dips into this area are often bought. Price attempts to push toward the 40k–41k region align with prior swing highs, forming a natural upside target for swing traders.
---
### A. PRIMARY (BULLISH) SWING SETUP
1. **Rationale**
- Seeks to capitalize on the Nikkei’s ongoing daily uptrend, with price consolidating above 38k.
- The daily momentum indicators and supportive macro environment suggest that further upside is possible if the index breaks its near-term resistance.
2. **Execution Parameters**
- **Entry Trigger**:
- Look for a daily close above ~39,500 on strong volume, indicating a renewed push toward the 40k region.
- A bullish crossover in technical indicators (e.g., MACD, RSI above ~55) can provide additional confirmation.
- **Stop-Loss Placement**:
- Below ~38,500 on a daily closing basis, allowing room for typical market volatility while protecting against a deeper breakdown.
- **Take-Profit Levels**:
1. **First Target**: Approximately 40,000–40,200, a significant daily resistance zone and psychological round number.
2. **Second Target**: Around 41,000, aligning with higher-end resistance if bullish momentum persists.
- **Risk Management**:
- Maintain a 1–2% account risk per trade. Position sizing should factor in the distance to your stop.
- Upon reaching the first target, consider partial profit-taking and moving the stop-loss to break-even.
3. **Supporting Factors**
- **Institutional Flows**: Large funds often continue buying dips in a stable macro environment, providing a cushion under prices.
- **Liquidity & Rates**: The supportive, lower-rate backdrop can encourage investors to hold equities longer, favoring sustained uptrends.
---
### B. ALTERNATE (BEARISH) SWING SETUP
1. **Rationale**
- Becomes actionable if the daily close undercuts ~38,000, suggesting the potential for a more pronounced corrective phase.
- Negative macro catalysts or a notable shift in risk sentiment could accelerate selling and undermine the current range-bound bullish bias.
2. **Execution Parameters**
- **Entry Trigger**:
- A daily close below ~38,000, followed by a second day of downside confirmation or inability to regain that level.
- **Stop-Loss Placement**:
- Above ~38,800 on a daily closing basis, invalidating the bearish scenario if price reclaims the broken support.
- **Take-Profit Levels**:
1. **First Target**: Near 37,000, which historically has acted as a pivot/demand area on the daily chart.
2. **Second Target**: Around 36,000, if downside momentum accelerates.
- **Risk Management**:
- Maintain a 1–2% risk allocation.
- Consider partial profit at the first target and tighten stops if the market heads lower in a sustained fashion.
3. **Supporting Factors**
- **Macro & Policy Shifts**: A sudden spike in inflation, unexpected central bank hawkishness, or severe economic data misses can quickly unwind bullish positions.
- **Institutional Hedging Unwind**: If selling pressure builds, existing hedges may intensify the move lower as positions are adjusted or closed out.
---
## KEY RISK MANAGEMENT NOTES
- **Data & Catalysts**: Swing traders should be mindful of earnings seasons, central bank announcements, and major geopolitical developments that can cause multi-day moves or gaps.
- **Trend Confirmation & Timely Exits**: Use daily closes (as opposed to intraday fluctuations) to confirm breakouts or breakdowns. Partial profit-taking at predefined levels and trailing stops on the remaining position help lock in gains while allowing participation in extended runs.
- **Sizing & Leverage**: With multi-day to multi-week holding periods, ensure that margin usage and stop placements accommodate overnight and weekend risk.
---
### CONCLUSION
For swing traders in the Nikkei, the **primary** approach aims to ride the prevailing daily uptrend toward the 40k–41k region, while the **alternate** scenario provides a structured plan if price breaks below ~38,000, indicating a deeper pullback. By integrating broader institutional positioning and macroeconomic indicators into a technical framework, traders can position themselves for potential multi-week opportunities while maintaining a disciplined risk posture.

NIKKEI SHORT TERM SET UPS SHORT-TERM (INTRADAY TO MULTI-DAY) NIKKEI SETUP
Overall Context
Institutional & Derivatives Backdrop: The broader market environment remains cautiously bullish, supported by stable liquidity and a net long gamma bias among dealers. This typically helps dampen extreme volatility and allows for orderly trend development.
Macro Influences: The global economy sits in a late-cycle expansion phase, with moderating growth but still supportive monetary policies. Headline inflation is easing from prior peaks, and major central banks are leaning toward rate cuts, collectively creating a generally favorable backdrop for equities.
Technical Structure: On lower timeframes, the Nikkei has established a significant support zone around 38,900–39,000. This zone has consistently attracted buyers, indicating that the short-term bullish case remains intact unless price decisively breaks below it.
A. PRIMARY (BULLISH) SHORT-TERM SETUP
Rationale
Capitalizes on the bullish consolidation above 38,900–39,000, where price tends to bounce and maintain its uptrend on 1H/4H charts.
With institutional flows still leaning risk-on, a break back above local resistance could trigger fresh buying interest.
Execution Parameters
Entry Trigger:
Wait for a 1H candle close above approximately 39,300 (the local lower-high pivot).
Look for a confirming signal such as a bullish engulfing bar on the 1H chart or an uptick in volume to validate momentum.
Stop-Loss Placement:
Beneath 39,000, just below the short-term bullish order block and the primary intraday support zone.
Take-Profit Levels:
First Target: Around 39,500, a nearby overhead supply area where price has previously reacted.
Second Target: Around 39,700–39,800, aligning with recent swing highs.
Risk Management:
Keep risk per trade to about 1–2% of total trading capital.
Once price reaches the first target, consider partial profit-taking and moving the stop to break-even to protect gains.
Supporting Factors
A generally bullish sentiment across major equity indices, fueled by easing global monetary conditions and stable liquidity.
The presence of robust institutional accumulation zones that tend to absorb selling around key supports.
B. ALTERNATE (BEARISH) SHORT-TERM SETUP
Rationale
Activated if the short-term support at 38,900–39,000 fails to hold.
A decisive break below this level may signal that short-term momentum is shifting negative, possibly driven by unexpected macro data or profit-taking.
Execution Parameters
Entry Trigger:
A clear 1H close below 38,900, confirming breakdown of the bullish order block.
Any retest that fails to reclaim 39,000 further strengthens the short setup.
Stop-Loss Placement:
Above 39,100, allowing some buffer for a potential false breakdown.
Take-Profit Levels:
First Target: Around 38,600, a minor support that could provide a short-term bounce or partial profit zone.
Second Target: Approximately 38,200 if selling pressure accelerates and the market continues to slide.
Risk Management:
Maintain a 1–2% risk limit.
Consider partial profit-taking at the first target and use a trailing stop on any remaining position in case of further downside.
Supporting Factors
Institutional hedging through puts or a sudden shift in risk appetite can amplify downside moves once a key support is lost.
Macro catalysts (e.g., negative economic surprises, renewed geopolitical tensions) could quickly erode bullish sentiment.
KEY RISK & TRADE MANAGEMENT CONSIDERATIONS
Event Catalysts: Keep track of economic releases and central bank announcements, as unexpected news can drive significant intraday volatility.
Liquidity & Volatility: Even though overall liquidity is robust, short-term spikes in volatility can create price gaps. Adjust position size and stops accordingly.
Partial Exits & Trailing Stops: Reduce risk once initial targets are hit. Securing gains while leaving room for extended moves can be an effective way to balance profit potential and capital preservation.
CONCLUSION
For short-term traders focusing on the Nikkei, the primary strategy leverages ongoing bullish momentum off the 38,900–39,000 support zone. The alternate strategy provides a clear roadmap should price break below this critical level, indicating a short-term trend reversal or corrective move. By integrating disciplined entries, well-placed stops, and prudent risk management, traders can navigate intraday to multi-day swings in the Nikkei efficiently.

Long Limit orderUse proper risk management
Looks like good trade.
Lets monitor.
Use proper risk management.
Disclaimer: only idea, not advice.

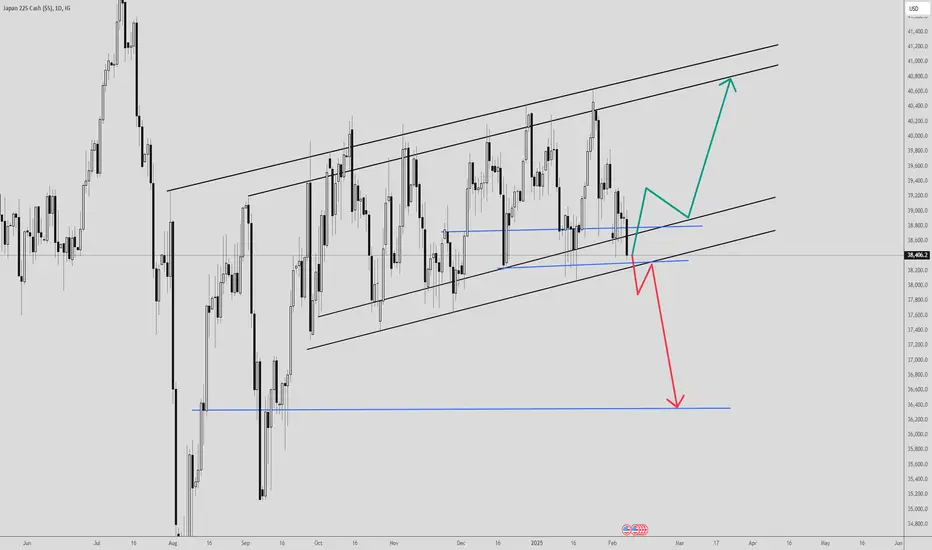
Jpn225 update Looking like a good time for short position to be made or considered. from here im seeing a down side run to start based on price action and where price is at now. a sell to weekly Lq to then buy back up into a higher price

Nikkei 225 (J225) Bearish Reversal | 1W TimeframeJ225 (Nikkei 225) is showing multiple rejections near the 40,741 resistance level, indicating a possible downtrend formation. The price is currently testing the 38,333 support, and a breakdown here could lead to a significant bearish move.
🔹 Resistance: 40,741 (Rejection Zone)
🔹 Bearish Confirmation: Break below 38,333
🔹 Key Targets: 36,702 → 35,306 → 33,828 → 30,401
If this setup plays out, a lower high, lower low structure could be in motion, pushing J225 lower in the coming weeks. However, this is not financial advice—just an educational market analysis. Manage risk and always do your own research before making any trades! 🚨


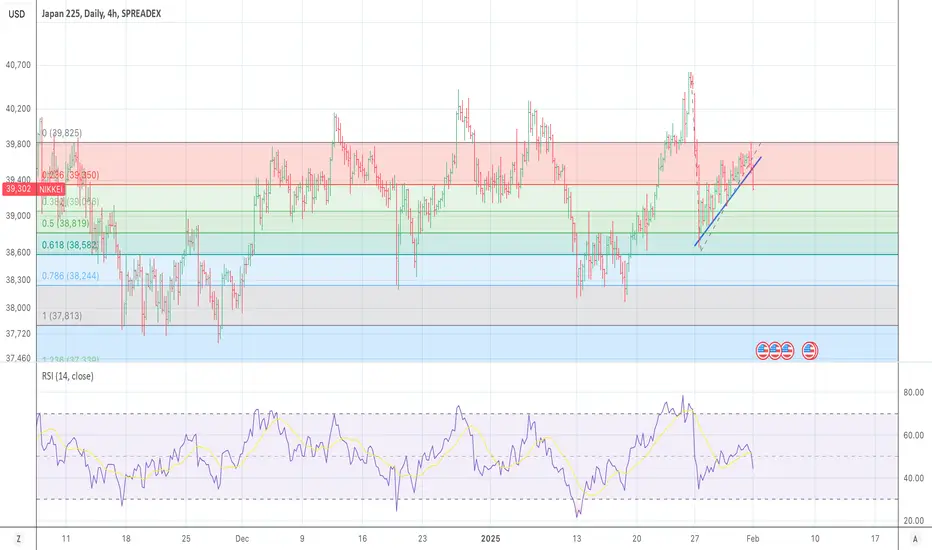
Long on Nikkei 225For now, I am long on Nikkei 225. We have a bottom, currently looking for a retest of broken support and a higher low. Once confirmed this is an easy long to the golden zone between 0.5 and 0.618 Fibonacci retracement levels.
Target 1 - 39,400
Target 2 - 40,300
For mid term I will be looking for a significant pullback from the nikkei 225. However, there is still potential for bullish price action in the short term.

Nikkei 225 index Wave Analysis – 12 February 2025
- Nikkei 225 index reversed support level 38000.00
- Likely to rise to resistance level 40285.00
Nikkei 225 index recently reversed up from the support level 38000.00, which is the lower border of the narrow sideways price range inside which the index has been moving from last October. This support area was strengthened by the lower daily Bollinger Band
The upward reversal from this support area created the daily Japanese candlesticks reversal pattern Piercing Line.
Given the clear daily uptrend, Nikkei 225 index can be expected to rise to the next resistance level 40285.00 (the upper border of this price range).

J225 JAPANThe Nikkei 225, also known as the Nikkei Stock Average, is a stock market index for the Tokyo Stock Exchange (TSE). It is a price-weighted index comprised of 225 highly capitalized and liquid publicly owned companies in Japan from a wide array of industry sectors. The index is a key indicator of the Japanese stock market and the performance of the Japanese economy.
The index includes companies from various sectors such as technology, automotive, finance, retail, and healthcare. This broad representation ensures that fluctuations in the index reflect the overall performance of Japan's economy.
Automotive Powerhouse and Renowned automobile manufacturers such as Toyota Motor Corporation and Honda Motor Co., Ltd., are prominently featured in the Nikkei 225 Index.
Financial Institutions like Mitsubishi UFJ Financial Group Inc., Sumitomo Mitsui Financial Group Inc., and Mizuho Financial Group Inc., form an integral part of the Nikkei 225 Index.
Global Giants and as well multinational corporations with a significant global presence are included in the Nikkei 225.
The Nikkei 225 is a price-weighted index, meaning that each component's weight is determined by its stock price rather than its market capitalization. However, companies with larger market capitalizations tend to have a greater influence on the overall index movement.
Review of Components of the index are done annually by the Nihon Keizai Shimbun (Nikkei) to keep correct status of each member.

NIKKEI to see a capped rally?JP225USD - 24h expiry
Buying pressure from 38377 resulted in prices rejecting the dip.
The current move higher is expected to continue.
With the Ichimoku cloud resistance above we expect gains to be limited.
We therefore, prefer to fade into the rally with a tight stop in anticipation of a move back lower.
Further downside is expected although we prefer to sell into rallies close to the 39400 level.
We look to Sell at 39400 (stop at 39732)
Our profit targets will be 38452 and 37705
Resistance: 39660 / 40720 / 42155
Support: 37705 / 36330 / 34955
Risk Disclaimer
The trade ideas beyond this page are for informational purposes only and do not constitute investment advice or a solicitation to trade. This information is provided by Signal Centre, a third-party unaffiliated with OANDA, and is intended for general circulation only. OANDA does not guarantee the accuracy of this information and assumes no responsibilities for the information provided by the third party. The information does not take into account the specific investment objectives, financial situation, or particular needs of any particular person. You should take into account your specific investment objectives, financial situation, and particular needs before making a commitment to trade, including seeking advice from an independent financial adviser regarding the suitability of the investment, under a separate engagement, as you deem fit.
You accept that you assume all risks in independently viewing the contents and selecting a chosen strategy.
Where the research is distributed in Singapore to a person who is not an Accredited Investor, Expert Investor or an Institutional Investor, Oanda Asia Pacific Pte Ltd (“OAP“) accepts legal responsibility for the contents of the report to such persons only to the extent required by law. Singapore customers should contact OAP at 6579 8289 for matters arising from, or in connection with, the information/research distributed.

Is there life in the old dog yet? Thoughts on Japan...Japan, once known for its high standard of living and expensive prices, has seen a dramatic shift. Today, Japan is often praised by travellers for its affordability, with the Yen weakened by decades of financial repression. While Japan's industrial and infrastructure standards remain high, its citizens are becoming poorer. The average monthly income has fallen sharply from $4,000 in 2012 to just $2,240, putting it on a par with countries such as Spain.
Japan's current economic policies, particularly its refusal to raise interest rates despite inflation remaining above the 2% target for over 31 months, are worrying enough. The Bank of Japan's reluctance to adjust interest rates due to Japan's high level of government debt has kept the key interest rate at just 0.25%. As a result, Japanese savers have turned to foreign currency investments, further weakening the Yen.
Currency depreciation has never led to greater competitiveness or long-term prosperity, and countries such as Argentina and Italy are examples of where such policies have failed to deliver the desired results. In contrast, countries such as Singapore, Norway and Switzerland remain at the top of global income rankings. We could also draw parallels with Germany's own departure from the "hard currency" club, as it and the wider Eurozone follow Japan's economic model.
Questions on my mind:
- Given Japan's current economic environment, how do we view on the long-term stability of the Yen?
- With Japanese wages stagnating, do we see opportunities in Japanese equities or sectors that could benefit from a weaker currency?
- How might Japan's refusal to raise interest rates affect foreign investment in the country over the next few years?
- Do you think the trend of low interest rates and currency depreciation will continue in the Eurozone and how might that affect global markets?
- In a scenario where Japan continues on this economic path, what other regions or emerging markets might offer better investment opportunities in comparison?

Jpn225 update sell to buy Looking like a bullish market after sellside is taken on the daily. we can expect indicies to reach for new HH soon lets see

SELL NIKKEI Long TermThe price has closed a bearish bar, covering the preview rejection candle spikes, which means, that the buyers could not push price from this level.
There is the probability that the price will fall until next support level.
As for buy scenario, the price must cluse a bullish engulfing candle!
Nikkei225Nikkei225 is in a correction phase. The price has a chance to test the support zone of 37528-37039. If the price can still stand above 37039, it is expected that the price will have a chance to rebound.
🔥Trading futures, forex, CFDs and stocks carries a risk of loss.
Please consider carefully whether such trading is suitable for you.
>>GooD Luck 😊
❤️ Like and subscribe to never miss a new idea!

Is it going to ATH !? Nikkei A long consolidation.
Higher bottoms.
Waiting for buy to get triggered.
Upvote if you agree.
Nikkei

Good risk to reward sell on NikkeiWe are entering a sell on Nikkei based on the following:
1) Daily Trend is down
2) H4 is down
3) There is a sell pattern on M15 at yesterday's high
4) Good risk to reward

jp225 buy tradeThe Relative Strength Index (RSI) is showing an upward trend, indicating increasing momentum. Additionally, the Moving Average Convergence Divergence (MACD) is showing a bullish crossover, further supporting the potential for an upward move.

Asia Session LIVE - JPN225 + 20RTook 2 day trades and 1 scalping entry on JPN225. Nice move and shows the fractal nature of the markets. Not too many setups in Asia today for me, so I focused just on trading price action on my core pairs.

JP225 - Elliott Wave Analysis & Market OutlookJP225 - Elliott Wave Analysis & Market Outlook
1. Elliott Wave Structure Analysis
🔹 5-3-5 Zigzag Formation
In the early phase, a 5-3-5 Zigzag correction was identified, indicating that after an A-B-C corrective phase, the market resumed an upward trend.
This classic correction pattern suggests that although there was a strong retracement, the overall trend remains bullish.
🔹 Double Three Running Flats
The market appears to have formed a Double Three Running Flat, which signals a sideways correction rather than a deep pullback.
A Running Flat structure typically suggests that after the correction completes, the trend will resume in its original direction. If this pattern belongs to a larger B wave, an impulsive C wave up is likely to follow.
🔹 Current Structure - WXY Correction
The latest wave count indicates a WXY corrective structure, with potentially marking the end of the correction.
If this belongs to a higher-degree B wave, we could be approaching the start of an impulsive C wave rally.
2. Key Support & Resistance Levels
✅ Major Support Zone
A strong support zone is marked in yellow, where price has rebounded multiple times.
As long as the market holds above this level, the likelihood of a bullish reversal increases.
🚨 Major Resistance Zone
Volume Profile shows significant resistance around 38,400, making it a key level to watch.
42,400 is the previous high and a crucial breakout level. If the price pushes above it, the rally could extend further.
3. Volume & Market Strength Analysis
📊 Volume Observations
The spike in volume near the support zone suggests that buyers are stepping in aggressively.
If price breaks above key resistance with strong volume, it would confirm the start of an impulsive move.
4. Trading Strategy & Outlook
📌 Short-Term Trading
Look for long opportunities near the support zone, with a stop-loss slightly below the recent low.
Initial target: 38,400-39,200 zone.
If this level breaks, the next target would be 41,000-42,400.
📌 Mid to Long-Term Positioning
If the WXY structure has completed, this could be the beginning of a larger impulsive rally.
Volume accumulation around 38,000 suggests that once price clears this level, a strong bullish continuation is likely.
📌 Risk Management
If the market breaks below the key support zone, a deeper retracement may occur, requiring a reassessment of the wave count.
Monitor price action and volume closely to avoid false breakouts.
Conclusion
✅ This study applies Elliott Wave principles, Volume Profile, and technical indicators to assess JP225’s trend structure.
✅ The market may be completing its correction phase, with a potential WXY structure signaling the end of the pullback.
✅ Watching for a breakout above Volume Profile resistance could provide confirmation of trend continuation.
///=======================////
JP225 - Elliott 波浪分析與市場展望
1. 波浪理論結構分析
🔹 5-3-5 Zigzag 修正
在早期趨勢中,市場形成了一個 5-3-5 Zigzag 修正浪,顯示經過 A-B-C 修正後,市場重新進入反彈模式。
這是一種經典的修正形態,代表市場出現強烈回調,但整體趨勢仍然偏多。
🔹 雙重三浪 Running Flats
目前市場進入 雙重三浪 Running Flat 修正結構,這意味著 市場的修正是橫向延伸而非深度回調。
Running Flat 結構通常表示 修正完成後,市場將恢復原來趨勢。如果這屬於較大級別的 B 浪,那麼接下來有機會迎來 C 浪上升。
🔹 當前結構 - WXY 修正浪
近期的波浪結構顯示 WXY 組合修正浪,其中 可能是修正結束點。
如果這個結構屬於更大級別的 B 浪,市場可能即將進入 新的推動 C 浪,開啟新一輪漲勢。
2. 關鍵支撐與阻力位
✅ 主要支撐區域
黃色區域 標記的支撐位已多次測試並反彈,說明這是一個 強勁的支撐帶。
只要價格守住該區域,則市場仍有機會延續反彈。
🚨 主要阻力區域
成交量剖面(Volume Profile)顯示 38,400 附近有大量籌碼堆積,此區域將成為短期壓力位。
上方 42,400 為前高壓力位,若突破則可能開啟更大級別的上漲行情。
3. 量價結構分析
📊 成交量觀察
支撐區域成交量明顯增加,顯示資金正在積極進場。
若價格 突破關鍵阻力並伴隨放量,將進一步確認新一輪趨勢啟動。
4. 交易策略與市場展望
📌 短線操作建議
在支撐區附近尋找買點,並設置止損於支撐區下方。
第一目標價位:38,400-39,200。
若成功突破,則可進一步看向 41,000-42,400。
📌 中長線布局策略
若 WXY 修正結束,則市場可能即將進入 C 浪推動階段,適合開始中長線多單佈局。
38,000 附近成交量積累較大,若價格突破並站穩,可能會帶來更大級別的上升趨勢。
📌 風險控制建議
若價格 跌破關鍵支撐區並收於低點,則市場可能進一步下探,需要重新評估波浪結構。
需密切關注 成交量變化與價格行為,避免誤判行情。
總結
✅ 本次分析應用了 Elliott 波浪理論、成交量剖面(Volume Profile)及技術分析來判斷 JP225 的市場結構。
✅ 市場可能接近修正尾聲,WXY 結構的完成可能預示新一輪上升趨勢的啟動。
✅ 如果價格突破成交量密集區,則將進一步確認趨勢方向。
建議考慮加入 RSI 或 Impulse MACD 等動能指標,以進一步確認市場轉勢訊號!🚀

Japan short term Short Set upTaget 1 - 38600, Target 2 - 38200, Target - 37800, Stop - Closing above trendline/channel
Trade Recaps - JPN225 [L], UK100, USDCHF [L], GBPJPYRecapping all the trades I took from Wednesday to Friday.
