RTY Expansion zone - Trend TBDWe're experiencing another Expansion zone as highlighted before. Market will be deciding on Trend. Under that average price will result in a down trend.
USSMALLCAP2000CFD trade ideas

Look for gold to overtake Russell first.You just can't overtake a 7 year rate of change that easily.
While we wait for Nasdaq to roll over vs gold, let's look at the weakest of US Equities to roll over first!

RUT snap back rally Market is following Boeing stock with a delay. If anything we should reach top 2900/3000 in feb 2022 and than collapse 80 percent by march 2023

$RTY | WEEKLY WATCHLIST 11/29Have been tracking this for awhile now. Expecting a base to build here before our next leg higher towards $2650+. Eyeing a position on this one very soon. ($IWM)

A good place to start scaling for a bounceI think this is a good place to start scaling into the RTY longer-term or short-term potential bounce.
In 6 months we will be at a very different place.
With the proper position sizing you could start scaling in 5-10% of your planned investment in Russell if you don't have any position already.
Risk reward potential is greater that it one day will retest any of the levels above.
There are some nice trades that can be made with this.

Market sell off in small cap stocks Market sell off in small cap stocks. Small cap stocks are usually the first to sell off and the last to rally bad times for the markets ahead?

Was this the final hurrah? Sell US EQTYFollowing on from the last post on here, (links below)
RUT, broke the range I mentioned 2150/2350 indicating the bull still held.
I said clues of how the RUT behaves at the range highs would be an indication of overall market strength
We are now there.
RUT broke highs- but HAS NOW FAILED to be convincing - (by closing back inside the range)
Even if you don't pay attention to volume (you should!), that chart pattern is the epitome of trading.
Add it to knowing when there is "lopsided positioning" you have a trading methodology .
Positioning data freely published is COT data, and it has "Asset Managers" as excessively long here,
ie "Smart money managers" are heavily positioned to one side (long)
=> so, any down moves, and they will be puking their positions and adding to downside movement...
(you get paid when other people are stopping out, panickedly hitting "Market Orders to close", forcing price in the direction you want)
Along with all the "market internals" I have banged on about before - all deteriorating....well....
it's all similar to when i last posted an idea with the same title

Market Pulse ed.11.11 DAY TRADING SYSTEM Sharing potential #trade setup and insights
How to make your account go green.
*Simple tools,
*Price
*Supply and Demand
*MAcd
*50Dma
*News
Using #Tradingview, amazing tool for tracking and charting...
Here is a link for free account:
www.tradingview.com
For my chart setup : www.tradingview.com
Disclaimer:
Not a Financial Advisor. Not recommendation to Buy or Sell.
#stocktrading #optiontrading #momentumtrader

Market Pulse ED.11.05, Today trade setups, raw and uneditedFollow up to Morning Brew setups:
Sharing potential #trade setup and insights
How to make your account go green.
*Simple tools,
*Price
*Supply and Demand
*MAcd
*50Dma
*News
Using #Tradingview, amazing tool for tracking and charting...
Here is a link for free account:
www.tradingview.com
For my chart setup : www.tradingview.com
Disclaimer:
Not a Financial Advisor. Not recommendation to Buy or Sell.
#stocktrading #optiontrading #momentumtrade

$RTY | UPDATEAlmost at the wave 3 target, upside limited in my opinion. Wait for the wave 4 dip. It will be a gift in the market.
Thank me later.

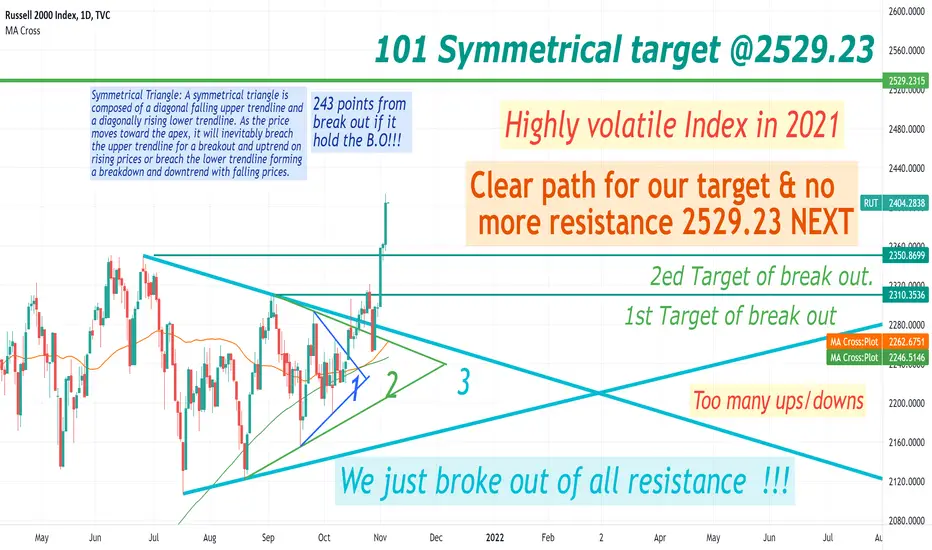
Hard to analyze W/ high volatility in 2021 !Symmetrical Triangle: A symmetrical triangle is
composed of a diagonal falling upper trendline and
a diagonally rising lower trendline. As the price
moves toward the apex, it will inevitably breach
the upper trendline for a breakout and uptrend on
rising prices or breach the lower trendline forming
a breakdown and downtrend with falling prices.
History repeatsFrom 1900
history always repeats.
learn history.
long explaination is not helpful.
wisdom is taken only by soul walkers
źzzzzzzzzzzzzzzzzzzzzzz
zzzzzzzzzzzzzzzzzzzzzzzz

Russell 2000 finally breaks out of consolidaton.RUT breakout from a consolidation in place since March. Look for the prior uptrend to continue.

$RTY | TRADE IDEALimited upside left on this wave 3. Wave 4 pullback to retest the breakout will be a GIFT. Targeting $2555 from there.

RUT Breaking out?The Russell 2000 pushing to the upside. May want to make a run to the top of the long term range. Maybe rotation from mega caps back to smalls?? Something to watch.

Market Pulse week of NOV1 40K to start the week Trading View recording not working .... Will have raw and unedited setups everyday M-f 12:est
Rut setup given this morning pre-market in Morning Brew
So many more Link at the bottom
Video link to Market Pulse
Isrg possible setup for afternoon run
Nvda taking off
Roku taking off for pre earnings ..

US2000 - Price Action combined with WXY corrective structuresMarket phases - Price Action
In short:
• the market rises when price makes higher highs and higher lows.
• the market goes down when the price makes lower highs and lower lows,
• The market goes sideways when price does not make higher highs and higher lows or lower highs and lower lows.
It may sound childishly simple, almost like stating something obvious, but
you will be amazed how often people forget these simple facts. One
the most important question is: "Where is the market going?"
sequence:
The change of direction is confirmed when
the price is rising above recent highs
(as seen in the chart above).
In other words, it is a reversal
1-2-3 - you go long (buy, eat) after
correction above pillar level

RTY: A Perfect Place To SELL!On the daily chart, the price is moving inside a big corrective pattern. Actually, it is testing the top of the structure and the chances are very high that we may see Russell moving lower again. The targets are placed taking into consideration the structure areas.
Targets:
2255
2220
2124
Thank you and Good Luck!

US Russ 200 Long Oppertunity- would enter a long position if we get a close above 2316usd
- first target is the next blue line, if we get above next target would be the ATH

Which direction you think the Russell 2000 is going?Dude, it's pretty obvious it's up!
Been consolidating for a while now.
Will breakout within next couple weeks.
Go go go!
Wake Up Time for the Russell 2000?The Russell 2000 has been snoozing for most of the year, following a sharp rally last winter. Now traders may want to watch for signs it could be waking up.
The main feature on this chart is the series of higher lows since August, while the top of the range has remained around 2310. That’s starting to resemble a bullish ascending triangle. It’s also noteworthy that RUT made higher lows in September and early October, while the S&P 500 and Nasdaq-100 made lower lows versus August.
Next, the consolidation has occurred along the 200-day simple moving average (SMA).
Third, RUT just completed a bullish inside candle on the weekly chart.
Consider the events calendar, with major tech names like Apple and Amazon.com reporting this week. Once those catalyst pass, sentiment may shift.
TradeStation is a pioneer in the trading industry, providing access to stocks, options, futures and cryptocurrencies. See our Overview for more.

rus2000usd Long move continuationrus2000usd Long move continuation after the correction structure. To the resistance trendline.

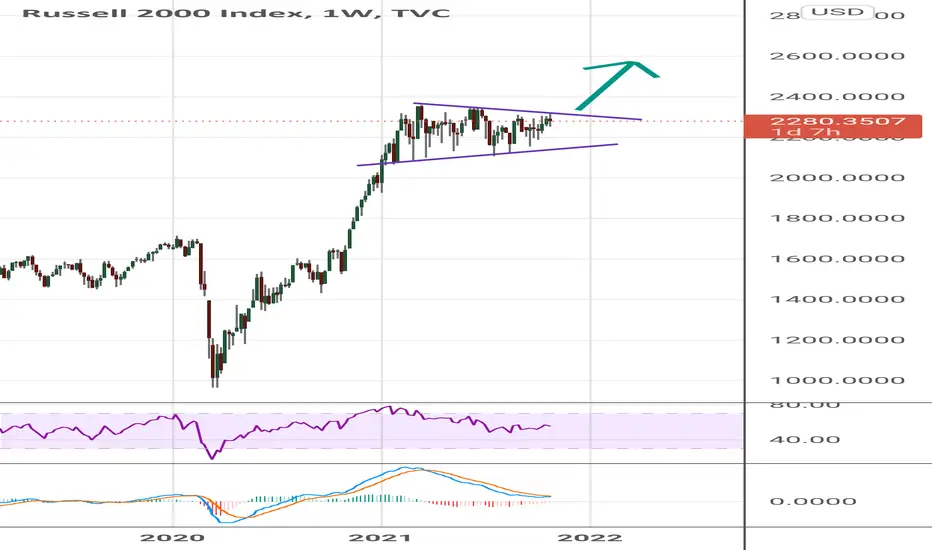
Russell 2000, break out 2ed day.Symmetrical Triangle: A symmetrical triangle is
composed of a diagonal falling upper trendline and
a diagonally rising lower trendline. As the price
moves toward the apex, it will inevitably breach
the upper trendline for a breakout and uptrend on
rising prices or breach the lower trendline forming
a breakdown and downtrend with falling prices.
