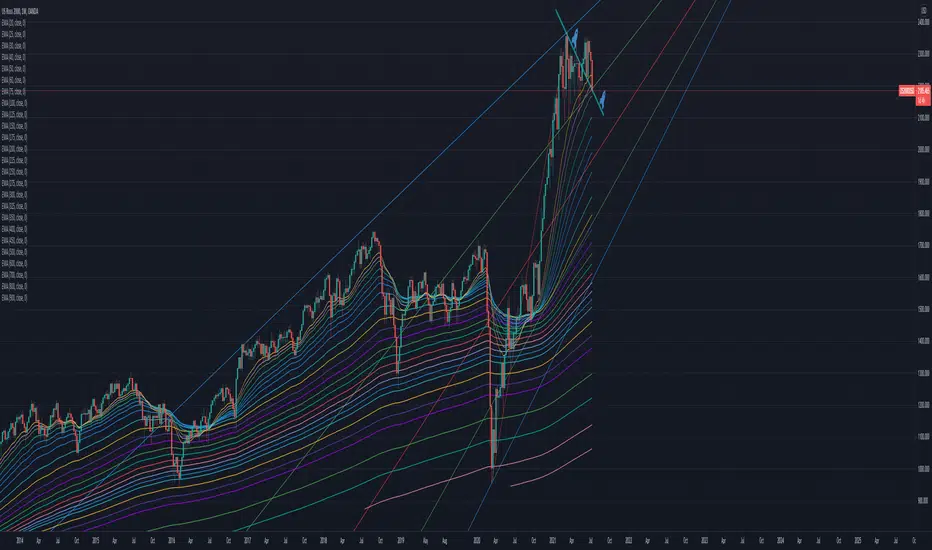
$RUT Russell 2000 Setting up for Major Multi-Year RunPrice action appears to be setting up for '04 performance. The Russell has more runway relative to the S&P and Nasdaq.
USSMALLCAP2000CFD trade ideas

Russel 2000 - last leg upSmall caps have had a rough time in the last few months.
See if RUT is showing us a bright near future?

Buying Russel2000 on the 1h counter trend line break bullishRussell2000 is moving higher in the major daily uptrend with daily up fibonacci ABCD 1,618 D extension @ 2590. Since 2021 February index is consolidating in the daily range with support @ 2100 and resistance @ 2310. Last week it tested daily range support and bounced off it. So now it is moving to daily range resistance.
On 1h it started to form an up trend line. I'm buying 1h counter trend line bullish in the buy zone. I'm going for profit of 90 points with 1:2 RR.


RUSSELL 2K AND DOW TRANSPORTS TOPPED?The combination of RUT and DTX has created a rising wedge. Price has broken down out of the wedge. These two indices are known to lead the broader market, so their topping in early June is interesting. Price topped in coordination with an RSI divergence before breaking down from the lower trendline of the wedge. This seems to have a good chance of going lower.
NOT INVESTMENT OR TRADING ADVICE

Which High is ACTUALLY HIGHER ? Which Low is ACTUALLY LOWER ?Sometimes a series of HIGHS or LOW have virtually the same PRICE, … So what can a TRADER do ???
First a little back ground, In real simplified terms; The prices printed on the Russel Index (or any Index or stock) represents the Russel’s “intrinsic value” multiplied by the “relative value” of the dollar.
Therefor the background price action of the dollar actually distorts the price action displayed on the Russel index which is derived from stock dollar values.
Most of the time this distortion is negligible but sometime it’s not, .... particularly when the dollar has big swings or the index or stock is trading sideways or near bottoms and tops.
A simple trick to resolve this dilemma is to remove the influence of the dollar from the equation. You can do this in TRADING VIEW by dividing the index or stock by DXY.
This will then print for you a closer wave pattern resembling the real intrinsic value / momentum behavior of the underlying Index of Stock.
For example: Note the subtle changes on the Russel Index chart pattern from LEFT to RIGHT after the influence of the dollars was removed.
Hopes this helps.

RUT - Russell 2000 - Breaking for SouthRussell 2000 Outperformed SP500 but now can't hold it's growth are this rally exhaust it's a difficult question.
If we look into all Bonds Yields and we can figure out these all are dropping and it should not be happen in growth or inflation time,
S&P 5000 Pushing higher but if look inside story Mid and Small caps stocks dropping it means only few giants pushing this index high but in zero interest rate atmosphere if these mid and small caps can not gain means these overvalued or low confidence or some other factors?
We need to stay informed and prepare

US2000USD: RUSSEL ELLIOTT WAVE ANALYSISNew Local Low before continuing impulse higher
Trade Your Plan

RUT
I told you 🧘🏻
also fake breakdown and recover the range, is a positive signal, 2150-2200 the best zone for bought it in the SHORT TERM, be careful!

Bullish thesis on small capsEntry here would be very low risk. We have:
- bullish continuation pattern (ascending triangle)
- triple hidden bullish divergence on MACD on 4h chart
- price sits right at a support level/trendline that held multiple times
- RSI support on 4h chart
Stop loss here could be very tight, just below the support level/trendline that we are hugging right now. It feels like recent price action was affected by Russell rebalancing and it might be a case of people selling the news but I wouldn't panic just yet. Zooming out the overall trend is still very bullish adding to the argument.

Dangerous Situation in small caps!Hourly Chart: Top Swing
Daily Chart: Right at the support level. (possible price action for few days)
Weekly Chart: close at the lowest level since February
Monthly Chart: -6.38% since the beginning of July, the Worst performance since March 2020..!
Conclusion: This correction could slip to a bearish market..! Risk is high..!

Why Small caps are at higher Risk!history tends to repeat itself..! and what has happened in the past has a higher chance of happing in the future!
March 2009 - Sep 2011:
Oct 2011- Jan 2016:
Feb 2016 - Dec2018
I will wait for the reaction to the trend line! closure below the trend line could bring a 20% further correction!

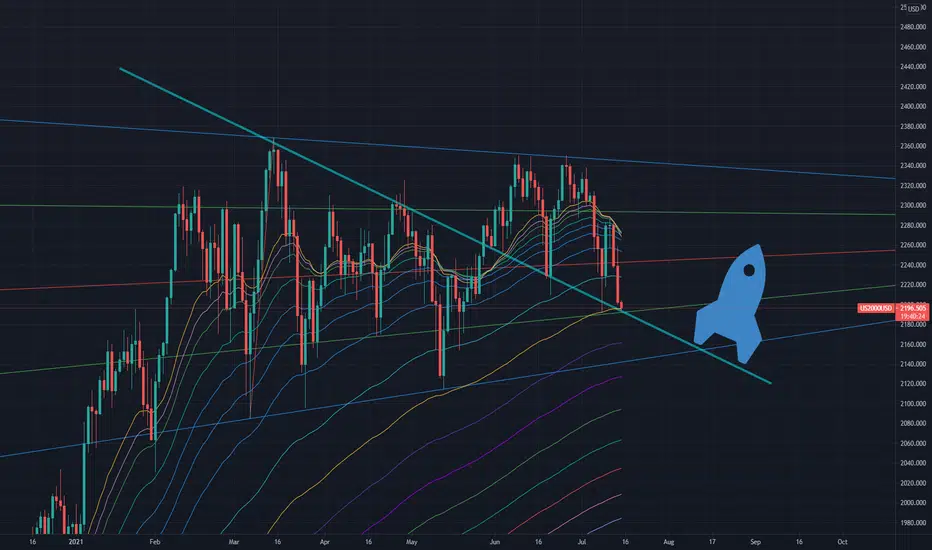
US2000 - Important support and perfect pitchfan for long positioHi friends!
Here a very interesting idea for Russell. You can check the diagonal treding support vs pitchfan convergence and 25 weekly EMA. In my personal opinion, we have an interesting opportunity for long position, So I am opening new long entries. Please let me know your comments.
Thank you!
Israel
US2000 - Important support & pitchfanHi friends!
Here an interesting idea. I really think this index has reached important support.
I have opened new long positions.
Any comments?
Good luck!
Israel
Fasten your seat belt..!If you have invested in small caps heavily, please fasten your seat belt (tighten your stop loss).
Small caps decreasing their altitude to land, but where is the nearest airport (support)?

Small Caps Are StrugglingThe S&P 500 keeps hitting new highs, but the Russell 2000 small cap index hasn’t been so fortunate.
RUT has gone almost four months without a new record level. In contrast, the Dow Jones Industrial Average and Transports haven’t hit a new high in over two months. The S&P 500 and Nasdaq-100 hit new highs this week.
A few bearish patterns stand out on the small cap chart. First, notice the lack of bounce at the 50-day and 100-day simple moving averages (SMA). This is different from the earlier rebounds at those lines in May and June.
Next, the shorter time frame: RUT’s 8-day exponential moving average (EMA) crossed under the 21-day EMA last week and has remained below it.
Turning to the longer-term weekly chart, we see a bearish inside candle at the end of June. A red bar followed and now we’re in another down week:
It’s not totally bearish overall, but there are growing signs of weakness and poor relative strength. If the market has summer volatility, the sellers may begin their work in RUT.
TradeStation is a pioneer in the trading industry, providing access to stocks, options, futures and cryptocurrencies. See our Overview for more.

US2000 30mRussel is weak compared to the other indices
forming Gartley pattern, which is a quite reliable pattern
R/R > 4

RUT
looking for entries!, Russel had a little correction, remember, long term is bullish!, also still sideways

Continuing or Reversal pattern that is the question?This pattern shows small caps experiencing a complex correction.
Best plan could be hold and wait for reaction to support level.

Awesome symmetry Russell 2000 NeutralJust take a look at the chart and its lines. Very useful to anticipate for a trade.


RUT Motive Impulsive Response to May 18th Triangle completion Look to place some +ve Delta Butterflies on RUT or Bullish verticals to capitalize on this move

