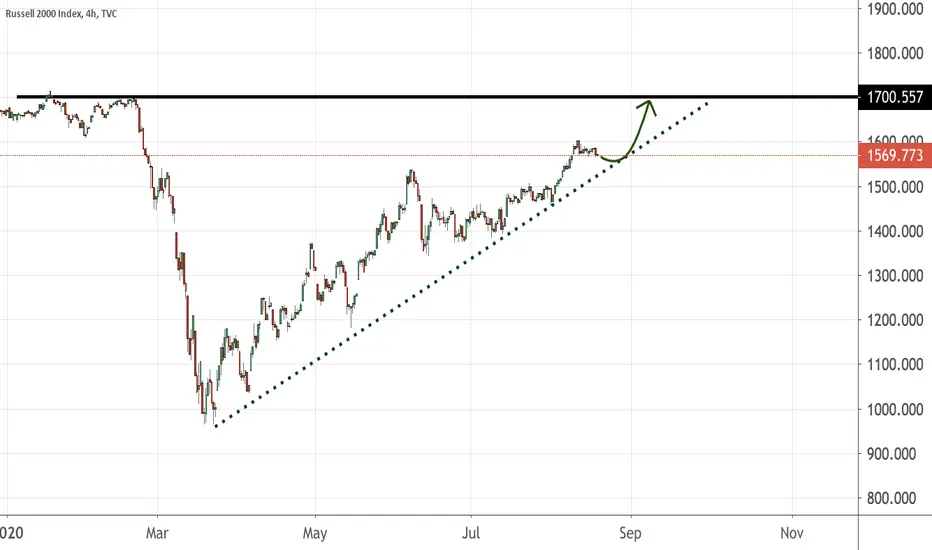
Buying opportunity for Russell 2000See chart
Wait for the price to fall towards the bullish trend line first, establish bullish signals then place your long positions. If it breaks down from the trend line, the trade plan is called off.
USSMALLCAP2000CFD trade ideas
Apocalypse Us Stock Index...We are in for a massive ride to the downside..
Weekly Macro Levels are in play and on the 4H the market is already making LowerLows & LowerHigs..
Wait until the market has left the Setup Structure and keep this trade until the very end!
Only shorts from now on!!
Trade Safe & Buckle up!!


Market correction I’m shorting small caps here. VIX is on an uptrend. All indexes/ assets starting to top out momentarily IMO. In combination of the stimulus package fallout and important economic data coming out soon plus a lot of highs being reached across most markets I have turned bearish for the time being. I have opened up a short on small caps as I believe they’ll be hit the hardest in a correction. I also have opened some long VIX calls, will most likely post something on that later. I am using this as a sort of hedge for my crypto portfolio. I am still Bullish long term on crypto’s but we’re due for a correction. This is NOT investment advice. My published ideas are my own opinions. I use them to hold myself accountable and to try and improve upon my investing strategy.

RUSSELL 2000 Rally (Pequeñas Empresas) (Small Companies Index)
Russell se acerca a un nuevo territorio que podría borrar los viejos números arrojados por COVID. Es técnico hablar de 1700 puntos como la resistencia más dura, pero es la meta en el corto plazo para así nivelar la psicología sobre la recuperación económica.
------------------------------
Russell is aproaching a new territory which could erase old COVIDS results, it is technical that 1700 points is the hardest top, but that is the goal in a short term.

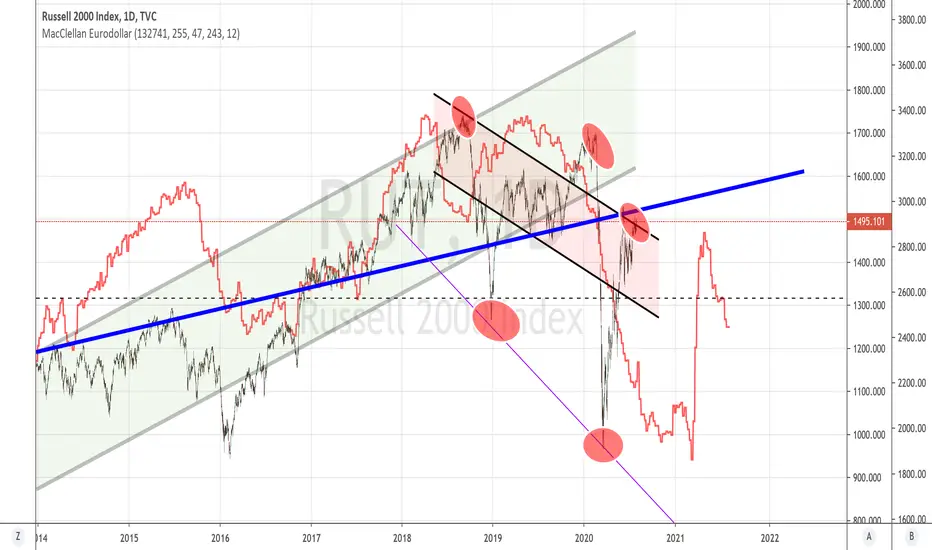
RUT- The final golden cross for the major indexsAccording to Finviz, more than 75% of stocks are above SMA50 and close to 60% of stocks are above SMA 200. Furthermore, SPX has stayed above 3200 for a month.
Historically, DJI is usually the first index to recover after the market crash because investors want to put their money in safe mega cap and blue chip stocks
during the bottom-out process and time of uncertainty.
However, Covid-19 is producing the favorable environment for e-commerce company and internet/IT services company that power e-commerce to thrive, leading to the NDX's wild surge and SPX & DJI's unusual lag.
Russel 2000, the small cap index, is usually the last one to join the rally because it is usually deemed as a risky investment by investors, especially during the time of uncertainty.
Therefore, when investors flock to RUT (Russel 2000), it could signal and reaffirm the bullish sentiment among investors, drawing the last of doubters and FOMOers into the market.
That time could be now.

US2000 biggie smalllook at the bigger picture
AND
the minor details
whys the PA been doing THE things repeatedly
...like a fool
to catch em fools
act like one
anyways in layman's
R:R at each structure's
don't matter what direction :D~

RUT en Ascenso/ RUT 2000 RisingQuizás podría golpear el nivel de 1540, pero esto es una señal de estímulo de la FED a las pequeñas compañías.
Ten precaución porque estamos esperando un momento general de volatilidad.
—————————
Maybe it could Hit the top at 1540, but it is a sign of stimulus from FED to small companies.
Be aware because we are holding a moment of volatility in general.

US2000 OptionsCurrently I am short, look out for bounce to double top, then direction is dependent on Feds printer breaking.

RUT Month End EvaluationTrend Analysis:
The current trend is defined by the last price and it's relationship to specific moving averages.
Check the MA strategy for more specific suggestions.
Monthly: The relationship to the primary trend MA is bullish. The price in relationship to the other averages suggest prices are caught in consolidation/transitioning to new direction. Ensure your stops are placed.
Price Action:
Monthly: The average price range currently is 169.67 points/ticks/pips. Prices are currently .04x the normal trading range. Prices are trading within the mean range for activity. This generally indicates a consolidation of strength/indecision in the market regarding direction.
Prices are currently caught in consolidation between 1181.10 and 1537.62.
While in consolidation the trade range may decrease to 104.442 points/ticks/pips.
Standard Deviation
Monthly: Standard deviation suggests a range from 1364.34 to 1596.52 for the following month.
Calculated Price Strength:
The strength of the trend in conjunction with specific averages
Monthly: Trend strength suggests a trade range of 1375.57 to 1585.29 for the following month.
Price Projection:
The price action has generated a projection signal for the underlying.
Monthly: Price currently displays (if strength and attitude continue) a desire to move toward 1661.72
If strength and attitude continue, it could take between 1 to 2 trade periods (months) to reach the projection.
Indicators Summary.
A collection of technical indicators whose directional attitude has been summarized.
Monthly: Out of the cumulative indicators monitored, 36.36% are bullish, 36.36% are bearish, 27.27% are neutral

RUT: Targeting 800-900Lower Highs & lower lows... And now at a long term resistance. You know what that means ?
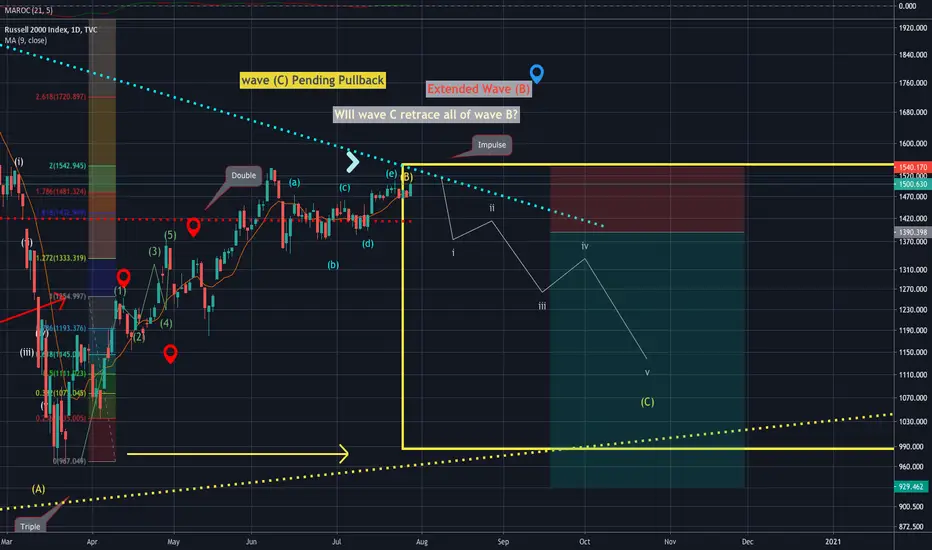
RUT pending pullback The RUT daily chart shows we could be in sideways market here facing resistance at 1490. To the minor degree, wave y resistance at 1510 originating June 9th at around 1536 depending on the angle of approach.

Russell Consolidando / A Lateral RussellEste índice, una lupa muy importante a 2000 Pequeñas Empresas que determinan la verdadera salud económica de USA, se encuentra en un rango de vital impulso pero el que ahora solo ha consolidado.
Su equilibrio de como iban las cosas antes del virus, estaba en 1700 pts. Debe acercarse en el mediano plazo y consolidar un poco más arriba para que la barrera psicológica que hasta ahora Dow Jones, SP y Nasdaq han logrado, complementen la continuidad al alza.
————————-
This is a fundamental index, it is a macro picture of small companies in USA, these companies tell you more about employment data, bankruptcy, etc, with a microscope. The index must consolidate at this area (1500 aprox) and take another jump to 1700 points at least in a mid term, joining the sentiment with Dow Jones, SP and Nasdaq.

RUT Wave (C) pending pullback Updates on exiting bearish biased butterfly, as the RUT consolidation continues, the longer it stays sideways, the bigger expected move is consolidation if ended.

RUT End Of Week EvaluationTrend Analysis:
The current trend is defined by the last price and it's relationship to specific moving averages.
Check the MA strategy for more specific suggestions.
Weekly: The relationship to the primary trend MA is bullish. The price in relationship to the other averages suggest long positions
Price Action:
Weekly: The average price range currently is 127.47 points/ticks/pips. Prices are currently .5x the normal trading range. Prices are trading within the mean range for activity. This generally indicates a consolidation of strength/indecision in the market regarding direction.
Prices are currently caught in consolidation between 1343.60 and 1537.62.
While in consolidation the trade range may decrease to 78.486 points/ticks/pips.
Standard Deviation
Weekly: Standard deviation suggests a range from 1335.063 to 1600.046 for the following week.
Calculated Price Strength:
The strength of the trend in conjunction with specific averages
Weekly: Trend strength suggests a trade range of 1388.78 to 1546.33 for the following week.
Price Projection:
The price action has generated a projection signal for the underlying.
Weekly: Price currently displays (if strength and attitude continue) a desire to move first toward 1424.26 before moving toward 1494.30
If strength and attitude continue, it could take between 1 - 2 trade periods (weeks) for the first projection and 1 - 2 to reach the second projection.
Indicators Summary.
A collection of technical indicators whose directional attitude has been summarized.
Weekly: Out of the cumulative indicators monitored, 80.00% are bullish, 0.00% are bearish, 20.00% are neutral
The CCI indicator trading strategy suggest the following:
Weekly: Strongly bullish - No entries at this time. If in, consider covering..
Confirmation Signal
6 indicators combined to confirm entry/exit.
Weekly Bullish - Open directional trades

Time is running out for Russell 2000! $IWMRussell 2000 still has a decent amount of momentum on the H1 and Day time frames, but it is decision time next week into the FOMC statement and press conference. It is time to decide if we obey election year seasonality (and get an emergency PUA extension next week likely) or fall into mid August.
Please like this post 👍🏻 and give me a follow!
PM for more information on how to retrieve these dark pool blocks ⚫️ on demand and watch them stream in on all of your devices 📱 💻!


Russel 2000 Elliotwave Count The Russel 2000 is probably exhibiting one of the clearest Elliotwave counts of all US Indices.
For one we can see a very clearly impulsive 5-wave drop from June 8th highs to June 15th lows.
Next we see a triangle in the middle of the retracement higher since which is a classic middle-of-retracement move.
Triangles are patterns prior to final ending wave...either as a Wave 4 (prior to wave 5) or as a wave B in the middle of an A-B-C 3-wave retracement.
In this case, we count a 5-wave wave A of the corrective A-B-C ---- then the 5 wave middle B triangle pattern (which I mentioned above) and since then the final wave C of the ABC shows 5 wave up.
Since we see a potential 5-wave leading diagonal and a 3 wave retracement which is potentially pointing to the beginning of the next massive wave down - similar to what happened between June 8 and 15.
The triangle pattern in the corrective pattern is what is very clear to me here and which points to the retracement since the June 15th low being a corrective pattern.
If this is indeed correct then the Bearish implications should carry over into the Dow and S&P.
Cheers!
Cyrus

RUT wave (C) Pullback Though no chart updates, RUT could unfold into wave (C) corrective wave lower. Immediate resistance 1480 likely to find a wave (E) top for now. RUT wave (C) focus on on remaining push into 1200.
