TQQQ/SQQQ Buy/Sell/Hold zones for tomorrow
Buy/Sell/Hold zones in Grn/Red/Ylw for Nasdaq100 tomorrow. I've been exclusively trading TQQQ/SQQQ lately so this is my full trade plan for tomorrow.
USTECH100CFD trade ideas

this is what june will look likeEveryone thinks the downtrend is over. it's not. the bulls are doomed, we are going to sell off for a year. sorry to be the bearer of bad news.

Nasdaq-100 H1 | Swing-low support at 61.8% Fibonacci retracementNasdaq-100 (NAS100) is falling towards a swing-low support and could potentially bounce off this level to climb higher.
Buy entry is at 20,877.40 which is a swing-low support that aligns with the 61.8% Fibonacci retracement.
Stop loss is at 20,640.00 which is a level that lies underneath a swing-low support.
Take profit is at 21,243.05 which is a multi-swing-high resistance.
High Risk Investment Warning
Trading Forex/CFDs on margin carries a high level of risk and may not be suitable for all investors. Leverage can work against you.
Stratos Markets Limited (tradu.com ):
CFDs are complex instruments and come with a high risk of losing money rapidly due to leverage. 63% of retail investor accounts lose money when trading CFDs with this provider. You should consider whether you understand how CFDs work and whether you can afford to take the high risk of losing your money.
Stratos Europe Ltd (tradu.com ):
CFDs are complex instruments and come with a high risk of losing money rapidly due to leverage. 63% of retail investor accounts lose money when trading CFDs with this provider. You should consider whether you understand how CFDs work and whether you can afford to take the high risk of losing your money.
Stratos Global LLC (tradu.com ):
Losses can exceed deposits.
Please be advised that the information presented on TradingView is provided to Tradu (‘Company’, ‘we’) by a third-party provider (‘TFA Global Pte Ltd’). Please be reminded that you are solely responsible for the trading decisions on your account. There is a very high degree of risk involved in trading. Any information and/or content is intended entirely for research, educational and informational purposes only and does not constitute investment or consultation advice or investment strategy. The information is not tailored to the investment needs of any specific person and therefore does not involve a consideration of any of the investment objectives, financial situation or needs of any viewer that may receive it. Kindly also note that past performance is not a reliable indicator of future results. Actual results may differ materially from those anticipated in forward-looking or past performance statements. We assume no liability as to the accuracy or completeness of any of the information and/or content provided herein and the Company cannot be held responsible for any omission, mistake nor for any loss or damage including without limitation to any loss of profit which may arise from reliance on any information supplied by TFA Global Pte Ltd.
The speaker(s) is neither an employee, agent nor representative of Tradu and is therefore acting independently. The opinions given are their own, constitute general market commentary, and do not constitute the opinion or advice of Tradu or any form of personal or investment advice. Tradu neither endorses nor guarantees offerings of third-party speakers, nor is Tradu responsible for the content, veracity or opinions of third-party speakers, presenters or participants.

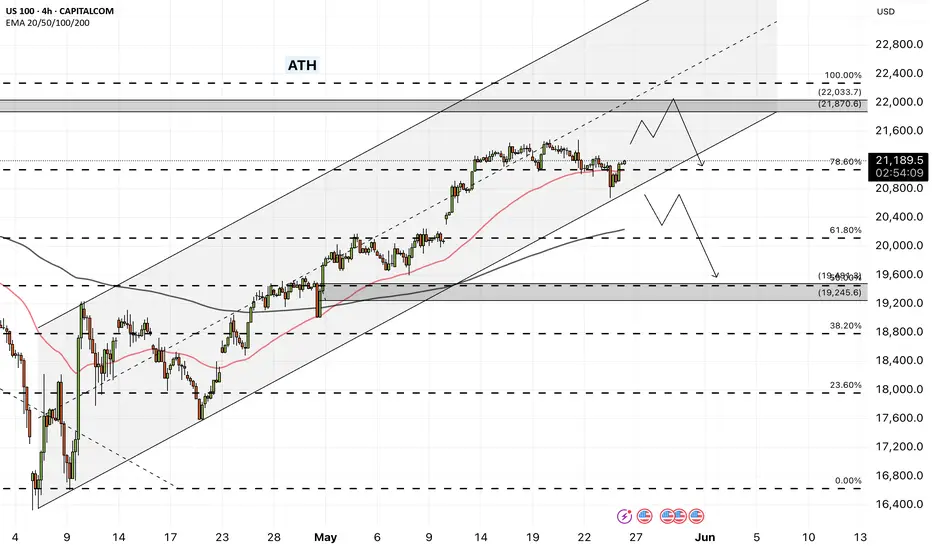
NASDAQ: Needs to reclaim the 4H MA50.Nasdaq is bullish on its 1D technical outlook (RSI = 62.436, MACD = 467.180, ADX = 28.529) as it maintains its long term bullish trend through the Channel Up pattern, which recently is transitioning into a Rising Wedge. We are willing to turn bullish again upon a 4H candle closing over the 4H MA50 and aim for a +11.17% rise (TP = 23,000) on the HH trendline, like the April 21st rebound did.
## If you like our free content follow our profile to get more daily ideas. ##
## Comments and likes are greatly appreciated. ##

NAS100 at Critical Supply Zone – Is a Major Reversal Brewing?The NAS100 (US100) just tapped a key supply zone around 21,250, showing strong signs of overhead resistance. This is the same area that previously triggered sharp rejections – and we’re back there again.
What I'm watching:
Price Action is currently reacting to a visible supply zone (highlighted in blue).
If the market fails to break above 21,250, I expect a potential rejection leading to:
First support zone: 17,064
Second deeper target: 12,588 (strong demand zone highlighted in orange).
Bearish Outlook Triggers:
Daily close below 20,900
Increased sell volume at resistance
Failure to form higher highs
Bullish Invalidator:
Clean breakout and retest above 21,250 with momentum
My Plan:
Watching for short signals near resistance with tight SL above 21,400. TP zones set around 17k and 12.5k if weakness confirms.
Technical Confluence:
Previous highs acting as resistance
Supply & demand zones (LuxAlgo VR)
Bearish divergence forming on RSI (not shown here but visible on lower TFs)
What do you think? Will NAS100 break out or is a deep correction coming?
#US100 #NASDAQ #Indices #PriceAction #SupplyAndDemand #LuxAlgo #TradingStrategy #ReversalSetup #SmartMoney #BearishBias

NASDAQ SELL OPPORTUNITYSo this is not a signal but a lesson. So my main focus is the gap created by the market on the last 2 Mondays. In most cases the market likes closing the gaps that it creates. So here is a little experiment that I am looking at of whether or not the market proves our hypothesis. Not a signal purely a learning experience.

NAS100 TO THE DOWNSIDEAfter tapping into our orderblock the market broke our bullish trend and retested confirming our sells

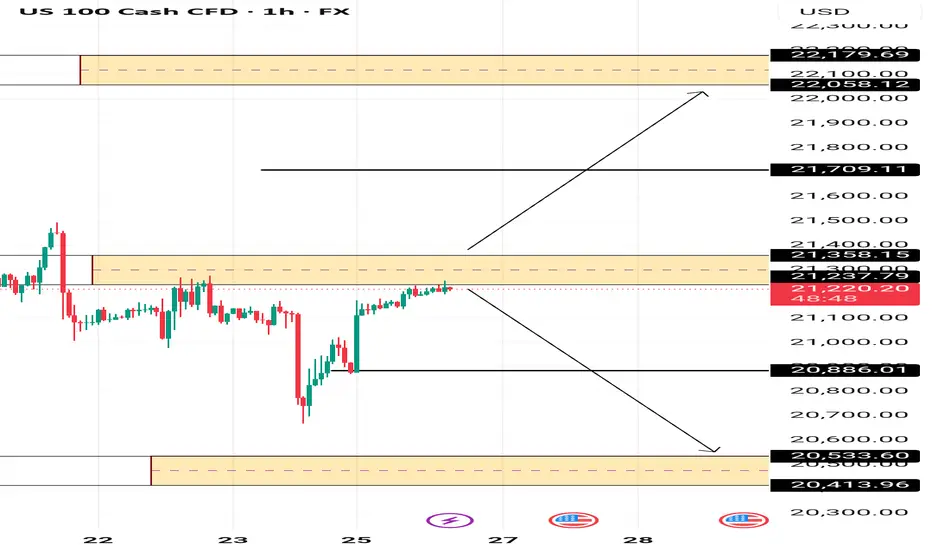
US100 PIVOT AREA The Nasdaq is currently at the pivot area between 21237 and 21385 , if the price remains below this area then 20886 and 20533 could be the next possible targets.
However a break above could trigger bullish momentum targeting 21709 and 22058
NASDAQ US 100 - SHORT IDEAAfter a strong rejection from the top at 21480... the price dropped below our upward trend line, now I expect the price below 21,000
ENTRY ZONE: 21.100 A 21200
TAKE PROFIT 1: 20.650
TAKE PROFIT 2: 20.280
STOP LOSS: 21.350
NAS100 Will Go Down! Sell!
Please, check our technical outlook for NAS100.
Time Frame: 12h
Current Trend: Bearish
Sentiment: Overbought (based on 7-period RSI)
Forecast: Bearish
The price is testing a key resistance 21,208.3.
Taking into consideration the current market trend & overbought RSI, chances will be high to see a bearish movement to the downside at least to 19,875.4 level.
P.S
We determine oversold/overbought condition with RSI indicator.
When it drops below 30 - the market is considered to be oversold.
When it bounces above 70 - the market is considered to be overbought.
Disclosure: I am part of Trade Nation's Influencer program and receive a monthly fee for using their TradingView charts in my analysis.
Like and subscribe and comment my ideas if you enjoy them!

NASS100NASS100 BEARISH REVRSAL IN H4
break the double top
retest the 0.61% fib golden level
on double top there is also bearish divergence
it is the sign for reversal
3 sign for reversal
1 double top
2 break the last HL and formed new LL
3 retest the golden 0.61% fib level

Position for a Short-Term Bounce
- Key Insights: The NASDAQ has entered a historically oversold state, presenting
a high-probability opportunity for a short-term rebound. While bearish
signals persist due to recent momentum shifts, long-term institutional
activity indicates underlying support. Traders should look for defensive
buying near support zones to capitalize on upward moves. Critical levels
must be monitored closely for confirmation.
- Price Targets:
- Next Week Targets:
- T1: 21,000
- T2: 21,479
- Stop Levels:
- S1: 20,426
- S2: 20,250
- Recent Performance: The NASDAQ has faced four consecutive days of declines,
breaking below key technical levels that signal bearish pressures. However,
institutional support and broader bullish indicators remain intact, keeping
the index positioned as the strongest major U.S. equity index in the longer
term. Historically oversold conditions provide optimism for a potential
bounce next week.
- Expert Analysis: Despite short-term bearish momentum, expert outlook continues
to align with NASDAQ’s long-term resilience above major moving averages.
Institutional liquidity flow and ongoing interest in technology continue to
support the index, though caution is warranted around immediate support
barriers to avoid deeper pullbacks. Monitoring liquidity gaps is crucial.
- News Impact: NVIDIA earnings are anticipated to be a pivotal event next week
and could drive volatility in NASDAQ tech sectors depending on the outcome.
Elevated volatility levels, as evidenced by the VIX, further warrant caution
while underscoring potential opportunities for rebound plays. Additionally,
NASDAQ’s move to expand zero-day options trading has drawn mixed responses
but could influence short-term speculative activity in its top tech stocks
like Apple, Microsoft, Amazon, and Alphabet.
NASDAQ 100 Setup After Bearish Pullback. My Bullish Game Plan!🚀 NASDAQ US100 Update – Key Levels I'm Watching 💡📈
Looking at the NAS100 right now, we’ve seen a strong rally kick off after the weekend 📊🔥 — this comes on the back of an aggressive bearish pullback last week 📉.
📌 My bias is bullish, but with a condition: I want to see price retrace into the 10-minute fair value gap and hold above the previous low 🧠🔍.
If we get a clean pullback, followed by a continuation with higher highs and higher lows, I’ll be watching closely for the first bullish break after that next pullback — that’s where I’d look to position long 🐂📈.
🛑 Not financial advice.
👇 Drop a comment if you're watching these levels too!

NASDAQ100 (US100) – Supply Zone Rejection in Play?Fundamental
Despite strong earnings from big tech and resilient economic data, concerns around Fed’s hawkish tone and sticky inflation are resurfacing. Rate cut expectations are being pushed further out, weighing on high-growth sectors like tech.
Technical
The index is testing a key supply zone between 21,380–21,420, aligned with previous highs and fib levels (0.618–0.786). Volume is thinning above, and momentum (Stoch RSI) shows early signs of bearish divergence.
Trade Setup (Short-biased)
- Entry: If price rejects the 21,380–21,420 zone. Before entering, make sure you see bearish pressure first. Like strong red candle on 1h, 2h time frame.
- First Take Profit 1: 20,600
- Second Take Profit 2: 20,000
Follow me for updates on entry confirmation, scaling strategies, and live adjustments.
Thank you

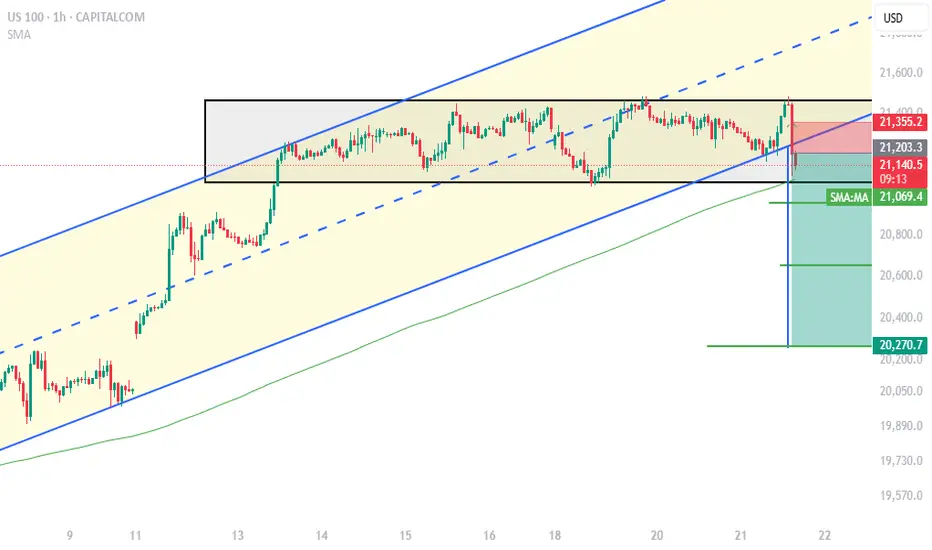
NAS100 - Will the stock market go down?!The index is above the EMA200 and EMA50 on the four-hour timeframe and is trading in its ascending channel. If the ascending channel breaks, expect corrective moves, and if this channel line is maintained, its upward path will be available to the next supply range.
In that range, we can also sell Nasdaq with appropriate risk-reward.
With Donald Trump announcing a 50% tariff on imports from the European Union, trade tensions have once again taken center stage in global economic news, temporarily drawing attention away from more structural issues. However, these new developments have not diminished deeper concerns about the U.S. debt crisis and the federal government’s fiscal policies. Last week, the release of details regarding a new budget bill in Congress—coupled with Moody’s downgrade of the U.S. credit rating—sparked renewed anxiety in the markets about America’s fiscal stability. These concerns have now taken on more complexity amid the intensifying trade conflict.
The bill, which narrowly passed through the House of Representatives, could potentially add up to $4 trillion to the federal debt. This projection triggered a sharp reaction in the U.S. Treasury market, causing long-term bond yields to rise significantly.
Trump’s threat to impose tariffs on European goods—specifically naming iPhones—negatively impacted market sentiment in U.S. equities. Past trade confrontations with China suggest that Trump typically avoids actions that significantly harm the stock market and tends to retreat from hardline positions. Thus, buying the dip might be a sound strategy, though accurately timing entry is crucial.
Pinpointing the right entry time remains difficult, and perhaps the most reliable signal would come directly from Trump himself. With the July 9 deadline for the tariffs approaching and no formal trade agreement in place, the best course for market participants is to remain cautious and watch for any signs of a policy reversal.
Despite persistent worries over budget deficits and rising Treasury yields, Morgan Stanley remains bullish on the outlook for U.S. equities and bonds.
Morgan Stanley projects the following:
• The S&P 500 is expected to reach 6,500 by mid-2026, representing a roughly 10% gain from current levels. Key drivers of this growth include lower interest rates, a weaker dollar, and productivity gains fueled by artificial intelligence.
• The recent spike in the 10-year Treasury yield is considered temporary, with expectations that it will decline to around 3.45% by mid-2026. There is still no strong evidence of a significant outflow of foreign capital from U.S. markets.
Although the upcoming week will be shortened due to the Memorial Day holiday on Monday, a packed economic calendar starting Tuesday is expected to quickly reenergize market activity.
Tuesday will bring the release of durable goods orders for April and the consumer confidence index for May—two data points that could provide clearer insight into domestic demand and household spending trends. On Wednesday afternoon, attention will turn to the minutes from the May FOMC meeting, where investors will search for clues about potential shifts in the Federal Reserve’s tone regarding future rate cuts.
Thursday will be loaded with key economic indicators: weekly jobless claims, the first estimate of Q1 GDP, and existing home sales data. The week will conclude on Friday with the release of the Core PCE Price Index, the Fed’s preferred measure of inflation, which plays a pivotal role in shaping its monetary policy decisions.
Meanwhile, Nvidia is preparing to launch its new AI chip, Blackwell, in the Chinese market at a more affordable price. Based on the Blackwell architecture, the chip will be priced between $6,500 and $8,000—lower than the H20 model, which costs between $10,000 and $12,000.
This price reduction results from simpler technical specifications and a lower-cost manufacturing process. The new chip uses GDDR7 memory instead of high-bandwidth memory and lacks the advanced CoWoS packaging technology.
THIS WEEK'S NASDAQ HIGH PROBABILITY SWING TRADENASDAQ Trade Idea: Long Bias
Timeframe:
4HR | Daily (Confluence-based entry and targets)
Market Context:
Price is currently trading in discount, presenting a high-probability long setup based on the unfolding buy model.
We’ve identified a 4HR Buy-Side Imbalance / Sell-Side Inefficiency (BISI) zone acting as a magnet for price, suggesting potential accumulation and displacement to the upside.
Entry Zone:
Buy Zone:
🟢 21,070 – 21,050
This is inside the 4HR BISI, aligned with the buy model's accumulation phase and in optimal trade entry conditions (OTE) relative to the discount of the current dealing range.
Targets (Liquidity + Imbalance Fills):
TP1: 21,490
→ Equal highs + short-term liquidity sweep in premium.
TP2: 21,875
→ Partial fill of the Daily Sell-Side Imbalance / Buy-Side Inefficiency (SIBI).
TP3: 22,240
→ Full mitigation of the Daily BISI zone + extended liquidity run.
Risk Management:
Stop Loss (SL): Below 21,000 (structure invalidation & imbalance invalidation).
RRR: Minimum 1:3 to TP1, higher to subsequent levels.
Use partials on each target to secure profits and manage drawdown.
Confluences:
Price is in discount territory of current dealing range.
Entry aligns with 4HR BISI + internal liquidity engineering.
Upside targets align with equal highs, Daily inefficiencies, and liquidity pools in premium.
Trade Management Tips:
Watch for a bullish market structure shift on 15min–1HR to confirm.
Enter on a fair value gap (FVG) or mitigation of last down candle inside the 21,070–21,050 zone.
Be aware of macroeconomic news that may affect volatility near your entry/TP zones.

Nasdaq trading insights: 26-May-2025Nasdaq trading insights: Not signals, but informative zones to aid your decision-making. Please note: These zones are not trading advice. Use them as a starting point for your own analysis.

$NDX And The Expanding WedgeNASDAQ:NDX has a lot going for it and plenty of lifechanging money to be made.
As you can see whether you draw a bear flag that is still valid or a large Triangle (also valid) there is an amazing opportunity for profit.
Firth thing to notice other than this triangle is the weakness creeping in at the retest of weekly resistance above. MA angles are starting to cross down and a clear indication of a false breakout is signaling on the CCI.
Keeping in mind that not only on the Futures charts but also on the indexes we have quite a few long distance gaps left open, most notable at 18,300.
Whichever way this triangle breaks, the move will be massive.
Hang on to your butts..

Trend Line Breakout – USNAS100The USNAS100 has shown signs of bearish momentum following a decisive break below a key trend line. This breakdown suggests increased selling pressure, potentially leading to lower price levels. Technical indicators support the bearish bias, with momentum shifting in favuor of the bears. The first target at 20,898 represents an initial support zone, while the second target at 20,270 could be reached if downside pressure intensifies. Traders should monitor volume and price action for continued confirmation and use appropriate risk management strategies, including stop-loss placement above the trend line, to protect against reversal scenarios.
Entry: 21,170
1st Target Point: 20,898
2nd Target Point: 20,270

Monday Bounce from 4H Demand ZoneAfter taking a controlled loss on Friday, I came into Monday focused and clear-minded. Price tapped into a clean 4H demand zone and printed a strong bullish engulfing candle — a textbook rejection from imbalance. I waited for the 4H candle close before entering long.
Risk was tight below the demand zone, with a clear target above — offering a high RR setup. This trade wasn’t about the day of the week; it was about respecting structure, imbalance, and confirmation.
Timeframe: 4H
Setup: Bullish engulfing off 4H demand zone + imbalance fill
Entry: After 4H candle close
Stop Loss: Below demand wick
Take Profit: Major clean high above imbalance
Risk-to-Reward: Over 3R
This is why I trade the 4H. One clean move. No stress. No noise. Just structure + patience.
– THE 4H TRADER

NASDAQ 100 Decade Anchored VWAPDecade Anchored VWAP has been the most recent top. Will we break above and push for a new all time high?

NAS100 (BOS 1H + SUPPLY + OTE)Hello traders!
Now reaction from 705 fib level, Supply = OB 4H. But we can expect mitigation supply and confirmation on LTF. We have BOS on 1H.
Target: till 0.5 global fib level.
P.S: We have also on top OB 2H + OTE
Have a profitable day and don't forget to subscribe for more updates!
If you like this idea drop a like, leave a comment.

Genius or Just Guessing? NAS100 Setup Has It AllNAS100 has broken its uptrend but still feels bullish overall. The plan? A tactical short on the pullback and a long if it reclaims strength. If both play out, it’s a multi-legged win. If not, it’s a lesson in humility. Here’s how we’re threading the needle with a high-risk/high-reward setup.
