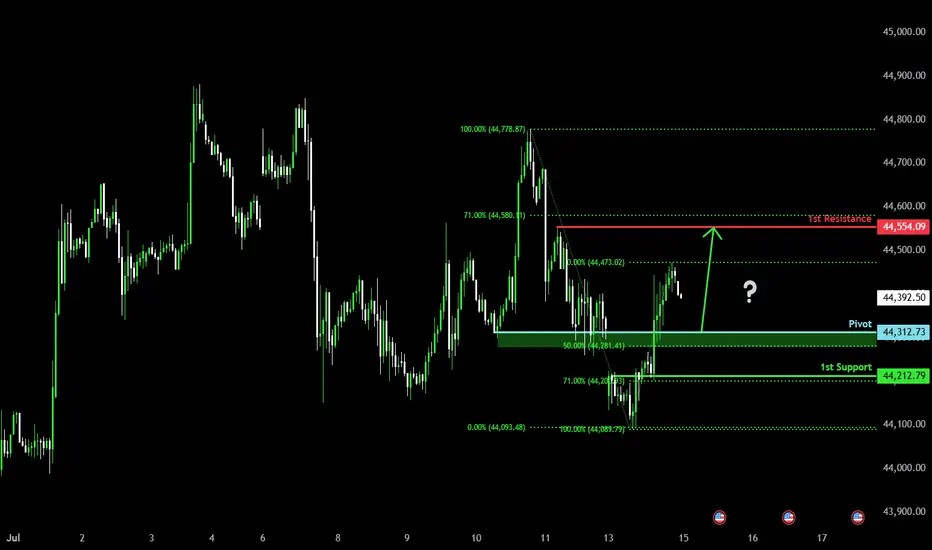
Bullish bounce off pullback resistance?Dow Jones (US30) is falling towards the pivot and could bounce to the 1st resistance.
Pivot: 44,312.73
1st Support: 44,212.79
1st Resistance: 44,554.09
Risk Warning:
Trading Forex and CFDs carries a high level of risk to your capital and you should only trade with money you can afford to lose. Trading Forex and CFDs may not be suitable for all investors, so please ensure that you fully understand the risks involved and seek independent advice if necessary.
Disclaimer:
The above opinions given constitute general market commentary, and do not constitute the opinion or advice of IC Markets or any form of personal or investment advice.
Any opinions, news, research, analyses, prices, other information, or links to third-party sites contained on this website are provided on an "as-is" basis, are intended only to be informative, is not an advice nor a recommendation, nor research, or a record of our trading prices, or an offer of, or solicitation for a transaction in any financial instrument and thus should not be treated as such. The information provided does not involve any specific investment objectives, financial situation and needs of any specific person who may receive it. Please be aware, that past performance is not a reliable indicator of future performance and/or results. Past Performance or Forward-looking scenarios based upon the reasonable beliefs of the third-party provider are not a guarantee of future performance. Actual results may differ materially from those anticipated in forward-looking or past performance statements. IC Markets makes no representation or warranty and assumes no liability as to the accuracy or completeness of the information provided, nor any loss arising from any investment based on a recommendation, forecast or any information supplied by any third-party.
WALLSTREETCFD trade ideas
US30 Local Short!
HI,Traders !
US30 index is moving in a sideways
movement Over the medium term down
Again and will soon hit
A horizontal support
Of 44482.4 from where
We will be expecting a
Local bullish rebound !
Comment and subscribe to help us grow !

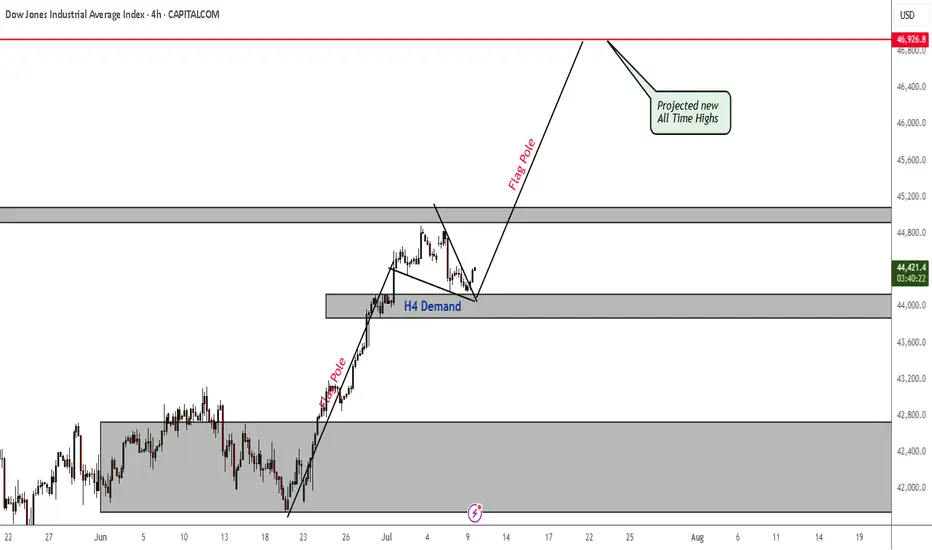
US30 Projected All Time Highs As Bullish Trend ResumesPrice is currently being supported by an H4 demand zone. If this demand zone continues to hold and apply pressure to the upside, we will soon be seeing new all time highs. Which really should not surprise us because as we all know, indices are generally bullish long term.
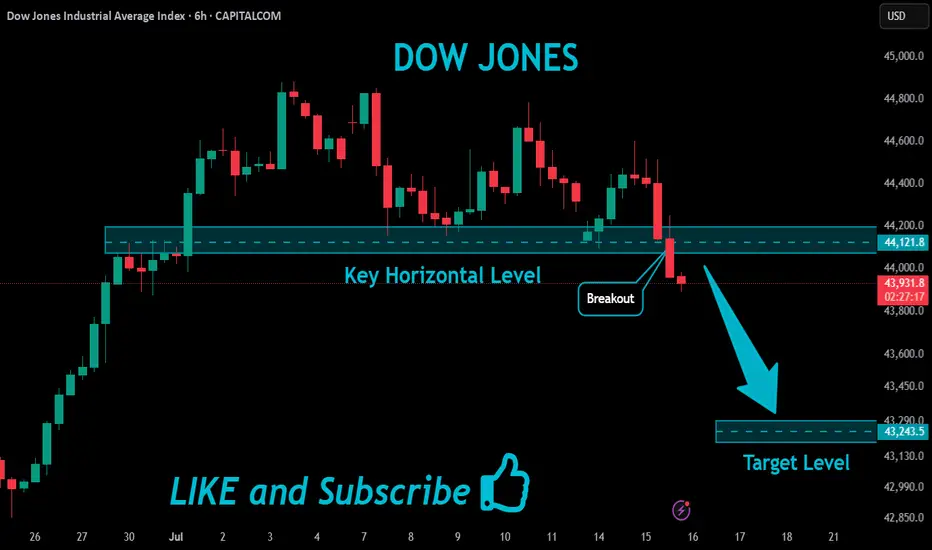
US30 Bearish Breakout!
HI,Traders !
#US30 index is trading in a strong downtrend,
and has broken through the key horizontal
level at 44121.8, reinforcing our bearish
outlook. We expect further declines !
Comment and subscribe to help us grow !
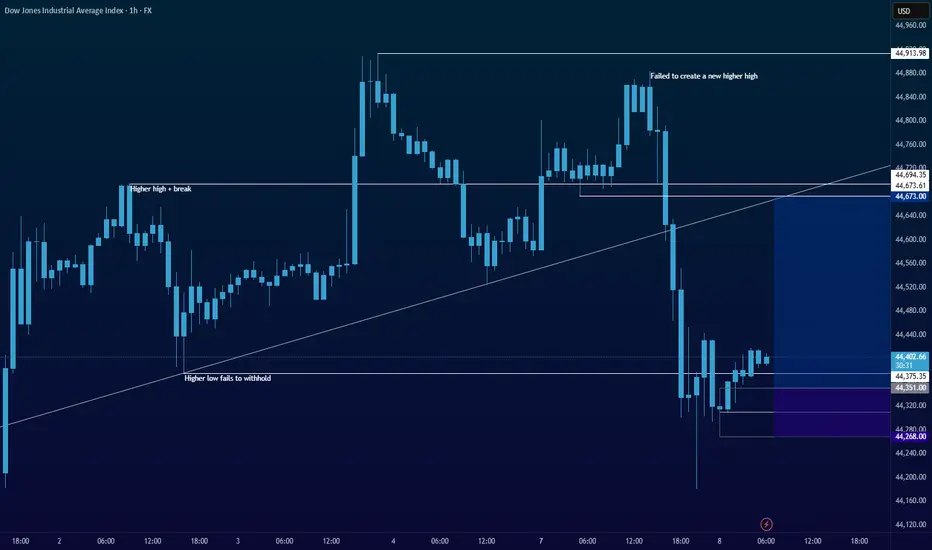
Shakeout On The WayUnlike the SPX, the DJI didn't make a higher-high. Why is this? I think partially because it's price weighted as opposed to market cap weighted like the Nasdaq or SPX. The other part would be CPI numbers.
So what's next for the DJI? I see hidden bullish divs long term and hidden bearish divs short term, this a common shake out tactic I see to liquidate longs and shorts. I'll be looking to load up on the trade at the bottom of the channel and play the range as it develops.
As always: stay calm, don't panic, and don't forget you can always use a stop loss
The fear and green index is at 74, when people are greedy be fearful.

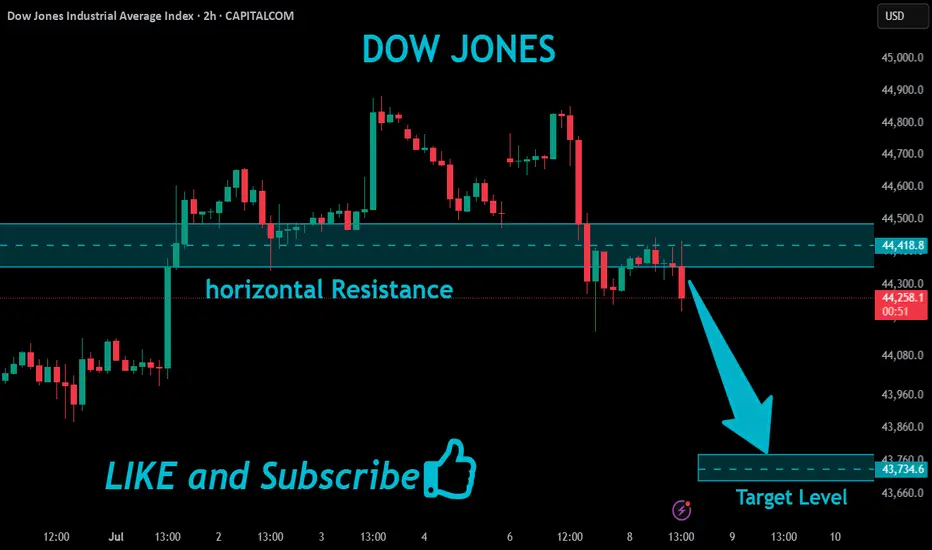
US30 Will Fall!
HI,Traders !
US30 made a retest
Of the key horizontal
Resistance level of 44418.8
From where we are
Already seeing a bearish
Reaction and we will
Be expecting a
Further bearish move down !
Comment and subscribe to help us grow !
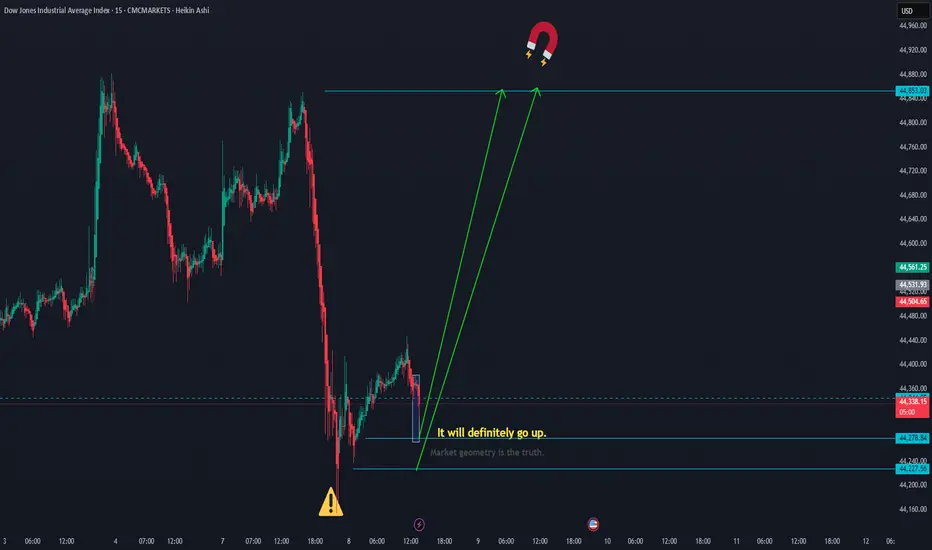
The dowjones should move upThe Dow Jones should move up to 44,853.
The levels 44,278.84 and 44,227.56 are good potential points for a bullish reversal. CMCMARKETS:US30
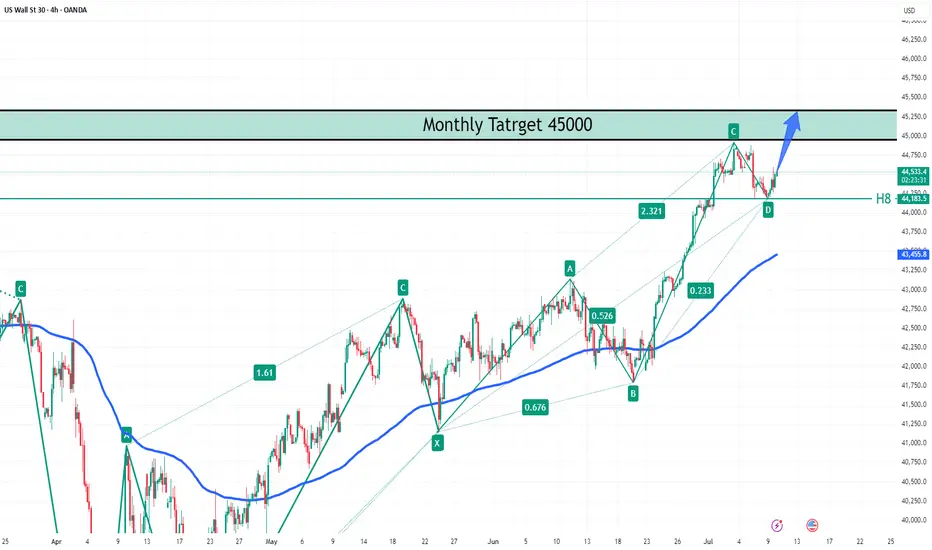
Dow Jones (US30): Recovery in Motion — Target at 45,000Market Overview:
The Dow Jones index holds above the support zone at 44,183 after a local correction. The broader trend remains bullish, with the primary target set near the monthly resistance zone at 45,000.
Technical Signals & Formations:
— Completed ABCD pattern
— Support confirmed at H8 level (44,183)
— EMA acting as dynamic support
— Upside potential toward channel resistance
Key Levels:
Support: 44,183, 43,455
Resistance/Target: 45,000
Scenario:
Primary: If Dow Jones remains above 44,183, continuation toward 45,000 is likely.
Alternative: A break below 44,183 could trigger a deeper correction toward 43,455.

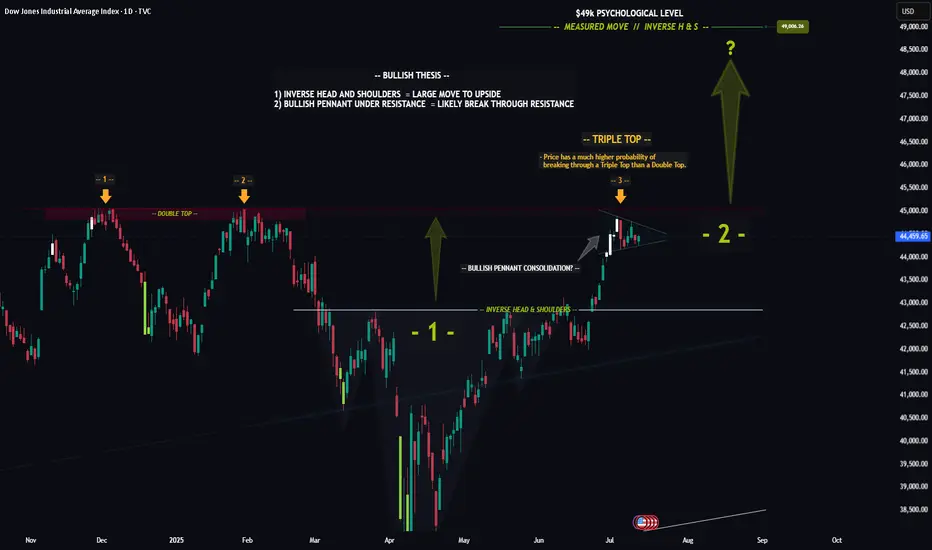
DOW (DJI) -- Preparing For The Next Big Move?Hello Traders!
The chart of the DOW is really quite incredible... Recently price formed a textbook Inverse Head & Shoulders pattern, which led to a nice nearly to the all time high. Furthermore price looks to be consolidating in a Bullish Pennant just below the all time high resistance level.
The reason the Pennant below resistance is so significant is because this signals that investors are likely preparing to drive price higher to new highs. Think about it like a fighter resting before the next big fight.
Triple Top: In addition to the pennant price has now hit this resistance level for the 3rd time. The more times price hits a level typically the weaker it gets. After the 3rd hit the chance of a breakout increases dramatically.
In Summary: The "Triple Top" in conjunction with the "Bullish Pennant" means that there is undoubtedly a very high probability that price will breakout and make new all time highs.
This post is primarily meant to be educational vs a trade idea. Its charts like this that invigorate my technical analysis side and I hope it does for you as well.
Best of luck on your trading journey!
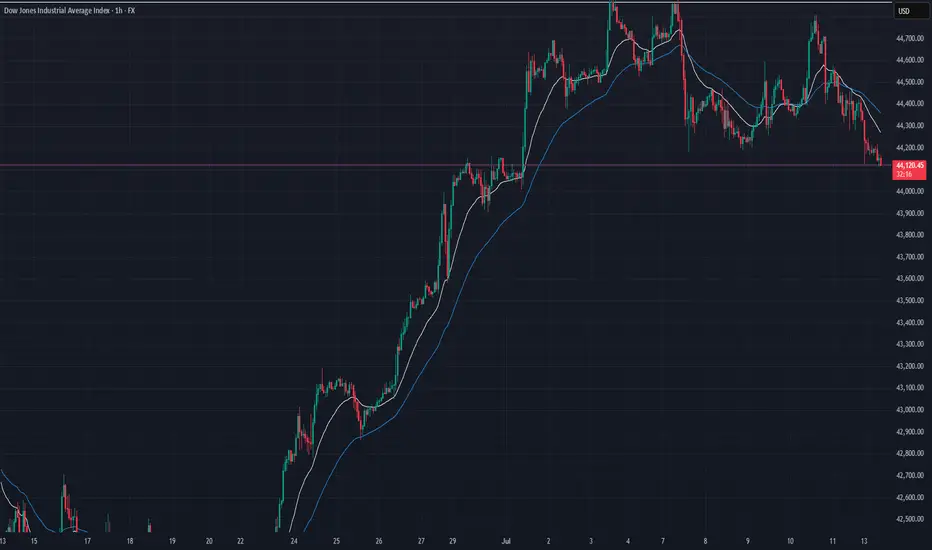
US30 Market Recap – 07/14/2025📍 US30 Market Recap – 07/14/2025
We’ve officially broken down out of the consolidation range between 44,220–44,867 📉
The structure is now shifting bearish, with price printing a series of lower highs and lower lows, and EMAs flipping to the downside. Sellers are in control heading into the week.
📊 Current Structure:
Bearish market shift confirmed below 44,220
EMAs (20 & 50) now angled downward and acting as dynamic resistance
Trendline support from June rally is broken
Last bounce attempt from 44,260 was weak and quickly faded
🔑 Key Levels:
🔽 Support: 43,800 → 43,600 → 43,300
🔼 Resistance: 44,220 → 44,400 zone
🧭 Pivot zone: Watch 44,000 psychological level for reactions
💡 Trade Setup Ideas:
🔻 Short Setup (Trend Continuation):
Entry: Retest + rejection near 44,220 or descending EMAs
TP1: 43,800
TP2: 43,600
SL: Above 44,300
⚠️ Avoid longing unless we reclaim and hold above 44,400 with strong momentum.
correctionIt is expected to fluctuate within the current support level and then continue the upward trend.
If the index breaks through the green support level, the correction to the next support level is possible.
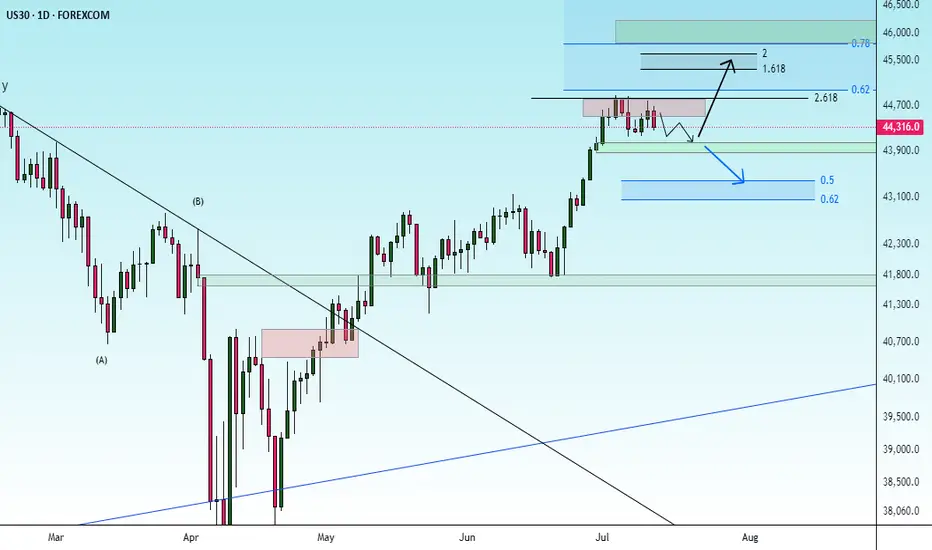
US30 short bias- 9th July 2025
I have conducted a comprehensive multi-timeframe analysis of the US30 index, with particular focus on its recent price action and structural context.
Quarterly Timeframe:
On the three-month timeframe, the second quarter’s candle close is notably bullish, having engulfed the previous ten quarterly candles. This significant engulfing pattern suggests strong underlying momentum. Importantly, there has not yet been a body closure above this quarterly candle, which indicates that price may attempt to break above its range to establish new all-time highs.
Recently, price action reached an all-time high near a major psychological level of 45,000 before retracing sharply to a liquidity region around 37,500. Since this retracement, there has been substantial accumulation of bullish orders, reinforcing the potential for price to retest and surpass prior highs.
Monthly Timeframe:
On the monthly timeframe, price has approached a key liquidity region around 44,500, where it is currently encountering resistance. While the higher timeframe bias remains firmly bullish, it is reasonable to expect healthy retracements before new all-time highs are made. It is worth noting that price has already broken above significant monthly levels at 41,750 and 42,600.
A retracement to these regions to collect further liquidity remains plausible, although this scenario is speculative rather than confirmed at present. Consequently, my bias on the monthly timeframe remains neutral in the short term, pending further developments.
Weekly Timeframe:
Price action on the weekly timeframe mirrors that of the monthly. There is little of note beyond the observation that price absorbed considerable bullish orders at 41,750 and has since encountered resistance near 44,750, leading to a modest retracement. Given this structure, I maintain a neutral outlook on the weekly timeframe.
Daily Timeframe:
On the daily chart, we can observe that the bullish momentum initiated from the 43,000 order block region faced resistance at approximately 44,500. Price briefly broke above this region on Thursday, 3rd July, but quickly closed below it on Monday, indicating a lack of sustained buying interest to propel price higher.
This retracement suggests that the market is searching for a deeper liquidity area to support its next upward move. Notably, a bearish three-pin formation is present, implying that price may break below the recent lows around 44,150. Accordingly, my bias for today is bearish.
4-Hour Timeframe:
In alignment with the daily bias, the 4-hour timeframe indicates that price is likely to target Monday’s low at approximately 44,155. The next key liquidity region lies around 44,000, where substantial bullish orders were previously filled. I am currently waiting for price to offer a suitable entry region to sell towards 44,000.
I am also mindful that the FOMC minutes are scheduled for release today, which could introduce significant volatility. Should a valid setup emerge, I will look to enter a short position. Specifically, if the current 4-hour candle closes bearish, I intend to consider shorts from around 44,220.
---
Disclaimer:
This analysis is for educational purposes only and does not constitute financial advice. Always conduct your own research and manage risk accordingly.

USA30 updateHi traders i would love to share few updates of set up I've shared n also few tips,I want to tell you that,is easy to become profitable but you need to work on risking management n for a very long period of time,once you understand risking management to be profitable is not a problem anymore but if you are in hurry to get rich n use big levarage it also need classes continuasl n learn how house that big levarage for short period of time,soo what am trying to say here is that you choose how long you wanna stay in.the trade n profit you wish to get,you can last longer or liquidated faster,you don't control the market but predictions byte that you can see directions but you need to calculate the risks in order to reach your destination i hope someone will find solutions on their unnecessary looses be wise.

US30: Move Up Expected! Long!
My dear friends,
Today we will analyse US30 together☺️
The in-trend continuation seems likely as the current long-term trend appears to be strong, and price is holding above a key level of 44,393.91 So a bullish continuation seems plausible, targeting the next high. We should enter on confirmation, and place a stop-loss beyond the recent swing level.
❤️Sending you lots of Love and Hugs❤️

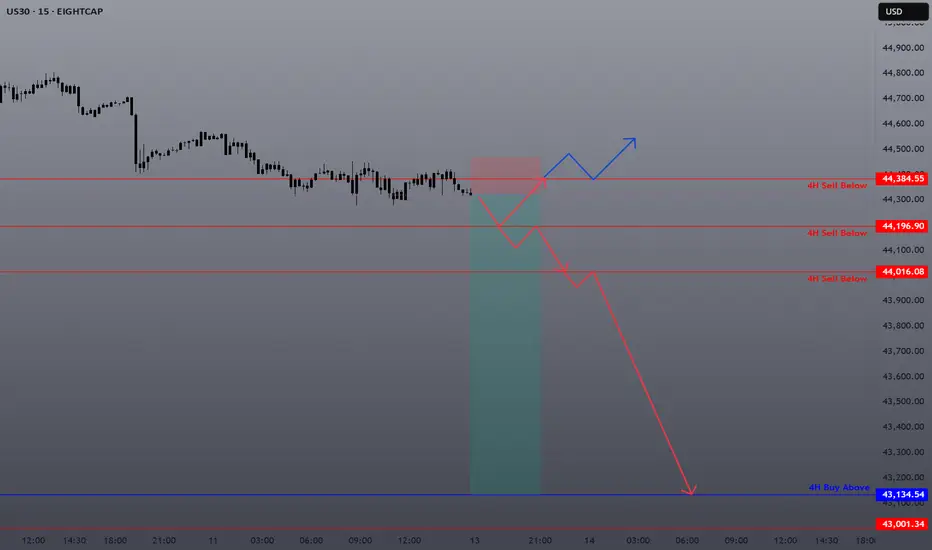
US30 Sell continuationUS 30 appears to be running SSL. 4H levels identified. Looking for Break & retest. If support does not hold on to any level, expect the bulls to return and take over.
US30: The bullish trend remains in progressUS30: The bullish trend remains in progress
On April 7, 2025, US30 hit its lowest point at approximately 36500. Since then, despite significant concerns regarding Trump's tariffs and the ongoing turmoil in the Middle East, all indices have been on the rise.
Overall the U.S. indicators are showing robust performance.
In a worst-case scenario, we might observe US30 to make a minor correction close to 42500 before it bounces further, potentially retesting the chart level that aligns with its all-time high price as well.
Key target levels: 44000 and 44970
You may find more details in the chart!
Thank you and Good Luck!
❤️PS: Please support with a like or comment if you find this analysis useful for your trading day❤️

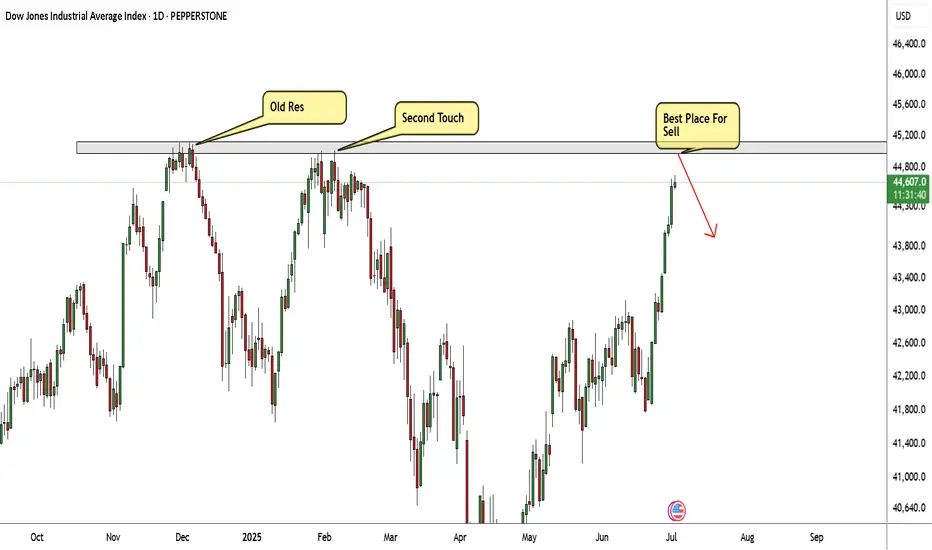
US30 Very Near Strong Res Area , Short Setup To Get 500 Pips !Here is my US30 Daily Chart , the price very near the highest price area , this res area forced the price to go down very hard 2 times so i think this time will be the biggest movement to downside , so i`m waiting the price to touch it and give me a good bearish price action and then we can enter a sell trade and targeting at least 500 pips . if we have a daily closure above then this idea will not be valid .
Dow Jones Potential UpsidesHey Traders, in tomorrow's trading session we are monitoring US30 for a buying opportunity around 44,400 zone, Dow Jones is trading in an uptrend and currently is in a correction phase in which it is approaching the trend 44,400 support and resistance area.
Trade safe, Joe.
DOW Jones go upCMCMARKETS:US30
Reaching the price level of 45,082.74 is inevitable. From the current closing price, there is a high probability of continuation toward the ATH.
However, the price levels 44,440 and 44,344.95 are also acceptable zones from which the move toward 45,082.74 may begin.
At the start of the upcoming week, as soon as the market opens, we are likely to move toward the ATH from one of these three levels.

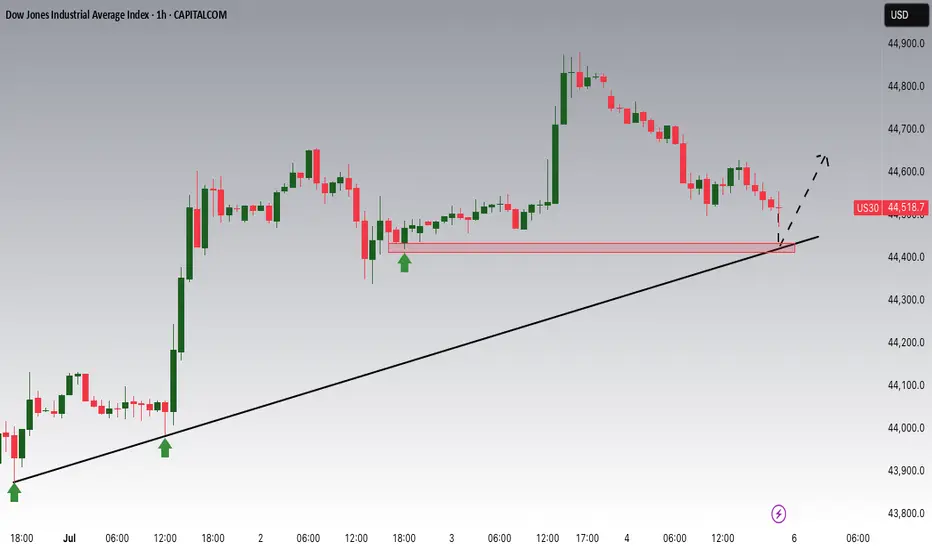
First obvious major clue may be stronger than the second.I think this shows a clear direction in price action. Strong moves addition to bullish trend line and internal structure. Now at the moment, I am looking at the trend line as a major attraction point in the current moment. Some opinions may say that it's more correct to sell down lower from the trend line, and that might be correct. Although, at this moment, price has yet to have a proper pullback after a clean breakout below. It might honestly just be too obvious that it'd go down lower after retesting trend line, so in my opinion, I think the most clear entry right now is to buy now at a low point, might as well be called a liquidity pool. So right now in this strong trend change, the next obvious major potential for move is going to be back at trend line. The next obvious move will be even more obvious, so then it might also be lacking stability, but until then, my focus here is to buy within a potential deep pullback.
Upward trend Given the behavior of the index within the current resistance range, possible scenarios have been identified. It is expected that a trend change will take place and we will witness the beginning of a correction. With consolidation above the resistance range, the continuation of the upward trend will be likely.

US30: Market in Rally Mode – Prepare for the Next OpportunityWelcome back! Let me know your thoughts in the comments!
** US30 Analysis !
We recommend that you keep this pair on your watchlist and enter when the entry criteria of your strategy is met.
Please support this idea with a LIKE and COMMENT if you find it useful and Click "Follow" on our profile if you'd like these trade ideas delivered straight to your email in the future.
Thanks for your continued support! Welcome back! Let me know your thoughts in the comments!
