US30 // There is a strong resistance point at 44.967 level. In case you consider short trading at the level I mentioned, our take profit point is 8 ema.
WALLSTREETCFD trade ideas

US30 – Bullish Breakout Retest Play (1H + 15M Confluence)US30 – Bullish Breakout Retest Play (1H + 15M Confluence)
Price has broken out of descending channel and is now retesting the 44,671–723 zone. 1H chart confirms bullish momentum within a broader uptrend. Watching for clean retest → continuation move towards 44,850+. Checklist Score: ✅ 9/10.
#US30 #DowJones #TCBstrategy #BreakoutRetest #SmartMoney #PriceAction
📌 Journal Summary Entry:
US30 Compression Play – July 7
Watching 44,723.1 key supply zone for decision. Price consolidating under zone with descending trendline. Two options: (1) Short on rejection with 2R+ to 44,512.3 demand or (2) Long breakout above 44,723 with target at 44,850–900 zone. Scored 8/10 on TCB checklist. Awaiting confirmation candle during NY session.

US30 Technical Outlook – 07/07/2025📍 US30 Technical Outlook – 07/07/2025
The bulls are holding it down 💪
We’re pushing back near the top of the range — New high at 45,018 tapped!
Price is comfortably riding above both EMAs (20 & 50), showing strong trend continuation 🚀
🧠 Key Observations:
Clear breakout from previous consolidation (44,700 zone)
New higher high → momentum remains intact
EMAs continue to act as dynamic support (especially 44,688 area)
📊 Key Price Zones:
🔼 Resistance: 45,018 → Next psychological level: 45,200
🔽 Support: 44,688 → 44,500 → 44,250
📈 Trade Setup Ideas:
🔹 Long Setup (Primary Play):
Pullback entries near 44,688 EMA zone
Confirmation: Bullish engulfing or bounce on 15min/1H
Targets: 45,000 → 45,200
SL: Below 44,500
🔻 Short Setup (Cautious/Counter):
Only if strong rejection from 45,018 with breakdown back below 44,700
Target: 44,500 → 44,250
Lower TF confirmation required

Dow Jones H4 | Bullish uptrend to extend higher?The Dow Jones 30 (US30) could fall towards a swing-low support and could potentially bounce off this level to climb higher.
Buy entry is at 44,437.85 which is a swing-low support.
Stop loss is at 43,850.00 which is a level that lies underneath a swing-low support and the 23.6% Fibonacci retracement.
Take profit is at 45,046.46 which is a multi-swing-high resistance.
High Risk Investment Warning
Trading Forex/CFDs on margin carries a high level of risk and may not be suitable for all investors. Leverage can work against you.
Stratos Markets Limited (tradu.com ):
CFDs are complex instruments and come with a high risk of losing money rapidly due to leverage. 63% of retail investor accounts lose money when trading CFDs with this provider. You should consider whether you understand how CFDs work and whether you can afford to take the high risk of losing your money.
Stratos Europe Ltd (tradu.com ):
CFDs are complex instruments and come with a high risk of losing money rapidly due to leverage. 63% of retail investor accounts lose money when trading CFDs with this provider. You should consider whether you understand how CFDs work and whether you can afford to take the high risk of losing your money.
Stratos Global LLC (tradu.com ):
Losses can exceed deposits.
Please be advised that the information presented on TradingView is provided to Tradu (‘Company’, ‘we’) by a third-party provider (‘TFA Global Pte Ltd’). Please be reminded that you are solely responsible for the trading decisions on your account. There is a very high degree of risk involved in trading. Any information and/or content is intended entirely for research, educational and informational purposes only and does not constitute investment or consultation advice or investment strategy. The information is not tailored to the investment needs of any specific person and therefore does not involve a consideration of any of the investment objectives, financial situation or needs of any viewer that may receive it. Kindly also note that past performance is not a reliable indicator of future results. Actual results may differ materially from those anticipated in forward-looking or past performance statements. We assume no liability as to the accuracy or completeness of any of the information and/or content provided herein and the Company cannot be held responsible for any omission, mistake nor for any loss or damage including without limitation to any loss of profit which may arise from reliance on any information supplied by TFA Global Pte Ltd.
The speaker(s) is neither an employee, agent nor representative of Tradu and is therefore acting independently. The opinions given are their own, constitute general market commentary, and do not constitute the opinion or advice of Tradu or any form of personal or investment advice. Tradu neither endorses nor guarantees offerings of third-party speakers, nor is Tradu responsible for the content, veracity or opinions of third-party speakers, presenters or participants.


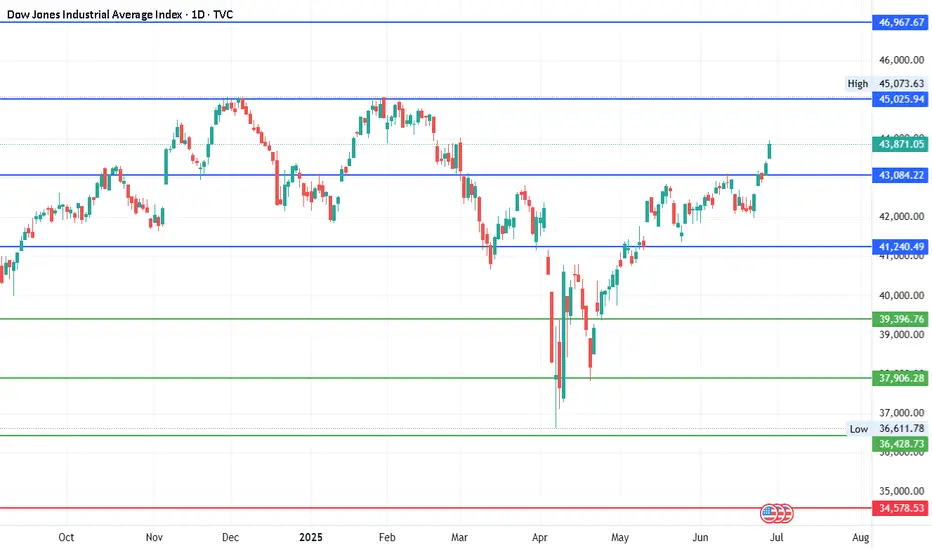
#DJI - 5000 Pts already moved out of 8000 points..Date: 27-06-2025
#DJI - 5000 Pts already moved out of 8000 points as posted on 22nd April. Another 3000 points to cover. we have different pivot for the next level up and it will be shared soon.
Old levels are as follows.
#DJI Upside Targets: 41240.49, 43084.22, 45025.94 and 46967.67
#DJI Downside Targets: 34578.53, 32728.34, 30786.61 and 28844.88
Current price is around 43,870 at the time of this post.

US30 (DOW JONES) 4H – Bullish Breakout BUY Setup
US30 (Dow Jones Industrial Average) is pushing higher, breaking through previous resistance levels. Price is now trading at 44,586.48, confirming strong bullish momentum after reclaiming the 44,000 psychological zone.
We remain bullish — looking for continuation of this breakout.
---
BUY Trade Setup:
🔵 Buy Limit: 44,500.00 – 44,520.00
🛑 Stop Loss: 44,400.00
🎯 Take Profit 1: 44,750.00
🎯 Take Profit 2: 45,000.00
---
Why Buy?
✅ Clear bullish market structure.
✅ Price consolidating after breakout — healthy sign for continuation.
✅ Smart Money likely accumulating for next leg up.
We ride with momentum — no reason to fight the trend.
---
Summary:
Bias: BUY ONLY 🔥
Setup: Wait for price to retest 44,500 – 44,520 zone, look for rejection, then enter.
Risk Management: Respect SL — trade with discipline.
---
💬 Are you buying US30 too? Let me know your setup below!
#US30 #DowJones #Indices #TradingView #BuySetup #SmartMoney #FrankFx14


US30 Technical Outlook – 07/03/2025📍 US30 Technical Outlook – 07/03/2025
Another day of consolidation at the highs 💼⏳
Price is holding firmly above both EMAs (20 & 50), showing sustained bullish structure—but struggling to break cleanly above 44,700–44,760 🧱
🧠 Key Observations:
Tight consolidation between 44,500 → 44,700
Strong bounce off EMA zones (44,500 area acting as dynamic support)
Still no confirmed breakout of the 44,760 top range
📊 Key Price Zones:
🔼 Resistance: 44,708 → 44,762 → 45,000
🔽 Support: 44,500 → 44,250 → 44,000
📈 Trade Setup Ideas:
🔹 Long Setup (Base case):
Buy pullbacks to 44,500 or EMA zone (20 & 50 EMA support)
Look for a breakout and retest of 44,760 for confirmation
Target: 45,000 psychological zone
🔻 Short Setup (Only on breakout failure):
Look for rejection wicks or bearish engulfing at 44,760
Scalp back toward 44,500 or lower
Only valid if volume drops off or price starts forming LHs/LLs on lower TFs


US30 Technical Outlook – 07/02/2025📍 US30 Technical Outlook – 07/02/2025
The bull train keeps rolling! 🚂 Price smashed through the 44,250 resistance level and is now testing the next major zone at 44,700 → 44,760 🔥
🧠 Key Observations:
Price has extended way above the EMAs ✅
EMAs (44,266 and 44,496) still pointing sharply upward ✅
Market consolidating right under 44,760 resistance 📍
📊 Key Price Zones:
🔼 Resistance: 44,700 → 44,760 → 45,000
🔽 Support: 44,500 → 44,250 → 44,000
📈 Trade Setup Ideas:
🔹 Long Bias (Still favored trend-side):
Wait for pullbacks toward 44,500 → 44,250
Buy dips with bullish confirmation patterns (engulfing, pin bars, EMA support hold) ✅
Target: 44,760 → 45,000
🔻 Short Bias (Countertrend – Only on rejection!):
Watch for rejection wicks or bearish reversal setups from 44,700–44,760
Could target quick flush down to 44,500 → 44,250 support
⚠️ Important: Price has been parabolic, so chasing here is dangerous. Wait for clear setups, either dip buys or high-timeframe rejection.


Dow Jones Wave Analysis – 1 July 2025
- Dow Jones broke the resistance zone
- Likely to rise to resistance level 45000.00
Dow Jones index recently broke the resistance zone located at the intersection of the resistance level 44000.00 (former top of wave iv from March) and the resistance trendline of the daily up channel from May.
The breakout of this resistance zone accelerated the active impulse wave (3) – which is part of the multi-month upward ABC correction 2 from April.
Dow Jones index can be expected to rise to the next resistance level 45000.00 (target price for the completion of the active impulse wave (C)).

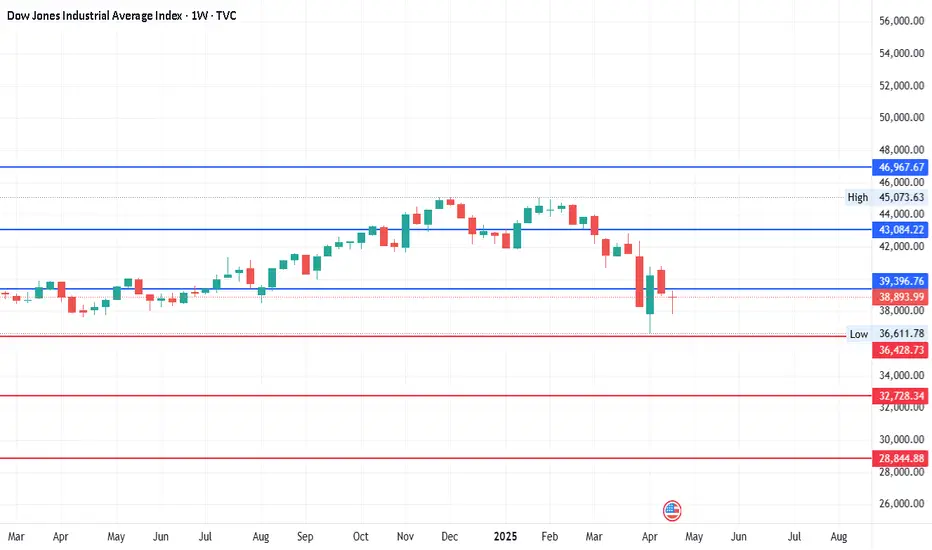
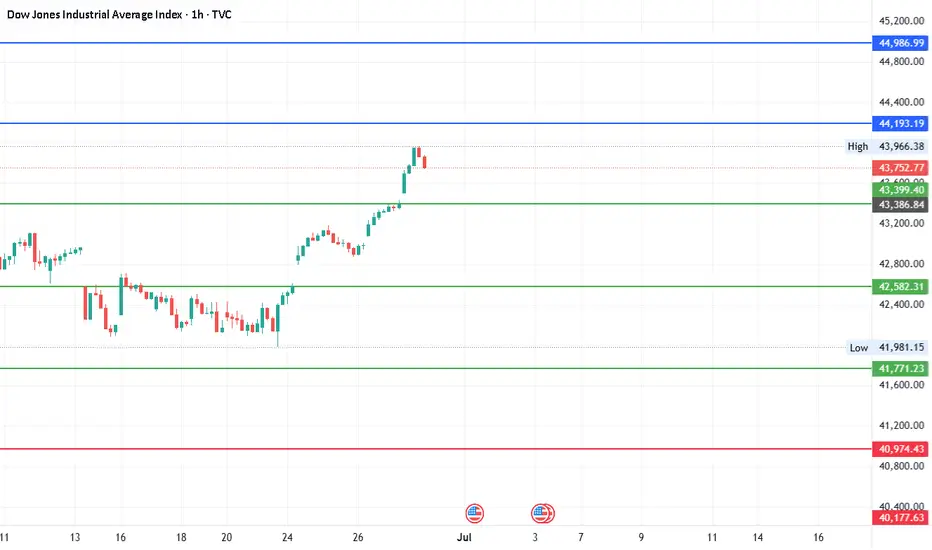
#DJI - Pivot is 42582.31 | Target 38374.12 or 46790.50?Date: 27-06-2025
This is in continuation with the previous post of 8000 points target. We have a new pivot point for the next move.
#Dow Jones Current Price: 43880.
Pivot Point: 42582.31 Support: 41771.23 Resistance: 43399.40
#Dow Jones Upside Targets:
Target 1: 44193.19
Target 2: 44986.99
Target 3: 45888.75
Target 4: 46790.50
#Dow Jones Downside Targets:
Target 1: 40974.43
Target 2: 40177.63
Target 3: 39275.875
Target 4: 38374.12
US30: Bears Are Winning! Short!
My dear friends,
Today we will analyse US30 together☺️
The market is at an inflection zone and price has now reached an area around 44,041.6 where previous reversals or breakouts have occurred.And a price reaction that we are seeing on multiple timeframes here could signal the next move down so we can enter on confirmation, and target the next key level of 44,013.0..Stop-loss is recommended beyond the inflection zone.
❤️Sending you lots of Love and Hugs❤️

US30 Technical Outlook – 07/01/2025📍 US30 Technical Outlook – 07/01/2025
Monster rally continues! 🚀 Price exploded off the 42,100–42,200 demand zone and has now pushed deep into the 44,150–44,250 major resistance area.
🧠 Key Observations:
Trend remains extremely bullish ✅
Price is consolidating just under 44,250 resistance 📍
EMAs (43,894 and 44,052) still showing strong upward momentum ✅
📊 Key Price Zones:
🔼 Major Resistance: 44,150 → 44,250 → 44,400
🔽 Key Support: 43,800 → 43,600 → 43,400
📈 Trade Setup Ideas:
🔹 Long Bias:
Pullbacks into 43,800 → 43,600 support
Look for bullish continuation setups if price stays above EMAs
Target: Breakout toward 44,250 → 44,400
🔻 Short Bias (Countertrend / Caution):
Only look for short scalps if price gives clear rejection (wicks, bearish engulfing, etc) from 44,250–44,400 zone
Possible downside target: 43,800–43,600

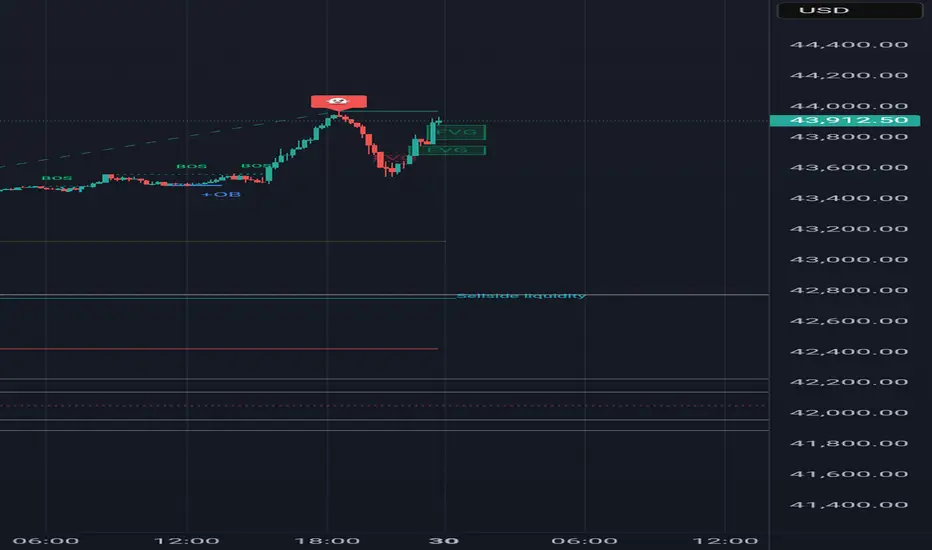
Look into it{
"alerts": [
{
"name": "US30 Bull Break",
"condition": {
"symbol": "US30",
"operator": "crossing",
"value": 43950
},
"message": "📈 US30 Breakout Alert: Price crossed above 43,950. Watch for BUY setup targeting 44,100.",
"actions":
},
{
"name": "US30 Bear Rejection",
"condition": {
"symbol": "US30",
"operator": "crossing_down",
"value": 43800
},
"message": "📉 US30 Bearish Rejection: Price fell below 43,800. Watch for SELL setup toward 43,400 OB.",
"actions":
}
]
}

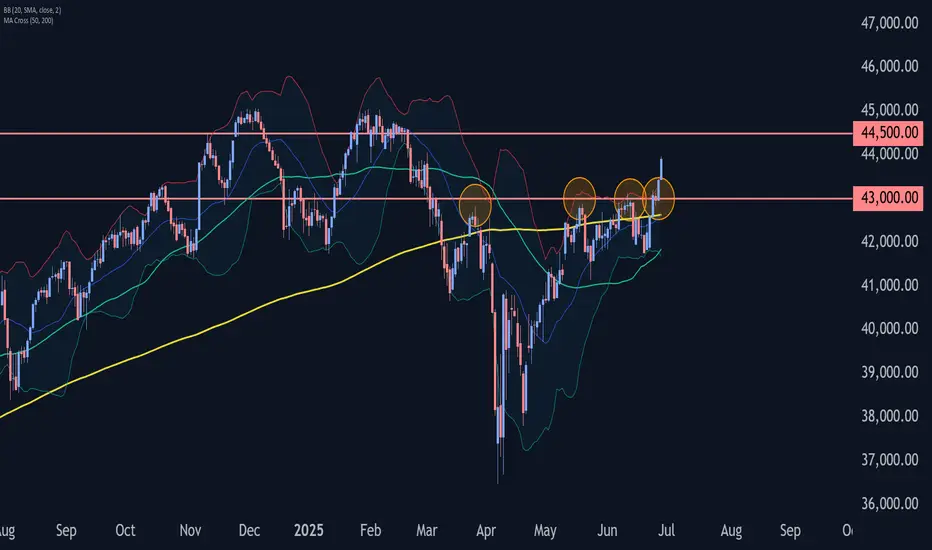
Dow Jones Wave Analysis – 27 June 2025
- Dow Jones broke pivotal resistance level 43000.00
- Likely to rise to resistance level 44500.00
Dow Jones index recently broke above the pivotal resistance level 43000.00 (which has been reversing the price from the end of March, as can be seen from the daily Dow Jones chart below).
The breakout of the resistance level 43000.00 accelerated the active impulse wave 3 of the intermediate impulse wave (C) from the end of May.
Dow Jones index can be expected to rise to the next resistance level 44500.00, which is the target price for the completion of the active impulse wave (C).