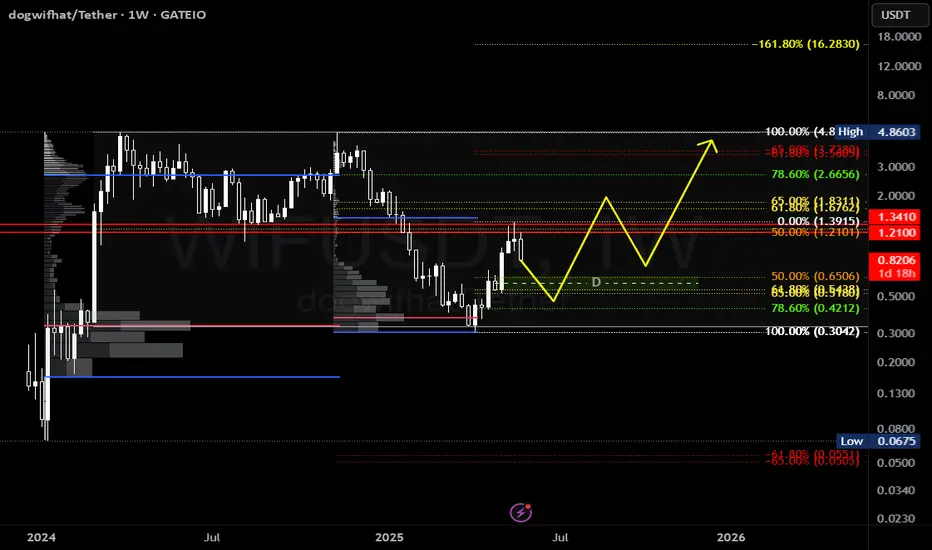
WIF/USDT Weekly Chart Analysis – June 11, 2025
The chart for WIF (Dogwifhat) on the weekly timeframe shows a bullish breakout setup emerging from a long-term descending channel. Price has bounced off the lower boundary and is now pushing higher.
🔍 Key Technical Highlights:
Current Price: $0.996
Structure: Descending channel (breakout in progress)
Momentum: Weekly candle closed +12.04%, indicating strength
🎯 Potential Upside Targets:
$1.70 – Breakout confirmation zone
$3.00 – Mid-channel horizontal resistance
$4.20 – Full breakout target at channel top
📈 Technical Outlook:
A clean breakout above $1.00 and hold above it may validate the bullish reversal.
Watch for a retest of $1.00 as support before continuation.
If momentum continues, WIF could target $3.00 and $4.20 in the coming weeks.
📌 Summary Strategy:
Buy Zone: On confirmation of breakout & retest (~$1.00)
TP1: $1.70
TP2: $3.00
TP3: $4.20
Invalidation: Break below $0.85 (channel base)
WIFUSDT trade ideas

Might be a quick drop , could be 20% in this or the next weekPrevious week was inside week,this week opened up and Monday pumped to previous weeks high, then put in a false break on Tuesday, which coincide with Wednesday, the back side of the week,it was making higher low every session during the front side of the move, In Wednesday’s London session it open below a prior session low. So I put a limit order when it pull back up to that level, because last week was an inside week, we could see a violence drop in this or the next week back toward or to the low of the previous week, minimum target is current week’s low and another target is previous week’s low

They brought it down for the fill — now it's time to see who’s rBINANCE:WIFUSDT just reacted perfectly off the 0.618 golden zone at 0.827 with bullish intent. The STB 1D and FVG 1D combo formed a high-probability demand zone that Smart Money won't ignore lightly.
Here’s the bullish roadmap:
Entry: 0.788 (bottom wick through 0.618 fib)
Structure: Clear higher low with mitigation of FVG 1D
Volume: Climax candle into key levels — classic absorption
Targets:
TP1: 0.921 (mid-level fib and consolidation ceiling)
TP2: 1.015 - 1.132 (FVG to OB 1D imbalance fill)
TP3: 1.321 (full expansion target — optimal trade entry delivery)
Moonshot: 1.393 if bulls dominate past OB retest
Invalidation: Daily close below 0.692 (STB 1D)
Price doesn’t just reverse — it transfers power. This is that shift.
For more plays just like this — all based in structure and timing — check the profile for setups that speak precision, not prediction.

analysis on wif Check out WIF Lets see if Wif can do $1.50 in the coming weeks let me know your ideal.
Wif big dump to 0.9647just recently hopped into a short position on wif. Targeting $0.8512
Time sensitive.
Big short likely in play. .
3.5+RR
Weekly tf was already high, market seems to be heading back down to try and find a new HL to continue the bullish move...or maybe not

I didn’t chase the high. I waited for the reclaim.WIF ran the 1.048 liquidity, reversed, and now it's offering the kind of structure I don’t second-guess. This isn’t about trend — this is about reclaiming control.
Here’s the map:
Price retraced cleanly into the BPR zone between 0.944 and 0.920 — right in the middle of the fib rebalancing zone
0.618 fib sits at 0.920, which makes this entire region a Smart Money entry block
Below that is the 1H OB at 0.840 — a worst-case sweep zone if liquidity gets run
Current structure suggests a tight range building beneath the previous high — a classic setup before a displacement move into 0.999 → 1.048
Hold above BPR and reclaim 0.969? That’s your greenlight.
Execution plan:
Entry: 0.944–0.920
TP1: 0.969
TP2: 1.048
Invalid below: 0.885 — or full re-entry from the 1H OB near 0.840
The move already happened. This is the retest. You either planned for it — or you're reacting late.
Precision like this lives in the profile. Setup-first. Noise-free.

WIF USDT WIF may dip to the 0.740 area before moving higher
You could wait for confirmation at the $0.740 area (e.g. hammer candle, bullish divergence on RSI/MACD).
Set stop-loss slightly below that level in case support doesn't hold.

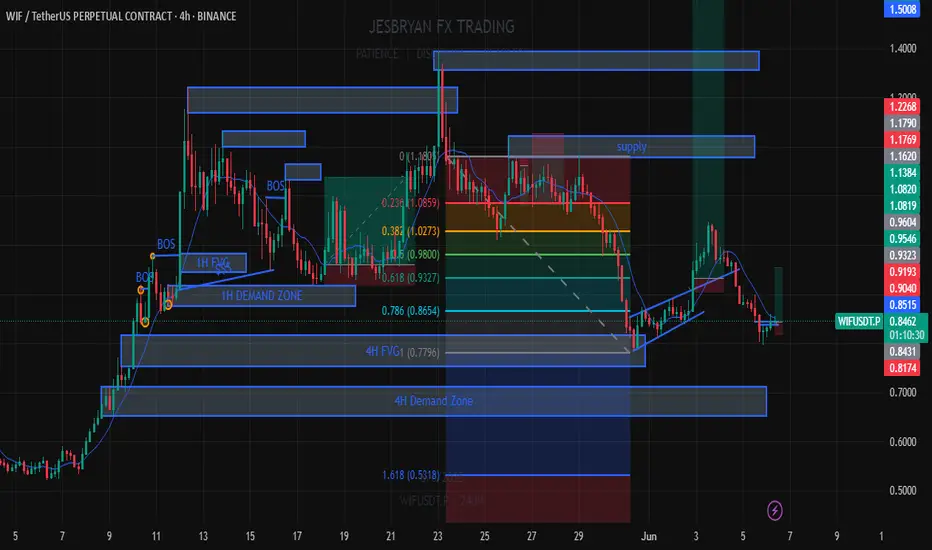
$WIF/USDT POTENTIAL PUMP INCOMING? Chart Overview
- Bullish Bat Pattern, suggesting potential reversal near completion point D.
- Price recently completed the pattern, currently near trendline and 0.618 Fib retracement zone.
- (OBV) broke out of consolidation, hinting potential volume shift.
Demand Zone / Support
- Demand Zone : $0.30–$0.41 (green box ).
- Key Trendline Support : Rising trendline from May remains intact.
Supply Zone / Resistance
Supply Zone : $1.18 – $1.38 (purple box).
This area aligns with the high volume node on the right-side volume profile.
Strong rejection likely if price approaches without major breakout.
Volume Profile
High Volume Node (HVN): $1.06 - $1.15 , confirming strong interest/previous consolidation.
Low Volume Node (LVN): $0.80 – $0.95 , suggesting potential fast moves up/down.
Fair Value Gaps (FVG)
First FVG: ~$0.96 – $0.98
Second FVG: ~$0.89 - $0.92
These are targets if price moves upward.
Fibonacci Levels
- 0.618 retracement (~$0.85) aligns near trendline — major confluence.
- 0.786 retracement (~$0.71) rests below trend line.
Bullish Scenario
- Price holds above 0.618 Fib (~$0.85) and bullish trendline.
- Breaks above to fill FVG and move toward $1+.
- OBV breakout supports accumulation and incoming demand.
Bearish Scenario
- Price breaks below $0.65 and loses trendline.
- Bearish invalidation of Bat pattern, opening room to drop to:
- Fib Lev 1 or deeper into the $0.50–$0.40 zone.
- Volume fades on OBV
Risks
- Trendline Break : Potential aggressive sell-off.
- Volume Drop : If OBV rally fails, buyers dry up.
- Macro/Sentiment : WIF is meme-sensitive.
Summary
Bullish Bat completion with price testing a high-confluence zone (trendline + 0.618 Fib).
Many upside targets with FVGs.
If Price breaks below trend line and 0.65, bullish/long predictions will be invalid.

This wasn’t a bounce. It was a reclaim.BINANCE:WIFUSDT.P hit the daily OB at 0.8330 and snapped back — not with hope, but with intent.
Smart Money didn’t panic on the drop. It positioned.
Here’s the structure:
Price tapped a clean D OB, aligned perfectly with 0.618 fib — the algorithm’s comfort zone
The bounce reclaimed 1.00 fast, and the market is now flirting with internal liquidity near 1.0178 and 1.1339
Above, the real draw sits at 1.3965 — a void yet to be filled
Below, we still have W OB liquidity near 0.7260 if this rotation fails
This move doesn’t need hype. It needs follow-through. If we consolidate above 0.9299 and break into 1.0178 clean, the next phase unlocks — straight into the 1.13–1.32 range.
Execution plan:
Bias remains bullish above 0.92
Pullbacks into 0.89–0.83 are still valid long zones as long as 0.7260 doesn’t get breached
Target 1.1339 first — then 1.3965 as the higher timeframe liquidity magnet
This setup isn’t emotional. It’s engineered. You don’t need to guess when price is built to deliver.
More trades like this — real levels, real invalidations — are in the profile description.

Wif long to $0.93Just a while a go opened up a long position on wif. Aiming for $0.93. The market seems quite low and is in need of a correction before continuation down. I anticipate that we'll get that correction now to the upside.
Stop: $0.8461 or lower
Tp: $0.93
Time sensitive

A 35% fall in WIF from its current price levels is possibleWIF has just broken below the 200 EMA on the H4 timeframe and reacted to an imbalance area.
From here, it’s possible for a pullback to form in an ABC pattern with low volume on the upward move, potentially testing the resistance zone where the 200 EMA may also act as resistance.
Looking at the BTC chart, there’s still room for further downside, which supports our thesis.
Using the RSI across the M15 and H1 timeframes to identify overbought areas with divergence could serve as the entry trigger.
Let’s see what this week brings!

#WIF RangeHTF still inside a big range here imo, price got rejected at mid range, as i am bullish for june for alts watching reaction if have deep retracement & aim for higher.
sooner or later range will break, still traders paradise here
WIF sniffs!WIF looks to sniff a bit but the OB looks very delicious atm, 35% buys at cmp but buys at the orange box looks more like a delicaisies where two instances are marked what can happen!


WIF WIF, whose there?Bit late to post as i posted it late, but however wif looks weak to break even the black line!

#WIF/USDT#WIF
The price is moving within a descending channel on the 1-hour frame, adhering well to it, and is heading for a strong breakout and retest.
We are seeing a rebound from the lower boundary of the descending channel, which is support at 1.06.
We have a downtrend on the RSI indicator that is about to be broken and retested, supporting the upward trend.
We are looking for stability above the 100 Moving Average.
Entry price: 1.068
First target: 1.115
Second target: 1.157
Third target: 1.211

WIF/USDT About to Explode or Collapse?Yello Paradisers, have you prepared yourself for what’s about to unfold on SEED_WANDERIN_JIMZIP900:WIF ? Because this setup is screaming opportunity but only for those who are ready to act with precision and patience.The current price structure is forming a classic descending wedge, a pattern that historically resolves with explosive moves. But here’s where it gets really interesting.
💎#WIFUSDT is now grinding toward a key demand zone between 0.82 and 0.87, where there is a high probability of a strong rebound. This zone aligns perfectly with the 50 EMA, further reinforcing the potential for a bullish reversal.
💎If the demand holds, we could easily see price break out from this compression pattern and push toward the moderate resistance near 1.22. Above that, the major resistance zone around 1.42 to 1.45 remains the next magnet a zone where large players are likely to take profit or even reverse positions.
💎However, we’re not ignoring the bear case either. If this demand fails to hold, and the price we are expecting for a bullish rebound from the lower demand at $0.719 closes below 0.642, the setup becomes invalidated, and the door opens for a deeper correction—possibly driving price toward or even below the 0.50 level. That would flush out overleveraged positions and trap breakout traders on the wrong side once again.
Patience and precision will be your edge in this volatility. Be a pro. Trade smart. Stay disciplined.
MyCryptoParadise
iFeel the success🌴

Buy Trade Strategy for WIF: Exploring Meme Coin Momentum and UtiDescription:
This trading idea focuses on WIF (dogwifhat), a meme-based cryptocurrency that has gained traction as part of the broader meme coin movement, following the path of tokens like DOGE and SHIB. WIF operates on the Solana blockchain, benefiting from its high-speed, low-cost transaction capabilities. Beyond its meme appeal, the community-driven nature of WIF, combined with a growing online presence and increasing exchange listings, has positioned it as a speculative asset with viral potential. As meme coins continue to capture market attention, WIF could experience significant momentum fueled by social engagement and speculative demand.
However, meme tokens are particularly volatile and highly sensitive to market trends, public sentiment, and social media influence. WIF should be approached with caution, as price movements can be unpredictable and rapid.
Disclaimer:
This trading idea is for educational purposes only and does not constitute financial advice. Investing in cryptocurrencies like WIF involves high risk, including the potential loss of all invested capital. Always perform thorough research, evaluate your financial situation, and consult with a licensed financial advisor before making investment decisions. Past performance is not a guarantee of future results.

Wif long ### **WIFUSDT Price Analysis**
The **WIFUSDT** cryptocurrency has recently started its upward movement, successfully breaking its **downtrend**. This signals increasing buying pressure and the potential for a continued bullish trend.
### **Trend Analysis:**
- **Breakout of the Downtrend:** The price has surpassed key resistance levels, indicating a shift in market structure and renewed buyer interest.
- **Increasing Trading Volume:** Recent volume growth suggests higher liquidity entering the market, potentially accelerating the price rise.
- **Price Target:** Given the current movement, the **$3 target** appears achievable, provided the price stabilizes above key resistance areas.
### **Key Levels to Watch:**
- Price consolidation above the breakout level for confirmation of further upward momentum.
- Monitoring technical and fundamental indicators to validate trend strength.
- Identifying support zones along the upward path that could serve as potential entry points.
If you'd like a more detailed analysis including technical and fundamental indicators, let me know, and I'll refine the insights!

WIF NEXT In my opinion, this is the likely scenario.
* The purpose of my graphic drawings is purely educational.
* What i write here is not an investment advice. Please do your own research before investing in any asset.
* Never take my personal opinions as investment advice, you may lose your money.

WIFUSDT 1D Analysis WIF ~ 1D Analysis
#WIF Buy gradually after successfully breaking through this resistance line with a short-term target of at least 15%++

Wif short to $0.9310Just took a short on #wif
🎯Target: $0.9310 full close
Roughly 3RR
Expected to playout tonight / before US session.
Stop: $1.0129 or higher
#wifusdt

Wif aggressive short to $0.7821#wif short
Might get drawdown with this one. or just straight aggressive drop
Tp: $0.7821
