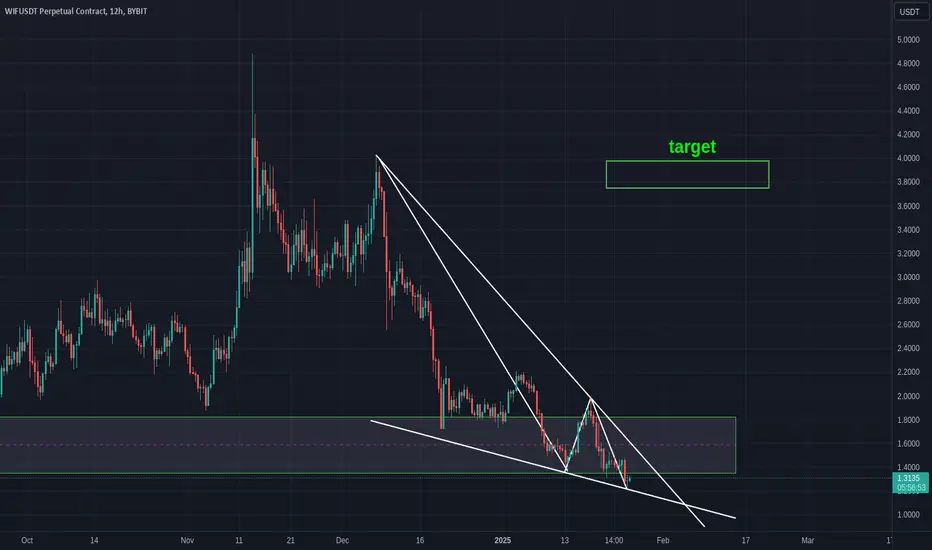
Falling Wedge PatternA falling wedge pattern is currently forming, starting from October 8th. This pattern is characterized by a downward-sloping resistance line (lower highs) and a support line (higher lows) converging over time. The price is tightening within this range, indicating potential bullish pressure building up for an eventual breakout to the upside.
Target Zone: $3.9
Wedge Height:
High near $4.6
Low near $1.5
Approximate height: $3.1
WIFUSDT trade ideas
$WIFUSDTbuy on spot, dont take leavrage, protect capital dont get liquidated
oversold zone RSI
Buy at support zone , reversal happen soon , good risk and reward , accumulation zone
Time take to reversal will be super cycle 10X-90X-100X

WIF Bullish Signal !The scenario of bullish is like drinking a coffee and just sit and enjoy!
Entry at the current point seems reasonable...

WIF/USDT Elliott Wave C Analysis1️⃣ Fibonacci Targets for Wave C Completion
Wave C in an ABC correction typically extends to key Fibonacci levels derived from Wave A:
1.000 Fib Extension (~$2.851) → Most common Wave C completion target.
1.236 Fib Extension (~$4.049) → Stronger bearish momentum may push towards this level.
1.382 Fib Extension (~$5.031) → Overextended correction possibility.
1.618 Fib Extension (~$6.144) → Rare but possible deep Wave C completion.
📌 Interpretation: These levels represent potential Wave C termination zones where price might find support before transitioning into a new wave structure.
2️⃣ Fibonacci Retracement Levels for Wave C Support Zones
If the downward correction deepens, these retracement levels act as critical support:
0.618 Fib Retracement (~$0.614) – First deep corrective support, price may attempt a bounce here.
1.236 Fib Retracement (~$0.723) – Key structure validation level, break below signals further downside.
1.382 Fib Retracement (~$0.579) – Final support zone before significant breakdown risk.
📌 Interpretation: A rebound from these levels would support Wave C completion, whereas failure to hold them could indicate prolonged bearish pressure.
3️⃣ Elliott Wave Structure & Wave C Confirmation
Bullish Reversal Conditions
For Wave C to complete and initiate a reversal, the following must happen:
Price must break above the 1.000 Fib Extension ($2.851) to signal bullish intent.
Volume confirmation: A significant increase in buying volume at key support levels.
MACD bullish crossover on mid to high timeframes (1D/4H).
Bearish Risk Factors
Failure to hold $0.614 → Signals continued bearish control.
MACD remains bearish → No confirmation of trend reversal.
No breakout above $2.851 → Suggests deeper downside risk.
📌 Key Reversal Confirmation:
✅ Break above $2.851 → End of Wave C, potential trend shift.
❌ Close below $0.579 → Signals extended correction or potential new bearish trend.
4️⃣ Why Wave 5 is Unlikely
A potential Wave 5 scenario would require:
A break above $4.880 (prior resistance) to confirm a new bullish impulse.
Strong volume and momentum continuation beyond $5.551, $8.43, and $15.347.
📌 Low Probability Factors for Wave 5:
Lack of impulsive wave structure beyond Wave C extension.
Price structure still following corrective ABC movement.
No clear wave formation beyond the corrective phase.
🚨 Conclusion:
Wave 5 is not highly likely unless a breakout above $4.880 occurs, triggering further impulse movement.
5️⃣ Conclusion & Trade Considerations
✅ Primary Scenario (Wave C Completion)
Wave C Targets: $2.851, $4.049, $5.031, $6.144.
Support Zones: $0.614, $0.723, $0.579.
Reversal Confirmation: Break above $2.851 needed to validate end of correction.
❌ Low Probability Scenario (Wave 5)
Invalid unless $4.880 breaks with volume.
Target zones for Wave 5: $5.551, $8.43, $15.347.
Failure to break key levels = no wave 5.
📌 Trade Strategy Considerations:
Look for long entries near Wave C completion zones ($2.851 - $0.614).
Monitor volume & RSI for bullish divergence before confirming trades.
Avoid premature entries until clear reversal signs emerge.

Fake brekout party come.Fake brekout party come. Hi i mena its more liquidation futures contracts. Party time started :) good luck.

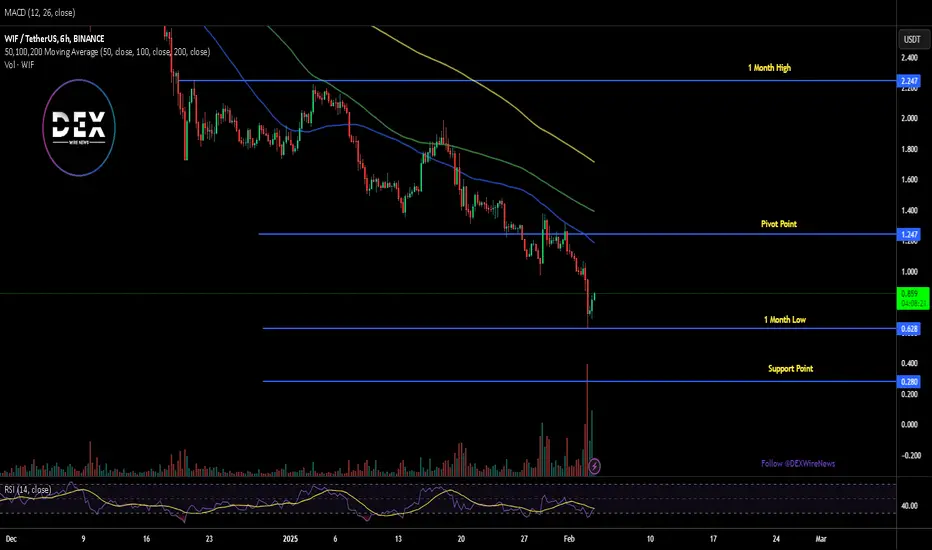
Dogwifhat ($WIF) Breaks $1 Psychological Support – What’s Next?Dogwifhat ( SEED_WANDERIN_JIMZIP900:WIF ), the popular Solana-based meme coin, has experienced a sharp decline, breaking below the critical $1 psychological support and trading at $0.829 at the time of writing. This marks a significant 12.42% drop today, pushing SEED_WANDERIN_JIMZIP900:WIF further from its all-time high (ATH) of $4.83 recorded in March 2024.
The recent dip raises concerns among traders and investors, especially after notable crypto figures, including Arthur Hayes, previously speculated that SEED_WANDERIN_JIMZIP900:WIF could surge to $5. However, current market conditions and technical indicators suggest a different scenario.
Technical Analysis
- Support and Resistance Levels: The one-month low is acting as a short-term support zone. A break below this level could push SEED_WANDERIN_JIMZIP900:WIF further down to $0.29, a critical foreseen support level that might stabilize the asset.
- Fibonacci Retracement Levels: The 38.2% Fibonacci retracement level serves as a key pivot point at $1.24. If SEED_WANDERIN_JIMZIP900:WIF can break above this level, we could see a potential rally towards $2.50 and beyond.
- Relative Strength Index (RSI): With SEED_WANDERIN_JIMZIP900:WIF ’s RSI currently approaching oversold levels, traders may see a short-term bounce, but the overall trend remains bearish unless key resistance levels are broken.
Fundamental Analysis
Dogwifhat ( SEED_WANDERIN_JIMZIP900:WIF ) remains a dominant meme coin on the Solana blockchain, enjoying strong community engagement and significant exchange listings. Here’s a look at its market performance:
- Trading Volume: SEED_WANDERIN_JIMZIP900:WIF ’s 24-hour trading volume surged to $1.62 billion, marking a 134.7% increase, signaling heightened trading activity.
- Exchange Listings: Major exchanges like Binance, MEXC, and LBank continue to facilitate active trading, keeping SEED_WANDERIN_JIMZIP900:WIF accessible to a global audience.
- Historical Performance: Despite its recent decline, SEED_WANDERIN_JIMZIP900:WIF remains significantly above its all-time low of $0.001555 recorded in December 2023, reflecting a massive 54,054.03% increase.
Market Sentiment & Outlook
The ongoing bearish sentiment in the broader crypto market has contributed to SEED_WANDERIN_JIMZIP900:WIF ’s decline. However, meme coins often rely on speculative momentum and social engagement, meaning a resurgence is possible if investor sentiment shifts.
Conclusion
Dogwifhat ( SEED_WANDERIN_JIMZIP900:WIF ) faces a critical test after breaching the $1 support. While the short-term outlook appears bearish, traders are closely watching key support and resistance levels to determine the next move. With strong trading activity and major exchange listings, SEED_WANDERIN_JIMZIP900:WIF is still a player in the meme coin space, but investors should tread carefully amid current volatility.
#WIF Goodbye wif Some naive people think that Trump is a savior and a hero who will bring the crypto market to an altcoin season (Alt Season) with his arrival. Unaware that Trump will do something with crypto that will be recorded in history and the Guinness Book of Records, leading to the complete destruction of this market. It all started with his own meme coin, which caused a severe crash in the entire altcoin and meme coin market. The damage he inflicted on the market with his meme coin had not yet healed when he introduced his wife's meme coin. After that, we witnessed the foolish political-economic statements of his son. Now, he has also started a trade war between countries, and its effects are visible in the crypto market. Do not forget what happened to Trump in America after Trump's presidency ended. Now, he is full of resentment and anger and no longer cares about the people. He is doing everything he can to ensure that he and his inner circle accumulate enough wealth and power so that no one can harm him again.
My advice to you is to avoid trading in the futures market for the next three months, or even six months, and focus only on options and spot trading, with Bitcoin being your primary focus, as government entities are also buying it. However, altcoins and meme coins will soon experience a more severe crash, as Trump has proven that he is not someone who solves problems peacefully and always takes the worst possible actions.
Every crisis in the market is not opportunity to exit altcoins and meme coins. Please adapt yourself to the current conditions; it is no longer like previous years, and do not wait for an altcoin season. There is no altcoin season anymore, because in the past, these seasons were due to the limited number of coins in the market, not now when thousands of new coins are created daily, and governments have also entered the crypto market. Any market that governments enter will never benefit ordinary people unless a miracle happens and conditions change, which I doubt will occur anytime soon.
You never thought prices would reach this level, but they did. Do not think that now is a good time to buy, because prices will go even lower, and this is the beginning of a massive crash that will be recorded in history. Also, keep in mind that since government entities and large companies are buying Bitcoin, they will certainly do something to cause its price to drop so they can buy Bitcoin from ordinary people at lower prices.
Ethereum has also proven that it has not had significant growth during this period. Therefore, try to protect your capital until we get through this crisis created by Trump.

WIFUSDT: Is This the Last Stand Before a Breakout?A Critical Moment for WIFUSDT: Buyers or Sellers—Who Wins?
WIFUSDT is teetering at a pivotal point, currently priced at $0.9981, reflecting a staggering -79.56% deviation from its all-time high of $4.8848 just 81 days ago. Meanwhile, the asset remains a massive 486% above its absolute low recorded nearly a year ago, underscoring its extreme volatility.
Technical indicators are flashing mixed signals:
📉 RSI14 is hovering around 32.19, signaling that WIFUSDT is approaching oversold conditions, but not quite there yet.
📊 Moving Averages are still bearish, with MA50, MA100, and MA200 sitting well above the current price, reflecting lingering downside pressure.
However, the latest candle patterns suggest growing instability:
✅ Buyers attempted a takeover in the last session, driving prices from $0.9807 to $0.9981 with a high of $1.0194.
❌ Prior bearish volume dominance, where increased selling pressure pulled the price down from $0.9966 to $0.9807, remains a concern.
So, what’s next? Is WIFUSDT on the brink of reclaiming key resistance levels at $1.2916 and beyond, or will it succumb to seller dominance and revisit its lower support zones? Your move, traders.
WIFUSDT Roadmap: Tracking the Market's Next Big Move
VSA Manipulation Sell Pattern 3rd (Jan 31, 18:00 UTC)
Heavy sell-off triggered a sharp decline $1.2625 → $1.1371, with a low at $1.1082. A textbook VSA manipulation move, where weak hands were shaken out. The key question: will buyers step in at this level, or is more downside ahead?
Increased Buy Volumes (Jan 31, 19:00 UTC)
Buyers made an aggressive comeback, pushing the price $1.1371 → $1.1813. A solid confirmation of demand, but resistance at $1.1990 remains a critical barrier. Will this be a continuation or just a liquidity grab before another dump?
VSA Manipulation Buy Pattern 3rd (Feb 1, 10:00 UTC)
This was the true test of bullish strength. Price surged from $1.0916 → $1.1021, closing above the trigger point—a classic signal for an extended move. But will bulls hold their ground, or will sellers take over again?
Increased Sell Volumes (Feb 2, 03:00 UTC)
Trap alert! After a brief rally, sellers stepped back in, pushing the price down $0.9966 → $0.9807. Bears are showing dominance, but they failed to break below the key level of $0.9773.
Sell Volumes Takeover (Feb 2, 04:00 UTC)
This was the moment of truth—bears tried to push lower, but bulls fought back, sending the price $0.9807 → $0.9981. This reversal hints at potential upside, but confirmation is needed with a break above $1.0194.
Conclusion: The market has been heavily manipulated by both sides, but the last pattern suggests sellers are losing steam. If $1.0194 is broken, expect further upside momentum. However, a drop below $0.9773 could signal another bearish wave. Time to watch closely!
Technical & Price Action Analysis
When it comes to trading WIFUSDT, key levels are everything. If buyers can’t hold support, those same levels will flip into resistance—classic market behavior. Here’s the roadmap:
Resistance Levels:
$1.2916 – First real test for bulls, flipping this opens the door for momentum plays.
$1.3355 – A historical supply zone; break and hold above confirms bullish intent.
$1.5553 – Major liquidity level; failure here could mean distribution.
$1.8968 – If price gets here, it’s game on for breakout traders.
$2.0384 – Last known battleground before an aggressive trend shift.
Powerful Support Levels:
$1.4167 – Critical bounce zone; failure turns it into a major resistance.
$2.0848 – If this gets tested, expect big bids or a deep dive.
Powerful Resistance Levels:**
$0.8363 – The biggest wall for any dip buyers; reclaiming flips the script.
$0.35 – If price ever touches this, it’s bargain-bin shopping or full collapse mode.
Smart money watches these levels closely. If support holds, it’s a dip-buying opportunity. If not, those same levels will act as ceilings, trapping breakout traders. Play it right, and don’t get caught on the wrong side of the move.
Trading Strategies Based on Rays
Concept of Rays:
My analysis method is based on VSA Rays, constructed using Fibonacci principles. These dynamic levels define movement channels, allowing us to track price behavior at key zones. The price will either bounce or break through these rays, signaling a reversal or continuation, but only after confirming with volume dynamics and key patterns.
Instead of guessing exact price levels, we focus on probability zones where price interaction with rays gives us trading opportunities. The Moving Averages (MA50, MA100, MA200, MA233) serve as dynamic resistance/support, interacting with these rays and enhancing trade setups.
Optimistic Scenario (Bullish Playbook):
If price confirms interaction with a bullish VSA Ray, we enter long positions targeting the next resistance level. Each new level serves as a potential profit zone or a point of reevaluation.
Entry: Above $0.9981 (confirmed breakout from VSA Ray + bullish candle close)
Target 1: $1.2916 (first ray extension)
Target 2: $1.3355 (higher liquidity zone)
Target 3: $1.5553 (major supply area, strong resistance)
Invalidation: If price drops below $0.9773 and confirms with volume shift
Pessimistic Scenario (Bearish Playbook):
If price rejects from a bearish VSA Ray or fails to hold above dynamic support, shorting opportunities emerge with key downside targets.
Entry: Below $0.9807 (confirmed rejection + bearish volume surge)
Target 1: $0.8363 (first support level, possible bounce)
Target 2: $0.3500 (strong liquidity absorption zone)
Target 3: Below $0.1702 (if major breakdown occurs)
Invalidation: If price reclaims $1.0194 with strong bullish volume
Key Takeaways:
Trade only after confirmation of interaction with rays
Expect movement from one ray to the next—each level acts as a stepping stone
Use MAs for additional confluence—failure to break a moving average signals continuation
Volume always matters—no volume = no conviction, wait for a real move
The market is dynamic, but VSA Rays + Key Levels give us the edge to stay ahead. Watch for interaction and execute with precision.
Let’s Talk Trading—Drop Your Thoughts Below!
Got questions? Want to dive deeper into the setups? Drop a comment! I always check and reply, so let’s discuss the best trading opportunities together.
If this breakdown helped you, hit Boost and save this idea—watch how price respects these levels over time. Trading is all about understanding key reaction zones, and this analysis gives you the exact roadmap.
By the way, my custom VSA Ray indicator automatically maps all these levels and updates in real-time. It’s private, but if you want access—DM me and we’ll talk.
Need analysis for another asset? I can chart anything! Some breakdowns I share publicly, but if you want something private and exclusive—we can arrange that too. Just let me know in the comments what you need.
My rays work on all markets—crypto, forex, stocks—you name it. If you want a custom markup for your asset, just Boost this post and comment below, and I’ll do my best to make it happen.
Most importantly—follow me on TradingView to stay ahead of the market moves. Let’s trade smart, not blind! 🚀

$WIF in a DEATH SPIRAL, where to SHORT ITSEED_WANDERIN_JIMZIP900:WIF Back To Its Potential Death Spiral After a Short-Lived Dead Cat Bounce
Still one of the worst-performing memecoins with a market cap over a billion USD. Annoyingly, I had to close my short that I opened last Saturday after it hit my TP1 at $1.01 (Bearish Pennant #2 Target, see the 2hr chart for details) and immediately started pumping due to some hyped-up news about a promo campaign.
I don’t care about such news—these are for the streets. But I care about my capital, so I fully exited at entry ($1.285) since Dead Cat Bounces can be deadly sometimes. Not on this occasion, though—the price didn’t even reach my main $1.4 key resistance level before immediately selling off, leaving a nasty wick on that candle.
Downtrend Continuation and Short Setups
The Daily chart shows heavy selling pressure, and looking at the 2-hour chart, things aren’t looking any better—unless you're looking for short positions.
Potential entries:
$1.11 – First potential short due to a strong confluence of:
Golden Pocket (which acts as resistance when approached from below) & Descending Trendline (originating 6 weeks ago and tested multiple times).
$1.18 – Another short setup using:
Fib 0.5 retracement & descending 50 MA (yellow line on the 2hr chart).
$1.27-$1.28 – Potential Double Top rejection confirmation with:
Horizontal resistance & Equal High-type rejection.
$1.4 – The safest short entry, if price rejects:
Hardened horizontal resistance & Curved-down 200 MA, which would act as a heavy rejection zone.
Bearish Momentum & Macro Risks
Momentum is bearish on all timeframes, and I’ll look for further RSI rejections before entering any short positions. That said, these positions become high-risk if ETH pushes through its resistances. the DXY correcting below 108.05 would also invalidate
Sector Outlook: Absolute Pessimism
Not just SEED_WANDERIN_JIMZIP900:WIF —virtually the entire memecoin sector looks weak. No fundamentals = eventual extinction. Still can’t believe this thing was nearly $5 billion in market cap.
You do you, as always. 👽💙

WIFUSDT TRADE IDEA AND EXPLAINATION.WIFUSDT has swept previous low liquidity and did nice jump and did MS, As MS has been done so I will look for bullish order block and FVG for long. I have found bullish FVG and OB in bottom where I have focus to long it. I have marked trendline SSL as well,

WIF long term 300%+Now or never region for WIF around 0,9-1,3 usd. Very nice R:R. There is potential to see new ATH this year as volume is in place and smart money as well. Buy and hold.
THIS IS NOT A FINANCIAL ADVICE
MANAGE YOUR RISK AND ALWAYS USE STOPLOSS

WIF Can Hit $2—But It Depends on U.S. Inflation DataDogwifhat (WIF) surged 16% after the Fed rate decision, fueled by Jerome Powell’s comments that rate cuts could happen even if inflation remains above 2%. This statement lifted Bitcoin to $105K, sparking rallies across altcoins and memecoins, including WIF.
However, can WIF sustain this momentum and reclaim $2?
On the daily chart, WIF’s On-Balance Volume (OBV) spiked, indicating strong trading activity, with $326M in daily volume recorded on February 29—far exceeding March 2024 bid volumes. Despite this, OBV has yet to make a higher high, meaning further traction isn’t confirmed. Meanwhile, the RSI has only partially recovered from oversold levels, remaining below neutral—suggesting weak buying pressure.
Coinalyze data shows that WIF’s rally was fueled by both the Spot and Futures markets, with Open Interest (OI) jumping over 40% during the pump. However, OI has since declined, while Cumulative Volume Delta (CVD) on the Spot market remains steady, signaling continued demand.
For WIF to push past $2, upcoming U.S. inflation data (PCE index) needs to favor risk assets. If inflation data comes in weak, rate-cut expectations could drive another memecoin rally. But if inflation stays high, bearish sentiment could drag WIF below $1 again.
WIF traders should watch macroeconomic updates closely—this could be the key to the next big move! 🚀

WIF USDT🚀 #WIF
SEED_WANDERIN_JIMZIP900:WIF confirms a strong support bounce from a key historical level and is now forming a bullish reversal setup on the weekly chart 💁♂️
A continued bullish trend from here could push the price towards:
🎯 T1: $2.147
🎯 T2: $3.714
🎯 T3: $4.989
🔥 Triple bottom formation + descending wedge breakout = massive upside potential!

WIFUSDT(dogwifhat) Updated till 30-01-25WIFUSDT(dogwifhat) Daily timeframe range. this thing is on local low. if it can defend 1.058 you got yourself a very good risk and reward setup. thats a fact. but 1.058 need to be protected or stay above. resistance to look at 1.492.


WIF USDT🚀 It Feels Like It’s SEED_WANDERIN_JIMZIP900:WIF Season!
This time, we’re breaking the cycle of doubting #WIF holders! 😤
🔥 A 2x market cap increase is absolutely in play! 🚀
I still believe 💰 #WIF is a solid bet, even as it enters price discovery!
Time to break the multi-year resistance and send it to new highs! 🔥

WIF/USDT Chart Analysis 🟢#WIF meme coin chart analysis on weekly time frame
WIF at it’s strong support zones on weekly time. Bounce from it’s strong 💪 support with good volume.
Target :
1) 2.1$
2) 3.2$
3) 5$
@Whalesdesk

Dogwifhat (WIF) Surges 14% in 4 Hours – Is a Bigger Move Coming?Dogwifhat (WIF) has jumped over 14% in just 4 hours, reaching $1.34 by 12 p.m. EST, as investor interest in this Solana-based meme coin picks up. However, despite this rapid surge, WIF is still battling broader market struggles, having dropped over 7% in the past week and more than 30% in the last month.
According to GeckoTerminal, WIF recently broke through its $1.2451 support level, signaling renewed buying momentum. If it successfully pushes past $1.40, it could trigger a fresh buying wave, potentially sending the price toward $1.7045 and even $2.1221.
However, indicators are painting a mixed picture. While the EMA trend suggests downward movement, the MACD shows signs of buyers stepping in. The MACD lines are inching closer, meaning the next few hours could determine whether WIF sustains its gains or reverses course.
For now, WIF traders are eyeing the $1.40 breakout. If momentum holds, this meme coin could see another leg up. But if resistance remains strong, further consolidation may be in store.

$WIF - Long Trade IdeaSEED_WANDERIN_JIMZIP900:WIF | 1D
Previous low has been swept
Buying zone: 1.23 to 1.18
Stoploss: below 1.05
Targets:
tp1 - 1.40 to 1.50
tp2 - 1.76 to 1.92
tp3 - 2.36 to 2.50

#WIF From the moon to #WIF From the moon to oil
When you gamble your capital on meme coins, you should expect these things.
When Altseason were in circulation, the number of coins in the market was one-tenth of what it is now.
If you think another Altseason is coming, you are seriously mistaken.
There are 38,000 meme coins, altcoins, and shitcoins.
How else is it possible to have an Altseason ?

WifusdtHaven't posted about this coin in a while but it looks sufficiently forgotten about/ about to plunge to 0 so its probably time to buy
Retesting demand zone
Hasn't broken this level since claiming in its initial push from virtual 0

#WIF Return to starting pointThis is a rule that comes true 95% of the time.
Meme Coins return to where they started.
They go back to the starting point very quickly, but it takes years to get back up.
It has been falling for three and a half months and has fallen 74% so far.
Meme coins that do not have a proper community have a short lifespan and do not expect them to experience such growth again because new meme coins are coming out every day with new colors and glazes and most people tend to invest in new meme coins to go back and think about old meme coins again.
And with new meme coins, the possibility of old meme coins growing again is low unless their community wakes up.
