Dogwifhat Poised For 22% Growth Toward $1.50Hello✌
Let’s analyze Dogwifhat’s upcoming price potential 📈.
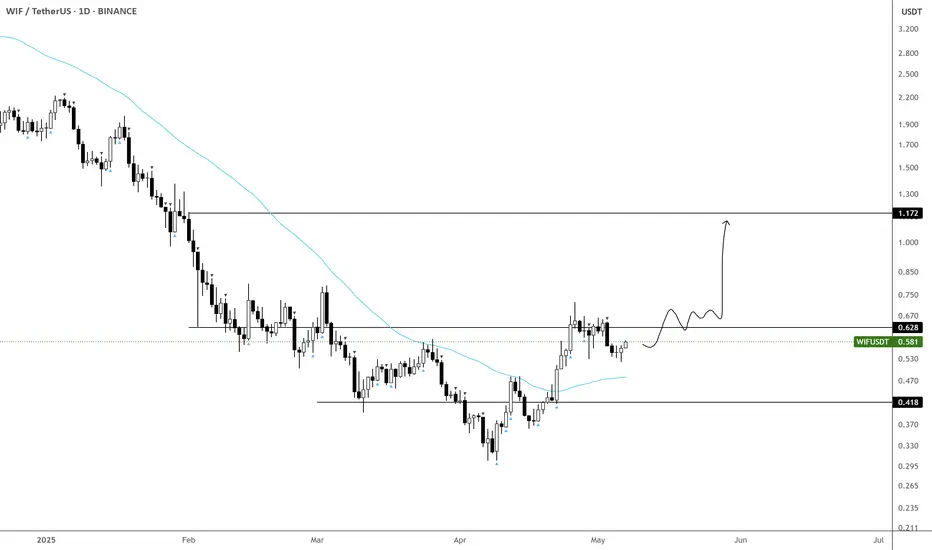
📈 BINANCE:WIFUSDT is currently sitting near a strong daily support and trendline. At the same time, the Fibonacci Level support lines up closely with this key level. This convergence suggests a potential upside of about 22%, aiming for a target price of $1.50. 🔥
✨We put love into every post!
Your support inspires us 💛 Drop a comment we’d love to hear from you! Thanks , Mad Whale
WIFUST trade ideas

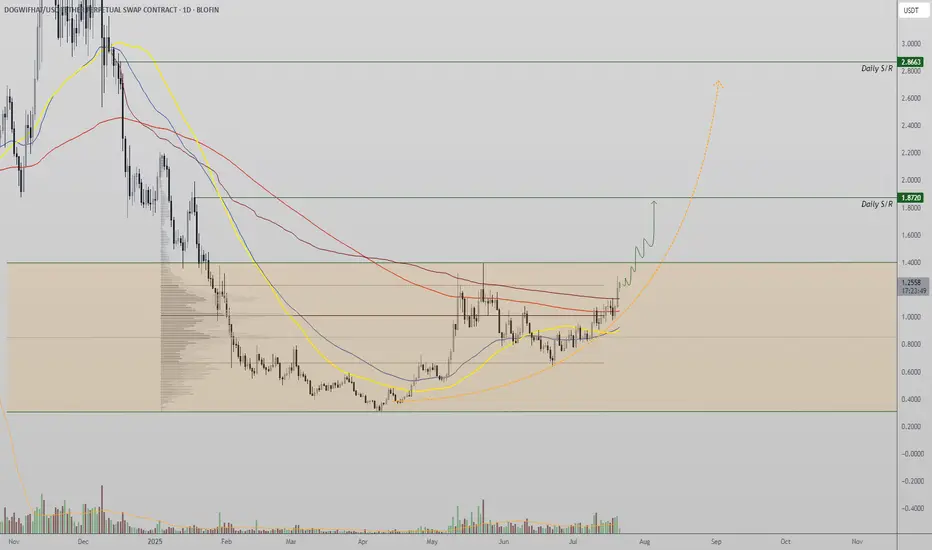
WIF Eyes Bullish Expansion as Range High NearsWIF (W-I-F) is gearing up for a potential parabolic move as it presses against key range high resistance. A confirmed breakout from this level, supported by rising volume, could trigger a bullish expansion first toward the $1.60 mark, with a secondary target of $2.60 in play.
Technically, the asset has reclaimed its 200-day moving average — a strong bullish signal that often precedes trend continuation. However, the current volume profile remains below average. For this breakout to be considered valid and sustainable, it must be accompanied by a noticeable surge in volume.
As long as price breaks above the range high with strong volume support, WIF remains poised for significant upside in the coming weeks and months. The overall structure suggests bullish continuation — but volume confirmation will be the key trigger to watch.
Wifusdt potential 8x opportunityWIFUSDT has completed a strong AB=CD harmonic pattern, with price recovering sharply afterward. We plan to enter a long position from the immediate demand area, marked as the buy-back zone on the chart.
The initial target is set at the internal resistance level, followed by the external supply zone. The final target aligns with the 161.8% Fibonacci extension of the pattern.
Share your insights on this setup.

WIFUSDT strong Bullish formationWIFUSDT is currently developing a classic Cup and Handle pattern, with the handle approaching the key neckline resistance zone. The neckline is acting as a strong barrier, and a confirmed breakout above this level is expected to trigger significant bullish momentum.
Target levels are clearly outlined on the chart. Keep a close watch on this setup, it has the potential to accelerate quickly once the breakout is validated.

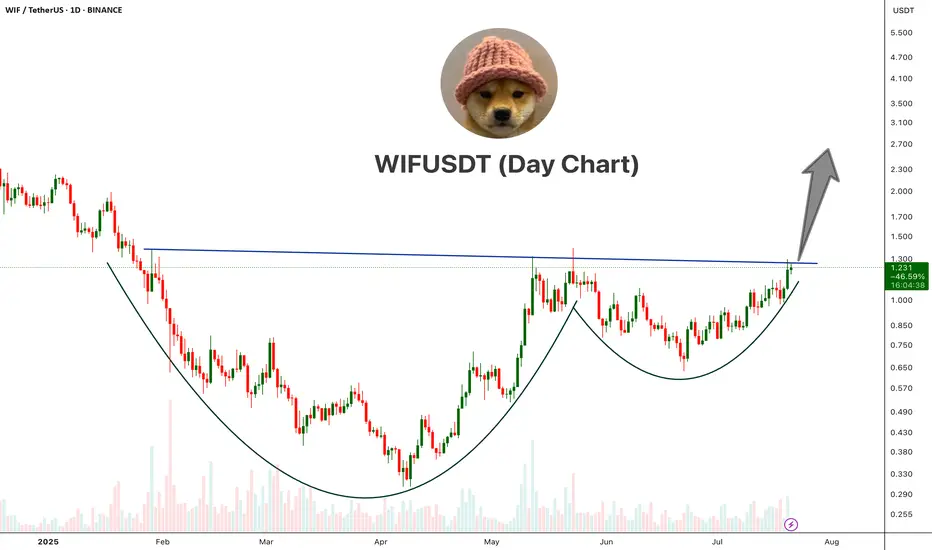
WIFUSDT Cup And Handle PatternWIF is showing a classic Cup and Handle pattern on the daily chart, a strong bullish reversal setup.
The price has broken above the neckline resistance around the $1.25–$1.30 area with bullish momentum. This breakout, if sustained with volume confirmation, could open the doors for a major upside move.
Cheers
Hexa
BINANCE:WIFUSDT
$WIF just gearing for a new ATH! Not expecting much of a retrace on BINANCE:WIFUSDT — more likely we get consolidation against resistance.
This current level is crucial, and likely to form the base for either:
• A new ATH, or
• At minimum, a third retest of the $4.5–5 zone.
The broader market continues to push higher, and with Bitcoin Dominance breaking down, things could get very interesting in the coming months.
📌 Plan:
• Waiting on a clean retrace (as per second entry... previous post)
• Or a reclaim of the purple block to add to the position

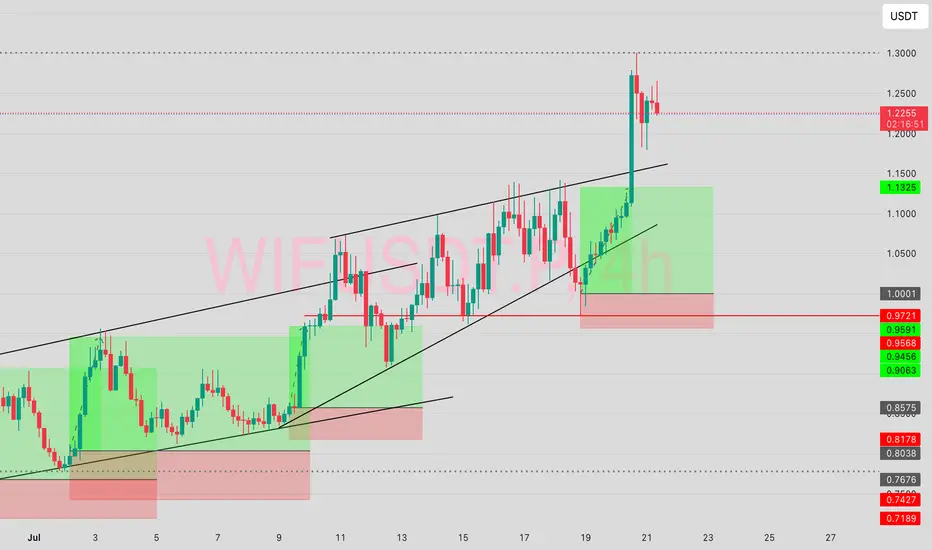
WIF: The Perfect Storm Setup - Ascending Triangle Breakout
📐 Perfect geometric pattern formation
📊 Volume profile supporting the setup
🎯 Clear target zones with minimal resistance
⚡ Compression leading to expansion
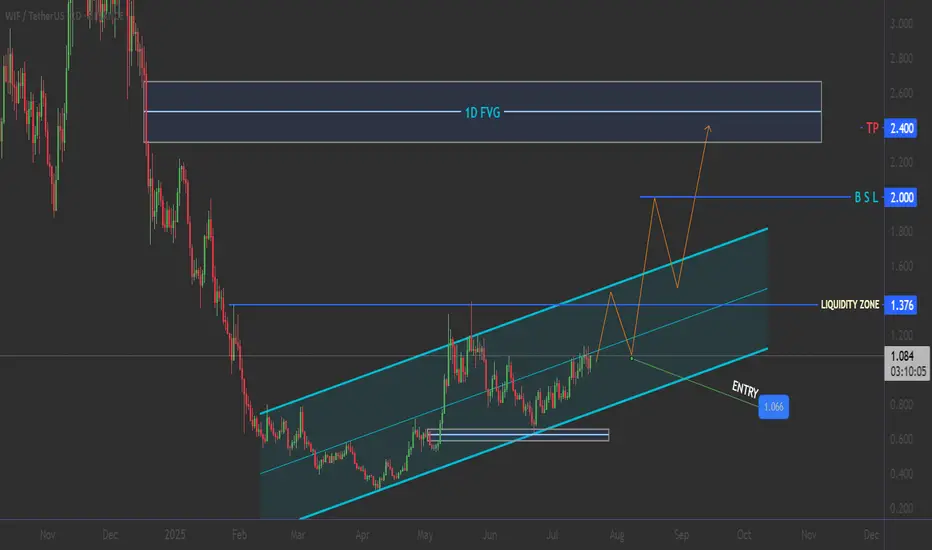
🎯 THE SETUP: Triple Confluence Strategy 🔥
📍 ENTRY ZONE: $1.00 - $1.06
🎯 TARGET 1: $2.000 (+85%)
🎯 TARGET 2: $2.400 (+120%)
🔴 STOP LOSS: $0.95 (-3%)
___________ NOTE ____________
🚨 RISK MANAGEMENT 🚨 DYOR
mega alt-season?Are they making you hope for a mega alt-season? Protect yourself by learning. The amount I specified in the chart is enough for Altseason
Don't be too optimistic about the market

WIFFF your destiny!The patience is a game most fail, here you can get something which u cant expect!
WIFUSDT: Mid-Term AnalysisI know the prices I want are very cheap.
But I believe this market can give me those prices if I’m patient.
Until then, I’m watching calmly. If price comes to my levels, I will look for:
✅ Footprint absorption
✅ CDV support
✅ Structure reclaim for confirmation
If it aligns, I’ll take the trade with clear risk. If not, I’ll keep waiting.
No rush. The right price, or no trade.
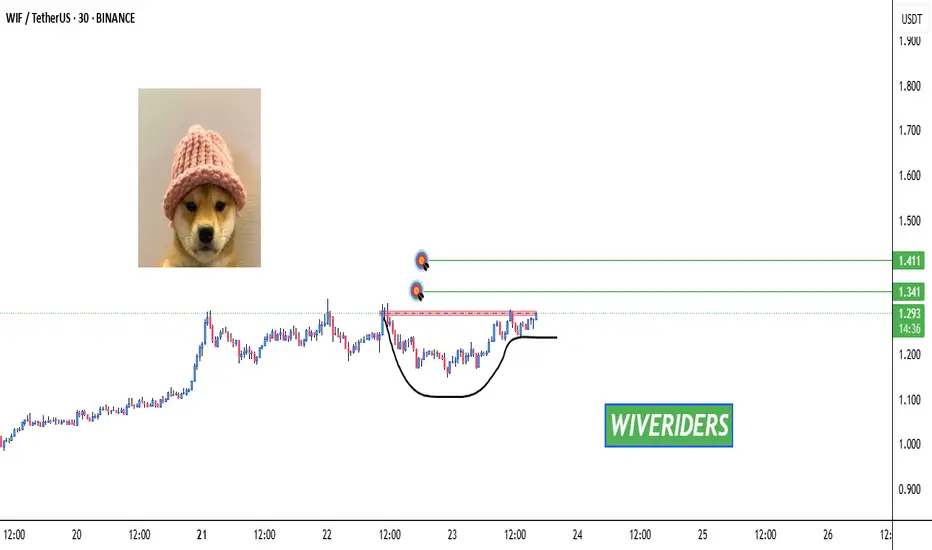
Bullish Cup & Handle Pattern Formed 🚨 SEED_WANDERIN_JIMZIP900:WIF Testing Red Resistance – Bullish Cup & Handle Pattern Formed 📈
SEED_WANDERIN_JIMZIP900:WIF is currently testing the red resistance zone and has formed a bullish cup and handle pattern on the chart.
If a breakout occurs, potential upside toward:
✅ First Target: Green line level
✅ Second Target: Green line level
Wait for breakout confirmation before entering long. 📊
Patience is key—watch this closely! 💼💸
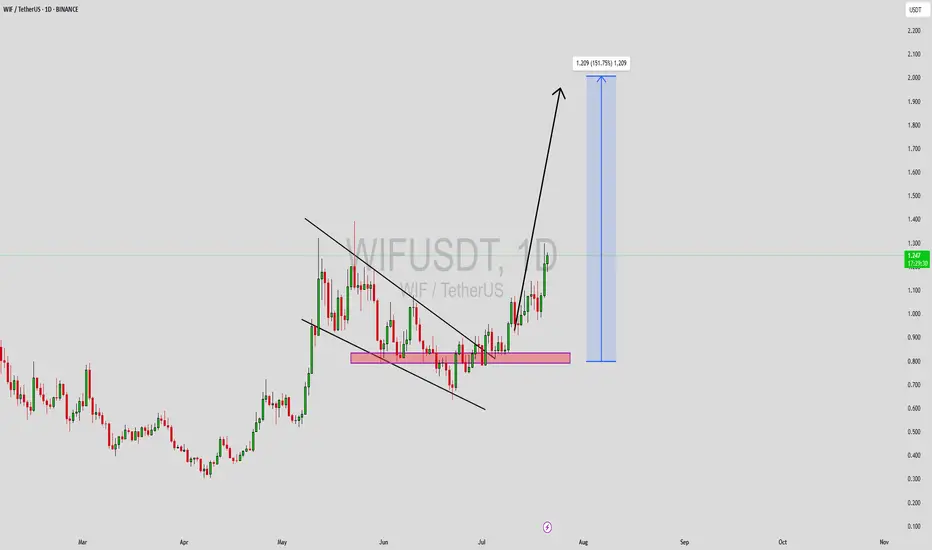
WIFUSDT Forming Descending ChannelWIFUSDT is currently trading within a descending channel pattern, a structure often considered bullish when found in a broader uptrend. This pattern indicates a period of healthy correction and consolidation, which often precedes a breakout move to the upside. With good trading volume and growing interest from the crypto community, WIF may be preparing for a strong reversal. The technical setup suggests a potential gain of 140% to 150%+ upon a confirmed breakout above the upper boundary of the channel.
Dogwifhat (WIF) has garnered significant attention due to its strong meme coin narrative within the Solana ecosystem. As meme tokens continue to attract retail attention, WIF has remained one of the more resilient and talked-about assets in its category. This strong community support, combined with current technical indicators, adds confidence to the bullish case.
The descending channel has allowed price to compress and reset RSI levels, setting the stage for a possible explosive move. If price breaks out with volume, this could mark the beginning of a new bullish wave. Traders should watch for a breakout candle with strong follow-through above recent resistance zones as a key confirmation point.
✅ Show your support by hitting the like button and
✅ Leaving a comment below! (What is You opinion about this Coin)
Your feedback and engagement keep me inspired to share more insightful market analysis with you!
WIF/USDT.p Short term potentialWIF is positioned to explode! It is currently testing the neckline of a perfect cup & handle.

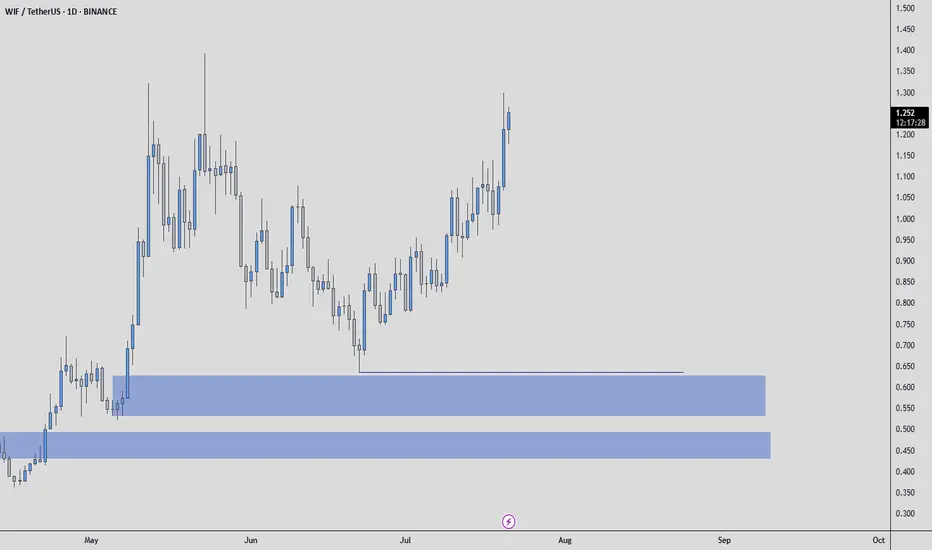
Time to Accumulate $WIF - $1.2 is NextWIF finally showing signs of life.
Starting to build a position below 60c—this looks like an optimal entry given how well it's behaving.
Accumulation zone remains between 40–50c, as long as price holds there.
Targeting the 1.2 area on a break and hold above 65c.
BINANCE:WIFUSDT SEED_WANDERIN_JIMZIP900:WIF
WIF WIF - SMOL SCALPSas showed stays in red box its happy, goes above its gone! Awesome super small scalps

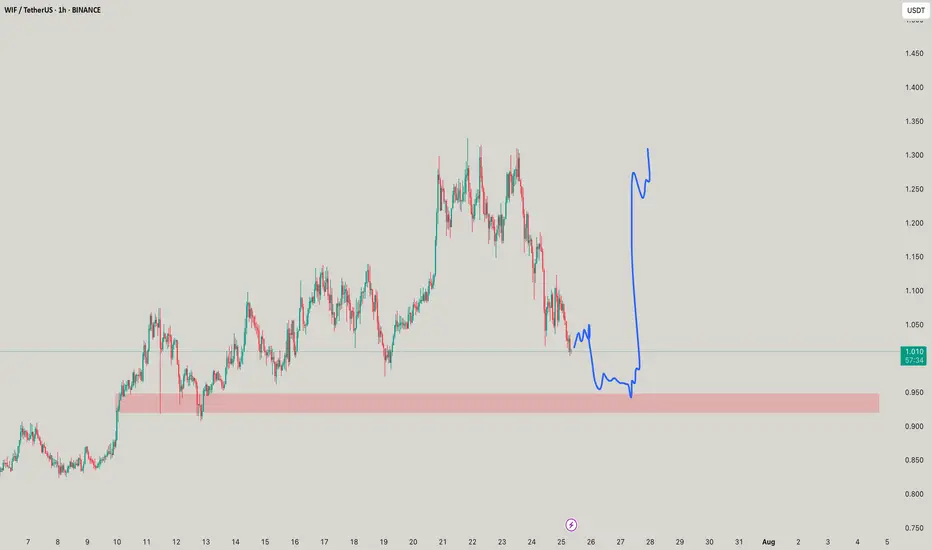
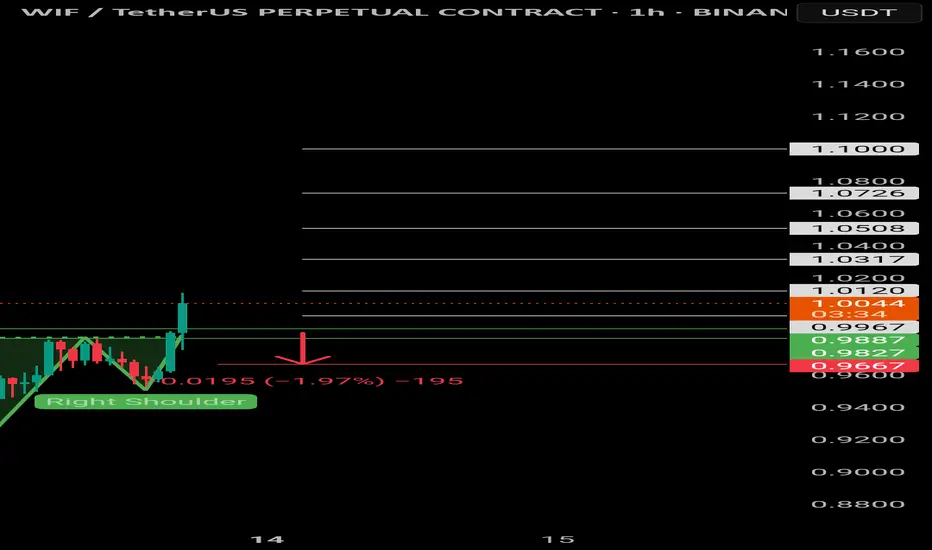
$WIF | Inverted head and shoulders $Wif/Usdt
BINANCE:WIFUSDT.P
The price is formed the Inverted head and shoulders pattern and did a breakout of the neckline, expecting the price to retest green lines (neckline).
If 1H CC hit and bounce above the green lines, it'll be a long opportunity.
Entering at current price will increase the SL, it's suggested to wait for a retest, to have better entry and a good risk management.
Use only 1-2% of your portfolio.
NFA, DYOR
TP:
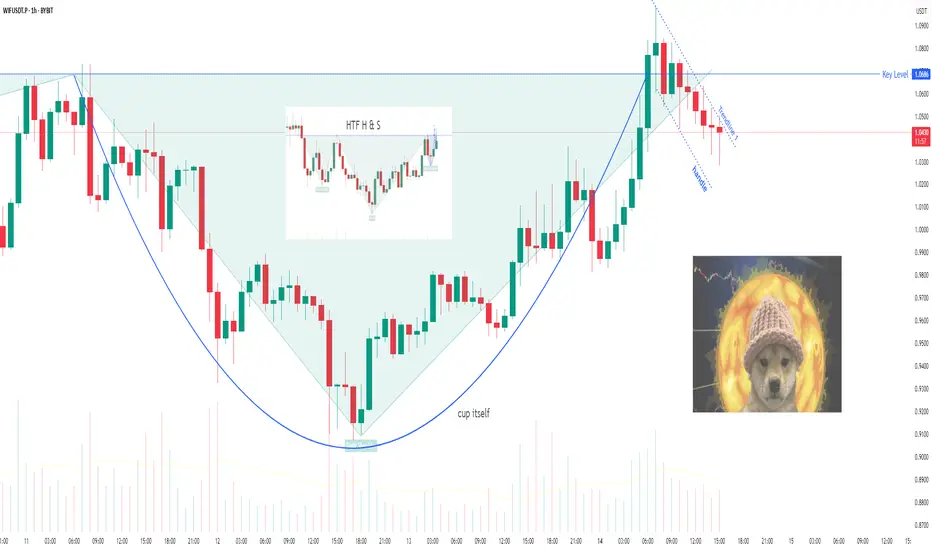
WIF/USDT: Dog back on track?WIF is building a "Cup And Handle" pattern alongside a (hopefully) last trendline, Trendline 1.
That breakout would lead back to the main keylevel, which is also the neckline of a H&S formation on a higher timeframe. To make it even more funny, that H&S is "the handle" of a even bigger cup n handle pattern on the next HTF.
So the break of trendline 1 might bring us to the keylevel, and that might start the H&S being "priced".
Price explosion is coming?Read carefullyhello friends👋
We have come to analyze a popular Kuwaiti meme that you have asked to analyze a lot.
🌟Well, according to the drop we had, it can be seen that the buyers came in and formed a good upward wave, and after that, Femt entered a channel, which can be said to be a flag pattern...🧐
Now, according to the formed channel, we can enter into a purchase transaction with capital and risk management in case of a valid failure of the channel.
🔥Follow us for more signals on Bolran.🔥
*Trade safely with us*

WIFUSDT 1D#WIF has broken above the bull flag and the Ichimoku Cloud on the daily chart.
All eyes are now on the daily EMA200. A breakout above this level could trigger a massive bullish rally.
Targets:
🎯 $1.144
🎯 $1.264
🎯 $1.435
🎯 $1.653
🎯 $1.930
🎯 $2.074
🎯 $2.282
⚠️ Always use a tight stop-loss and apply proper risk management.

$WIF | Bull Flag Continuation Structure Following a textbook bull flag breakout, SEED_WANDERIN_JIMZIP900:WIF has printed a measured impulse leg of +40%, confirming market structure shift and continuation of the prevailing bullish trend.
🔍 Key Technicals:
• High-volume breakout from declining channel
• Flagpole–Consolidation–Breakout sequence complete
• Former resistance flipped into SR flip zone (support)
• Sustained close above trendline confirms trend acceleration
📍 Upside Targets based on Fib extensions & pole projection:
→ $1.30 (0.618 ext)
→ $1.60 (1.0 pole measured move)
→ $1.90 (1.618 ext confluence zone) 🚀
Expect potential bullish retest before expansion. Bias remains long until structural invalidation.

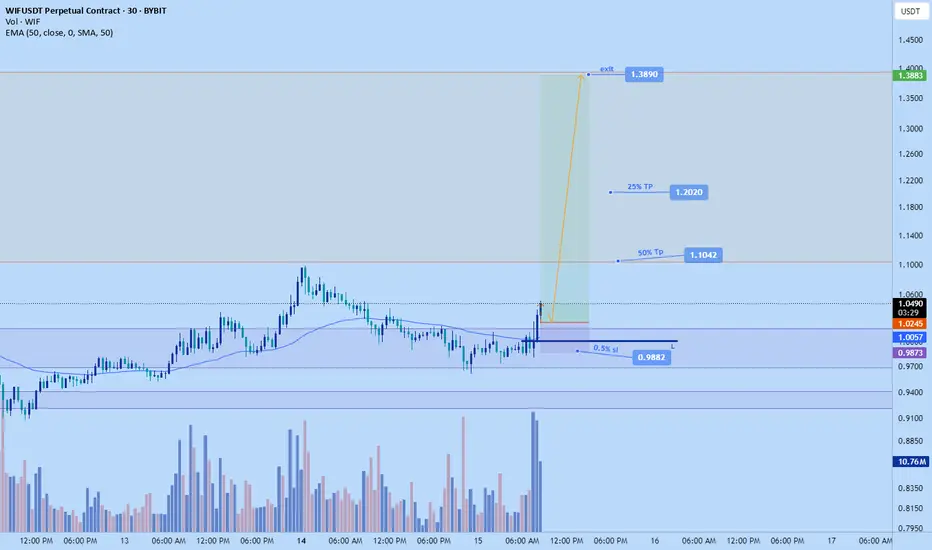
Wif pump to $1.3890Took a long position on wif not too long ago. Based on DTT analysis its gonna rocket soon. If interested it be good if yall could get in on like a 15 min slight wick pullback 1.025 or lower
WIFdogwifhat
WIF is the most famous and capitalised Solana-native meme token.
Everything is clear on the chart.
I wish everyone abundant profits.
Like and follow
for more.

$WIF with CATBYBIT:WIFUSDT.P is probably the pair that has made me the most profit in recent weeks.
I have meticulously followed it to do all its dance since 2-3weeks and its been all amazing.
Here's yet another one with that sort of profit. 1:3RR isn’t that bad, is it?
It’s a WIN!!!!