WIF - One COIN TWO MOVES!SO the moves are for you to be seen, I am as usual saying half things so you come to me and ask whats it hahahha
WIFUST trade ideas
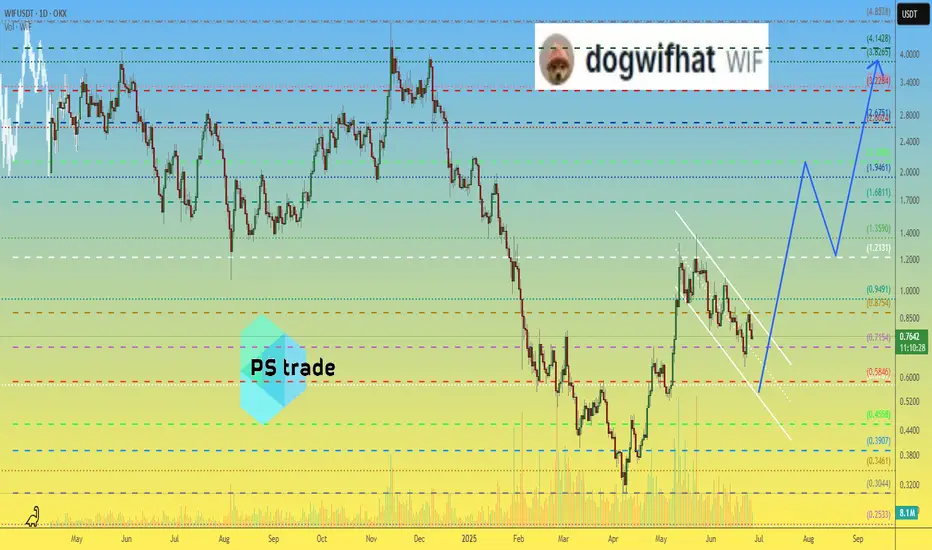
WIF/USDT: A dog wif hat lost faith but may become Pehoenix soon WIF/USDT: A dog wif hat lost faith but may become Pehoenix soon
after a long lasting crash WIF started a decent move again
was heavyly rejected
in consolidation since then
building a "Falling Wedge"
the supposed breakout happend
but there is still way more to come
For this one I'm not going to explain everything in detail what me made find my BIAS, narrative etc.
But at least enough Information that should be "useful" or "work you must not do buy yourself then".
That could be the beginning of a race back to at least baseline or somehow below.
For now, the trade is only planed to TP 1. Also im already in.
I stepped in cuz:
- there are several FVGs on several timeframes. The price is likely to play them out and should than react that way. I followed them and we should be bullish now. One good argument is that the weekly bullish FVG keeps nicely respected, while the bearish monthly FVG is actually struggeling.
- very bullish Price Action on WIF
- the TP from the "Falling Wedge" alone would be 1.3943
So TP1 + 2 got really much conflunce. And 3 as well, tru pressure from the market. Maybe even higher, but im not that far yet.
I closed a WIF trade that evening, did the analysis after that, and just opened it again without trigger :D
But there are triggers and u should use them:
RB 1+2+3
Price Action
pullbacks into FVGs on 1h f.e.
"Hammer" candles with high Volumen
break of structure on a LTF
That was the second Idea i made here ever. So i'm happy you made it that far, thank you.
Also feel free to comment the trade/the writing style, question, whatever.
Sugartongue, and my hunger is still young. But I'll chase lights until the morning comes. And the world is flashing at the window.

$WIFWhen your projections are respected, you feel nothing but joy.
Everyone’s joy as a trader is to spot this good moments and enjoy the ride as much as you can.
A successful trader is one who feasts on his spotted opportunity and milk as much as he can.
This trade presented 3 smooth opportunities so far and we will wait patiently to see what happens next. It could repeat same pattern or breakout. If a breakout occurs, more feasting. If it breaks downward, the sweeter.
#DYOR #NFA

MEW MEW - WIF is here!So yet again a very probable trade to the mark and you see something is better than nothing! The moves as said and marked!

Buy Trade Strategy for WIF: Riding the Meme Coin Momentum ShiftDescription:
This trading idea highlights WIF (Dogwifhat), a meme-based cryptocurrency that has gained widespread attention within the crypto community for its viral branding, strong community support, and notable price movements. Unlike traditional projects, WIF thrives on cultural influence and social engagement, positioning itself within a growing trend of community-driven meme coins that often outperform expectations during market upswings. Its recent listings on major exchanges and rapid increase in trading volume underscore the speculative appeal and momentum behind the token.
Despite its popularity, it’s important to remember that meme coins like WIF carry heightened risks due to their reliance on hype, sentiment, and social media trends rather than fundamental utility or long-term development. Market sentiment can shift quickly, and price volatility is often extreme.
Disclaimer:
This trading idea is for educational purposes only and should not be considered financial advice. Meme coins such as WIF are highly speculative assets and involve a significant risk of capital loss. Always do your own research, assess your financial position carefully, and consult with a qualified advisor before making any investment decisions. Past performance is not indicative of future results.

WIF - The worst meme coin on the market?⚡️ Hello, everyone! Today, I want to talk about a meme coin that many consider to be the worst on the market. Let's find out if this is really the case.
WIF hyped up a lot at the beginning of the cycle. After the first wave of growth, liquidity began to gradually shift to altcoins, including memecoins. At that time, there weren't yet hundreds of thousands of memecoins with pump and dump schemes, and everyone went for the good old DOGE, PEPE, etc.
Against the backdrop of their renewed popularity, WIF appeared. It quickly reached a huge capitalization of several billion dollars. And in the summer, when it seemed that the token was finished, it returned to growth and repeated its ATH.
➡️ Now it has passed another bottom and is trading at less than $1. At the end of June, the price broke through the downward trend, which potentially means a transition to a consolidation phase. Two gaps have formed at the levels of $2.774 - $2.168 and $3.887 - $3.080. And as we know, 99% of gaps close sooner or later.
⚙️ Metrics and indicators:
Money Flow - forms a divergence with the price, and in an unexpected way. After all, during the recent rise to only $1.3, liquidity inflows were at November 2024 levels, when WIF was trading at its ATH!
Support/Resistance - at current levels and below, there is high demand for the token. This could potentially mean that it has finally bottomed out. The nearest major resistance zone is at $1.4.
Liquidity Depth - there is a huge difference in liquidity between the top and bottom. Almost 10 times. Since memecoins are highly speculative due to their volatility, huge positions are opened in the direction of movement with each movement.
And since the price has been falling for a long time, a huge amount of liquidity has accumulated at the top. And as we know, the price moves from one liquidity to another — this is its fuel.
Volume — in fact, sales volumes are gradually decreasing. But they have only recently reached a local peak, and it is too early to judge whether the decline has really begun.
📌 Conclusion:
WIF looks terrible in a vacuum. But if you take a closer look at the chart and understand what is happening, unusual things become apparent.
Demand for the token is still there and it is high. And such a huge amount of liquidity on top of that could easily push the price to a new ATH in the event of growth.
Have a nice day, everyone!

WIFUSDT Forming Breakout Descending ChannelWIFUSDT is showing an exciting technical setup as it breaks free from a prolonged downward channel and consolidates near a strong support zone. This breakout pattern signals that the coin could be on the verge of a significant trend reversal, supported by healthy trading volume and renewed investor confidence. With buyers defending key levels and pushing the price above resistance, WIF is capturing the attention of traders looking for high-momentum plays.
Looking at the chart, WIFUSDT’s recent price action suggests that the base has formed well within the highlighted demand zone, providing a solid foundation for a sharp upward move. The breakout from the descending channel is a classic sign of trend change, and this technical shift is further reinforced by steady volume and bullish sentiment across social platforms. Traders should keep an eye on retests of the breakout zone for potential entry opportunities, as these could offer excellent risk-to-reward setups.
The potential gain of 140% to 150%+ makes WIFUSDT a top pick for those scanning the market for trending coins with breakout potential. The meme coin community remains highly active around WIF, and this fresh surge in interest could propel the coin to test its next major resistance levels in the coming weeks. As always, risk management and closely monitoring price action will be key to riding this bullish wave successfully.
✅ Show your support by hitting the like button and
✅ Leaving a comment below! (What is You opinion about this Coin)
Your feedback and engagement keep me inspired to share more insightful market analysis with you!


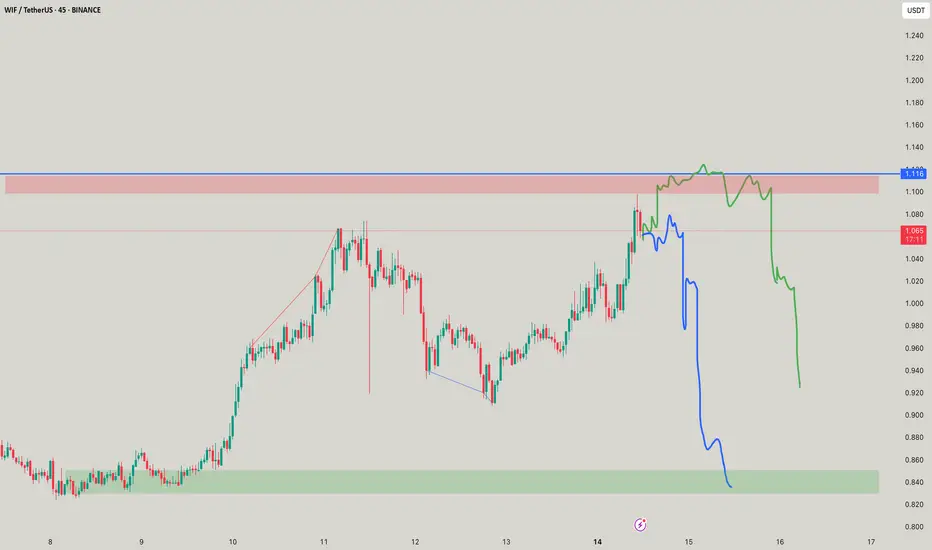
Wif weekend dump to $0.7830I went long on wif last night stopped out now am going short. I realized that the market failed to hold above key levels on higher tf so its unlike that we'll bounce strongly from current price. The strong key levels are below . $0.8050-$0.7830 is a more probable are for the market to fall to test if theres enough demand there to reverse the current downtrend
Stop: $0.84 or higher
Tp1: $0.8020
Tp2: $0.7830
Time sensitive

Wif scalp long to $0.8780Wif long
Stop: $0.8447
Tp: $0.8780
2.5RR aprox.
Time sensitive.
DTT price action strategy applied

$wifadded to this meme
spot no leverage for me since enough to be made without stessing
rsi curling up expecting a recalim as dominace drops
btfd mode on alts for me
this time shall try and wait for dips when i book profits to rotate instead of rotating straight away since we will get lots of "volatilty" for now cheesed off for starting my postion above range high but meh its spot
When the bark is louder than the bid - WIFWIF looks problematic, fall is there, but it would take shorters with them! so wait for that time!

Skeptic | Dogwifhat (WIF): Precision Triggers for Spot & FuturesWelcome, traders, Its Skeptic! 😎 Is Dogwifhat (WIF) the next meme coin rocket or a risky gamble? I’m diving into a pro-level breakdown of WIF, the Solana-based meme coin with a $882.06M market cap, ranked #75 globally. This analysis covers recent performance, ecosystem strengths, and technical triggers for spot and futures trading, grounded in cycle-based strategies. Trade with no FOMO, no hype, just reason. Let’s dissect WIF! 🚖
📰 Recent Performance & Key Events
Dogwifhat (WIF) , a Solana-based meme coin launched in late 2023, trades at 0.886 with a $882.06M market cap, ranking #75 globally. Featuring a Shiba Inu in a pink beanie, it leverages Solana’s high-speed, low-fee blockchain and a deflationary burn mechanism with a 998.9 million token supply. Listed on major exchanges like Binance, KuCoin, and Gate.io, WIF enjoys strong liquidity. In July 2025, it’s up 5.26% in 24 hours and 24.57% over 7 days, with a 24-hour trading volume of $450M. However, it’s down 80.94% from its all-time high of $4.84 (March 31, 2024), reflecting meme coin volatility :)
Technical & Market Position
WIF benefits from Solana’s scalable ecosystem, a hub for DeFi and NFTs, with 160,000+ TPS and low fees, outpacing slower networks. Its community-driven appeal, active on X, Reddit, and Discord, fuels its momentum, with posts highlighting a cult-like following. Compared to Pepe ($4.08B market cap, 456,000+ holders, 37% holding over a year), WIF’s smaller but vocal community shows dedication. However, its lack of real-world utility and reliance on social media hype mirror Pepe’s 25.7% year-to-date drop, raising concerns about sustainability.
Risks : Speculative volatility, pump-and-dump schemes, and dependence on Solana’s performance and social media sentiment make WIF a high-risk bet. Use stop loss to manage swings.
📈 Technical Analysis
Daily Timeframe
The Weekly (HWC) is bearish, entering a major bearish trend after forming a double bottom and breaking support. However, the Daily (MWC) started an uptrend, achieving 350 % growth before correcting to the 0.5 Fibonacci retracement —a healthy correction without breaking the uptrend momentum. Key support zones are $0.635–$0.679 . A break below could resume the Weekly bearish trend, so stay alert.
Spot Trigger (Long): Break above resistance at $ 1.047 , confirmed by a volume surge (ideally 2x the average of the prior 5–7 candles). Volume is critical—technical analysis is an art, not a science, so don’t fixate on exact numbers.
Key Insight: The Daily uptrend holds, but a volume spike is essential to confirm bullish moves and avoid fakeouts.
4-Hour Timeframe (Futures Triggers)
On the 4-hour chart (LWC), for longs:
Trigger: Break of the downward trendline and resistance at $ 0.958 , with volume confirmation (strong volume seen in the prior uptrend leg). Additional confirmation: RSI re-entering overbought.
Shorts: No short trigger currently. Despite the Weekly bearish HWC, the Daily MWC uptrend and strong support at $0.635–$0.679 make shorting illogical. Wait for a support break and MWC turning bearish for a safer short with better R/R.
Pro Tip: Longs are viable with volume and RSI confirmation. Avoid shorts until the MWC aligns bearish to minimize fakeout risk. Always use MAX 1%–2% risk per trade.
Final Vibe Check
This WIF breakdown delivers precise triggers for spot ($1.047) and futures ($0.958 long, no short yet), leveraging cycle-based strategies. With a bearish Weekly but bullish Daily, prioritize volume confirmation to navigate meme coin volatility. Solana’s ecosystem and exchange listings give WIF an edge, but its hype-driven nature demands caution. Want more cycle setups or another pair? Drop it in the comments! If this analysis sharpened your game, hit that boost—it fuels my mission! 😊 Stay disciplined, fam! ✌️
💬 Let’s Talk!
Which WIF trigger are you watching? Share your thoughts in the comments, and let’s crush it together!

$wif got in on that retest
targeting $1.5-$1.8 for now as we pump 7% and reclaim key level
fireworks incoming as for most of the coins
will try and time the cycle and rotate
for now memes , large caps , mid caps then maybe micro cap exposure or get ready to short alts or long bitty for its bounce from range low
am of the mind that dominace has had its run and we for a distribution range which is our alt season ... took only 4 years to materalise so step on the gas people .. then we bleed and wait for 80% correction to buy back in a few years .. this is where i stand so for now time to make it all back and more cycles get more and more interesting so dont be shocked if things moves quicker the same way they make us cry on the way down they should overextend on the way up.. well most of them ! have a nice day people and remove that self doubt yolo
WIF — Accumulation Bounce & FVG Target1. Buy in accumulation range ($0.61–0.78)
2. Confirm entry after bounce/hold
3. Main target: $2.35 (Weekly FVG)
4. Stop: below $0.61 — scenario invalid

WIF will now say Uff!WIF and FART had same patterns but just have got out of the phase on conjunction, little steep moves to the tops then it starts to mend down, observe for momentum and then take a play

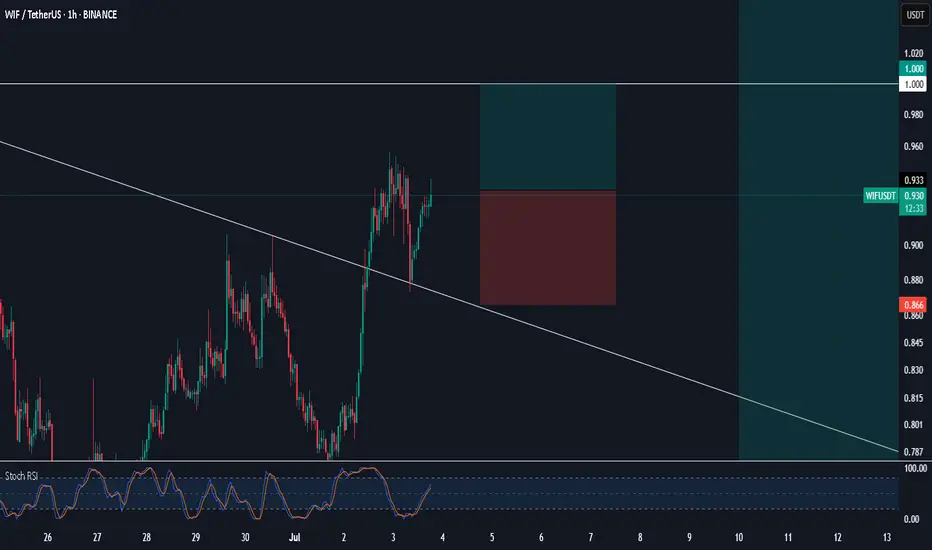
Wif long to $0.93Entered a long trade on wif just now.
anticipating another impulsive break to the upside before End of day similar to yesterday.
Stop: $0.8510
Tp: $0.93
2RR, Might scale in. Might not.
Time sensitive.

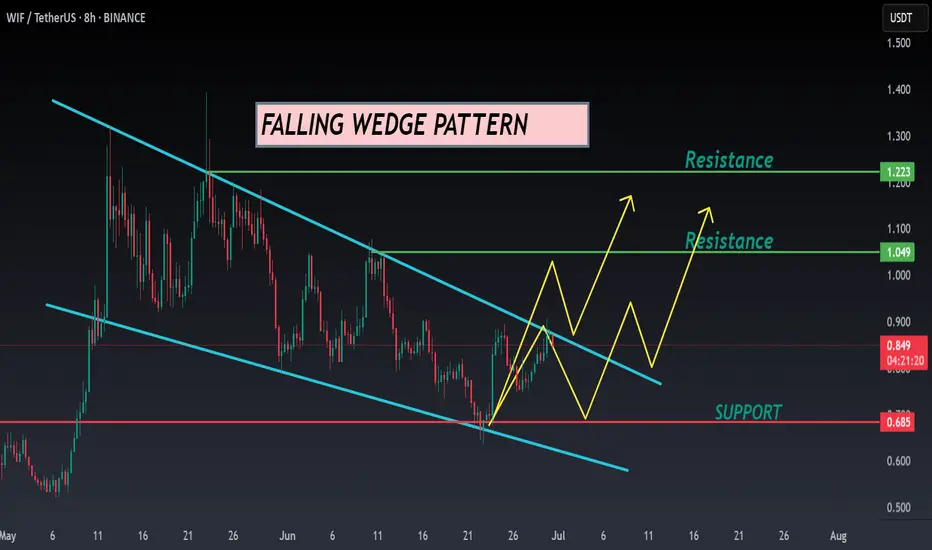
WIF ANALYSIS🔮 #WIF Analysis - Update 🚀🚀
💲 We can see that there is a formation of Falling Wedge Wedge Pattern in #WIF and we can see a bullish movement after a good breakout. Before that we would see a little retest and and then a bullish movement.
💸Current Price -- $0.848
📈Target Price -- $1.049
⁉️ What to do?
- We have marked crucial levels in the chart . We can trade according to the chart and make some profits. 🚀💸
#WIF #Cryptocurrency #Breakout #DYOR
WIF - MAKE or BReak?Okay make or break area, most likely make, looks promising for another move unless bTC slips out of hand

WIF/USDT – Major Breakout Incoming! Potential Upside Over +400%!Technical Analysis:
The WIF/USDT (dogwifhat / Tether) pair on the 1D timeframe is currently showing signs of a bullish breakout from a well-defined descending channel that has formed over the past few months.
📌 Key Highlights:
Price has been consolidating within a descending channel since March 2025.
It is now attempting to break out above the upper boundary of the channel – a strong bullish signal.
The breakout is forming after a strong bounce from the $0.70–$0.75 support zone, indicating accumulation and potential trend reversal.
📈 Resistance Levels (Target Zones):
1. $1.0251 – first key resistance to watch.
2. $1.2008 – minor resistance, ideal short-term target post-breakout.
3. $1.8468 – major historical resistance level.
4. $2.1772 – key psychological and technical level.
5. $2.9503 – extended bullish target.
6. $4.1525 – maximum bullish projection in case of parabolic move.
📉 Support Levels:
$0.8627 – current price level.
$0.70–$0.75 – previous strong support zone and lower channel base.
📊 Strategy Insight:
A potential entry could be considered on a confirmed breakout and retest around $1.02.
Targets can be scaled based on resistance levels mentioned above.
Use proper risk management and stop-loss below the channel to avoid fakeouts.
Conclusion:
WIF/USDT is showing a strong bullish reversal structure, breaking out from a mid-term descending pattern. This could be the beginning of a massive upward impulse, with over +400% potential gain if key targets are reached. A critical moment for traders and investors to pay attention!
#WIFUSDT #WIFBreakout #CryptoAnalysis #AltcoinSeason #Dogwifhat #BullishSetup #BreakoutAlert #CryptoTrading #CryptoSignals #WIFArmy

Wif pump to $0.9Just now opened a long position on Wif. Last 4hr candle just close and am anticipating a push back up before day end as market failed to close back below prior resistance suggesting demand is still strong in this area, bulls are using it as support, at least that's how I interpret it.
It's bullish on the daily tf and likely will attempt to push towards make a new daily HH soon around my first tp area. I didn't wait for ideal confirmation as I think the price is low enough. And I have relatively good invalidation stop at current price with good RR.
Let's see if the odds play out in my favor. All the best if you following along.

dogwifhat WIF price analysis🤪 "They" are trying to breathe "new life" into #WIF . And if they manage to keep the price of OKX:WIFUSDT above $0.55, this plan will have a chance of success.
So what do we have:
◆ #WIF holders need to keep their fingers crossed that everything will work out and there will soon be growth, and with it a chance to get out of a prolonged "draw fall"
◆ Traders need to wait for confirmation that the price of #WIFUSD is holding steady above $0,55.
And no large trading leverage, because this is a fairly volatile meme coin, even x5 leverage, which allows for a -19% error, or x3, which forgives a “miss” of -32% from the entry point, can liquidate your deposit when trading volatile assets.
⁉️ Do you believe that the price of #dogwifhat can still return to the $4 range with a corresponding project capitalization of $4 billion?
_____________________
Did you like our analysis? Leave a comment, like, and follow to get more
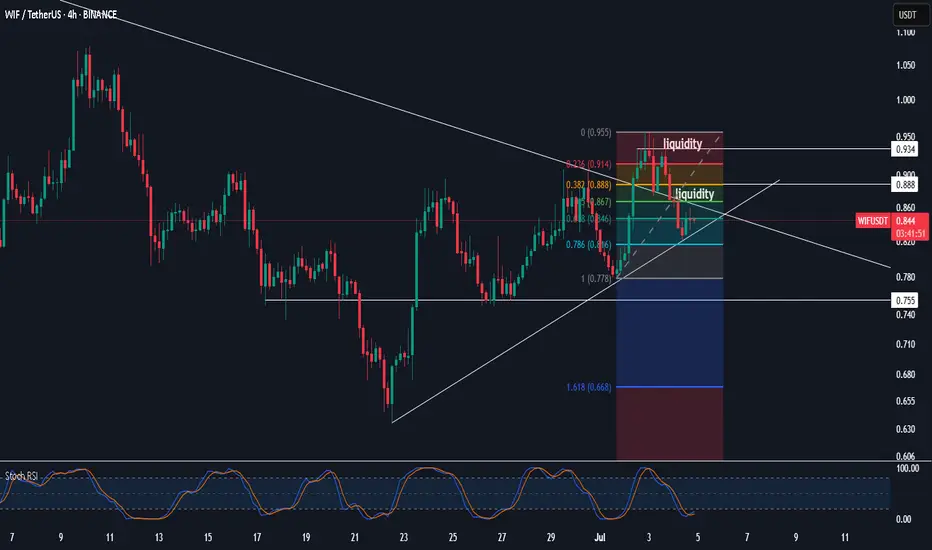
WIFUSDT TIMEFRAME 4HWIF (Dogwifhat) Time frame 4H - Just swept the upper liquidity,
It’s now heading down to target lower liquidity.
Potential entry zone (OTE): between $0.73 and $0.68
Stop-loss: below $0.62, under the liquidity zone
Targets:
TP1: $0.85
TP2: $0.905 (previous liquidity sweep area)
TP3 : $1.059
TP4 : $1.10
⚠️ Macro caution: a single tweet from Trump could invalidate the setup.
❗ This is not financial advice — just a trade idea based on current market structure.
