$WLD Trade Setup MIL:WLD Trade Setup
Breakout above the trendline, strong support hold.
- Entry: $1.408 - CMP
- SL: $1.3501
- Target: $1.6490
Already in the trade, let’s see how it plays out.
DYRO, NFA
WLDUSDT trade ideas

WLD Price Compression Near Key Support – Watch June 3–5 for Move📊 WLD/USDT – Reversal Zone & Time Projection Analysis by AngleTrader
Timeframe: 2H
Method: Gann Trend Lines | Rectangles (Reversal Zones) | Time Cycles
🔍 Idea Summary:
Price is currently in a corrective downtrend channel marked by two orange descending trend lines.
Several breakout-based reversal zones (red rectangles) have been highlighted from prior breakout levels.
A multi-touch consolidation is happening near the lower orange trend line, indicating indecision.
Time cycle lines (blue verticals) suggest upcoming volatility windows between June 3 and June 5, aligning with a potential reversal.
🔻 Bearish Scenario:
Price may break down through the current support range.
Watch the high-probability demand zone:
0.943 – 0.982 USDT
(Marked by thick red/black rectangles)
This zone aligns with a trendline intersection and past accumulation.
🔺 Bullish Scenario:
If price respects the lower support zone and reacts strongly with volume,
Expect a reversal breakout above the descending channel, targeting:
1.25 – 1.40 USDT in the next leg.
📅 Key Dates to Watch:
June 3–5, 2025 – Major time confluence.
Reversal or breakout is likely around these dates.
⚠️ Notes:
This setup uses no indicators, just pure structure, Gann angles, and price behavior.
Wait for confirmation from price action within the demand zone

WLD (Worldcoin) – Long Spot Trade Setup After 180% RallyAfter a massive 180% surge, WLD is showing signs of exhaustion and is likely to retrace toward the next major support zone. A pullback into the $1.22 – $1.35 area provides a favorable entry opportunity for continuation of the trend, assuming support holds.
🔹 Entry Zone (Support):
$1.22 – $1.35
🎯 Take Profit Targets:
🥇 $1.65 – $1.85 (prior consolidation and resistance zone)
🥈 $2.40 – $2.65 (upper range resistance / extension target)
🛑 Stop Loss:
Just below $1.10 (below structural support and invalidation level)

is WLD READY FOR NEW CYCLE to $4Worldcoin looks to have new data, which could mean a new cycle is on processing.
Low time frame focus target $1,70

where to buy ?Hello friends
Given the good growth of this currency, we are witnessing a price correction and this is an opportunity to buy in the price correction in the support areas and move with it to the specified goals, of course with capital and risk management.
*Trade safely with us*


#WLD/USDT#WLD
The price is moving within a descending channel on the 1-hour frame, adhering well to it, and is heading for a strong breakout and retest.
We are experiencing a rebound from the lower boundary of the descending channel, which is support at 1.08.
We are experiencing a downtrend on the RSI indicator, which is about to break and retest, supporting the upward trend.
We are looking for stability above the 100 moving average.
Entry price: 1.143
First target: 1.190
Second target: 1.236
Third target: 1.300

Worldcoin —Advanced Trading Tips For Maximum Profits In 2025Notice the corrections!
Worldcoin is trading above its September 2023 low after a classic rounded bottom pattern. Notice the corrections.
Back in 2023, WLDUSDT produced the "initial bullish breakout" as I like to call it. From September until December 2023. Then a three months correction developed. This correction ended in a higher low and was followed by massive growth. That's exactly what we should expect this time around but many times bigger, ok?
Do we agree?
Ok! Let's look at it again but now focused on the present day.
Worldcoin (WLDUSDT) will produce a strong bullish wave but this would still be only the first wave, the "initial bullish breakout." This wave will be corrected and this correction can last several months. It will end in a higher low and this higher low will produce a bull run. Makes sense?
I am preparing you for what is about to happen. If you are prepared, you can better engage the market. You can make better decisions and better decisions can translate into higher profits. It can be life changing for sure.
Choose wisely. Some Altcoins will grow more than others, some will stay behind.
Take your time to choose. The market is not going away.
There will be winners and losers.
Those that trade at the bottom, with the condition of being a solid project, have higher potential for growth.
If you are coming from TA only perspective, like yours truly, then you know the solid projects are the ones with the big names and those available for trading everywhere.
Your support is highly appreciated.
Namaste.

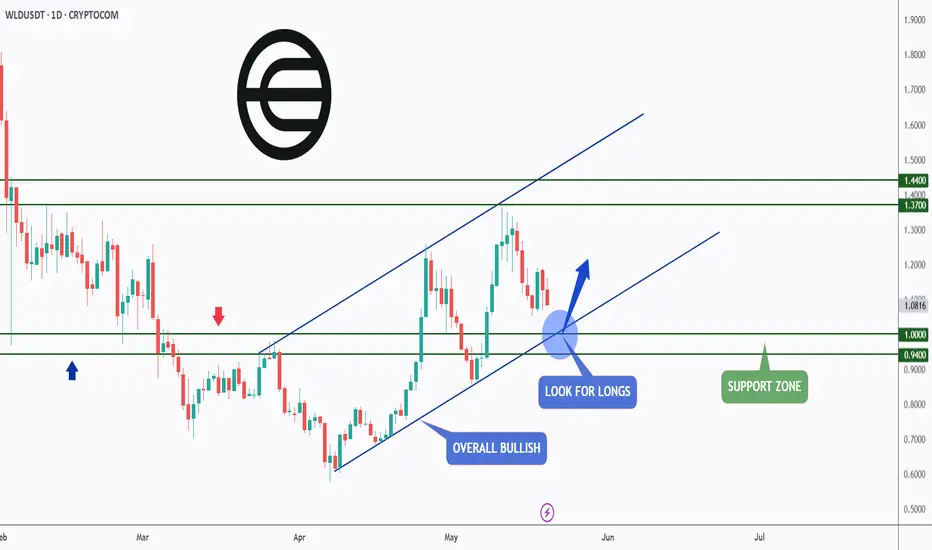
WLD - AI Cycle Is Back!Hello TradingView Family / Fellow Traders. This is Richard, also known as theSignalyst.
📈WLD has been in a correction phase. However it is still overall bullish long-term trading within the rising channel marked in blue.
Moreover, the green zone is a strong support and round number $1.
🏹 Thus, the highlighted blue circle is a strong area to look for buy setups as it is the intersection of support and lower blue trendline acting non-horizontal support.
📚 As per my trading style:
As #WLD retests the blue circle zone, I will be looking for bullish reversal setups (like a double bottom pattern, trendline break , and so on...)
📚 Always follow your trading plan regarding entry, risk management, and trade management.
Good luck!
All Strategies Are Good; If Managed Properly!
~Rich
WLDUSDT – Breakout Confirmed, Eyes on $1.78 and Higher📈🌐 WLDUSDT – Breakout Confirmed, Eyes on $1.78 and Higher 🚀🧠
WLD continues to deliver clean technical setups—and yesterday’s breakout gave us a perfect new entry at the base of this rising channel. This update builds on the same structure I’ve been tracking since early May, now reinforced by both fundamentals and price action.
🔍 Technical Outlook:
📌 New Support Zones:
$1.0633
$1.4185
📌 Next Targets:
🎯 Target 1 – $1.7827
🎯 Target 2 – $2.5275
and then if the markets help we can dream for:
🎯 Target 3 – $3.5074
🎯 Target 4 – $5.0708
🎯 Target 5 – $8.6900
🎯 Target 6 – Upper extension (long-term trajectory toward $16+)
The structure follows the classic market rhythm:
1️⃣ Falling Channel Breakdown
2️⃣ First Re-Entry with Support Reclaim
3️⃣ Perfect Flag Retest → New Rally Begins
🧠 Why WLD?
One of Leading Layer 2 inflows last week across all chains
Expanding ecosystem with real-world apps:
🎮 Humans vs AI
🏨 Hotels Cryptorefills
👤 Human Actions (identity layer tech)
And many many more.
Worldcoin’s biometric World ID system continues expanding in the US and Asia—bringing new users into the WLD economy
⚠️ Note: WLD is a high-volatility, speculative asset. Trade setups like this follow strong momentum patterns—but always manage risk and respect invalidation levels.
One Love,
The FXPROFESSOR 💙

WLD's situation+ Target PredictionThe BINANCE:WLDUSDT is in a Bullish phase by a Falling Wedge Pattern.
A falling wedge indicates the potential for price to reach to $3.
Note if the Wedge Pattern is broken downwards with the strength of Bearish candles , this analysis of ours will be failed.
Give me some energy !!
✨We spend hours finding potential opportunities and writing useful ideas, we would be happy if you support us.
Best regards CobraVanguard.💚
_ _ _ _ __ _ _ _ _ _ _ _ _ _ _ _ _ _ _ _ _ _ _ _ _ _ _ _ _ _ _ _
✅Thank you, and for more ideas, hit ❤️Like❤️ and 🌟Follow🌟!
⚠️Things can change...
The markets are always changing and even with all these signals, the market changes tend to be strong and fast!!

WLDUSDTmy entry on this trade idea is taken from a point of interest below an inducement (X).. I extended my stoploss area to cover for the whole swing as price can target the liquidity there before going as I anticipate.. just a trade idea, not financial advise
Entry; $0.932
Take Profit; $1.229
Stop Loss; $0.835

WLD/USDT Analysis – Long Setup
The situation for this coin is similar to Bitcoin. We've also reached a key buying zone at $1.47–$1.375, and an initial buying reaction has already occurred.
Potential – retesting the current high.
This publication is not financial advice.

$WLD Price Update The downtrend continues, but we’re seeing signs of a potential bounce! 🚀
RSI at 32.15 approaching oversold levels!
Price hitting the bottom trendline of the descending channel.
Possible reversal to $2.20
Could this be the breakout we've been waiting for? 👀

WLD - UPDATEGood Morning,
Strong bullish momentum again today. Volume is trending higher, look for a slight rejection at the resistance zone but anticipating a quick drop and climb back up to break through it.
Enjoy!

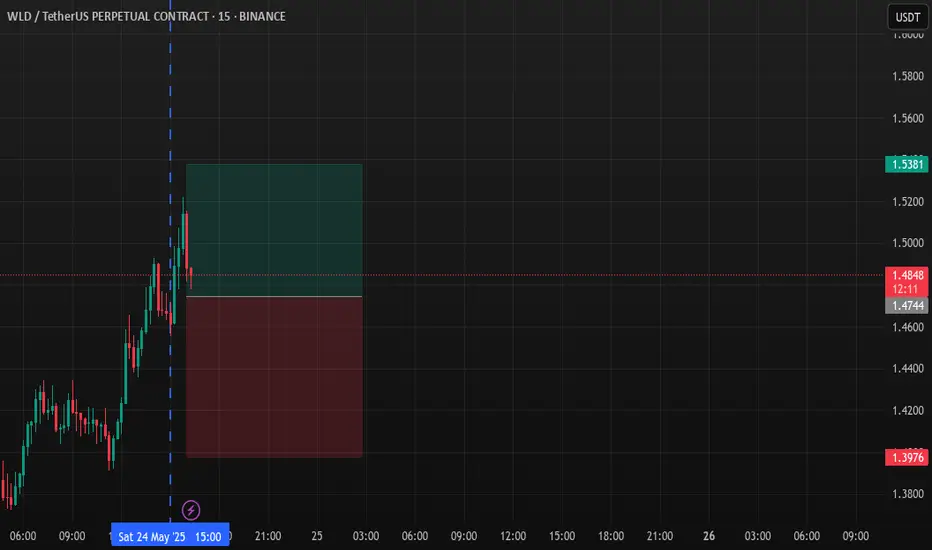
WLD – Long Idea (15M)A similar long opportunity on WLD, confirmed by my Fibbo Time Levels strategy. The timing window suggests a bullish shift, supported by recent price action.
📌 Timeframe: 15M
🎯 Target & SL: Marked on the chart
⏳ Confidence: Strong time-based signal
WLDUSDTmy entry on this trade idea is taken from a point of interest above an inducement (X).. I extended my stoploss area to cover for the whole swing as price can target the liquidity there before going as I anticipate.. just a trade idea, not financial advise
Entry; $1.407
Take Profit; $1.216
Stop Loss; $1.467

#WLD/USDT#WLD
The price is moving within a descending channel on the 1-hour frame and is expected to break and continue upward.
We have a trend to stabilize above the 100 moving average once again.
We have a downtrend on the RSI indicator that supports the upward move with a breakout.
We have a support area at the lower limit of the channel at 0.410, acting as strong support from which the price can rebound.
Entry price: 0.500
First target: 1.568
Second target: 1.691
Third target: 1.818

#WLD/USDT#WLD
The price is moving within a descending channel on the 1-hour frame, adhering well to it, and is heading for a strong breakout and retest.
We are experiencing a rebound from the lower boundary of the descending channel, which is support at 1.18.
We are experiencing a downtrend on the RSI indicator that is about to be broken and retested, supporting the upward trend.
We are looking for stability above the 100 moving average.
Entry price: 1.26
First target: 1.316
Second target: 1.36
Third target: 1.408


WLD FbuyCheck the beauty of our Fbuy Print, how accurate and how precise. This alt season you will rock with 7-star Trading view indicator.
For indicator access, you can contact me.
D Y O R

#WLD/USDT#WLD
The price is moving within a descending channel on the 1-hour frame, adhering well to it, and is heading for a strong breakout and retest.
We are experiencing a rebound from the lower boundary of the descending channel, which is support at 1.03.
We are experiencing a downtrend on the RSI indicator, which is about to break and retest, supporting the upward trend.
We are looking for stability above the 100 Moving Average.
Entry price: 1.12
First target: 1.15
Second target: 1.19
Third target: 1.250

1.43 RR tradeIf WLD keeps coming down and eventually hits the entry, this could be an OK trade. A bit risky since long-term target already hit on top. If there's a move up before entry is hit, cancel the trade.
