WLD may aim to 2.30$Wld is new coin for us but i can say that he has very sharp bar. Still no sign about turning to positive. Falling wedge can still on. in my opinion,sooner or later this token will aim 2.30.
* there is no clear sign
* this is my expectation
WLDUSDT trade ideas

WLD - LONG SetupIf WLD can hold on to the support and BTC continues to move upwards, I expect WLD to hold on to this support.

Here is WLD Ai 50% Move Here is Wld Ai basis project 50% move
Analysis on Chart check out wait for proper breakout or breakdown

WLD FORMING H&S PATTERN 😎↘️😎↘️😎↘️Hi dear traders
The price has formed the H&S pattern.
Now for confirmation, the price has made a pullback at the neckline.
Now we can open short position with suitable R/R.
Let's see what happens
This is not financial advice ( DYOR )
Good luck

Sell in resistance (WLD)❤️❤️Thanks for boosting 🚀 and supporting us!
📈change trend on high renge for seel by big down-candle.
📊 (-sell) : 2.412 $
🔴 Stop Loss : 2.617 $
🎯 Take Profit : 2.185 - 1.896 $
🔗 For more communication with us, send a message in TradingView.

WLD/usdt playoutWLD one of good project among new crypto currency start lately , day by day showing more use case and in developing , chart showing nice cup and handle pattern 90% of pattern completed so far waiting to retrace to 1.95-2$ to start DCA and ride position with potential 80-90% from entry zone
DYOR

Step back to go up higher | Long BiasOn 4H TF
World Coin is moving down to #SupportZone around $2,2 that level is Golden Ratio and BINANCE:WLDUSDT has tested twice.
So this time, I think WLD will bounce back one more time.
Time will tell

WLD ANALYSIS (4H TF)Not much data is available but a diametric pattern appears to be forming. It can go down for the F wave and then go up for the G wave We specified the targets. Don't forget to set stop loss and capital management

$WLD Long - Swing TradeMIL:WLD Long | Type of Trade SWING
Find your retracement entries, WILD has broken and confirmed a resistance level. Next course of action for MIL:WLD now is to retrace its previous resistance level and now will become its support....
Ideal Partial Entry Areas
2.588
2.642
2.698
Expected TP Areas
2.956
3.082
3.286
This is not a financial advise, always use BTC as your confluence when trading.

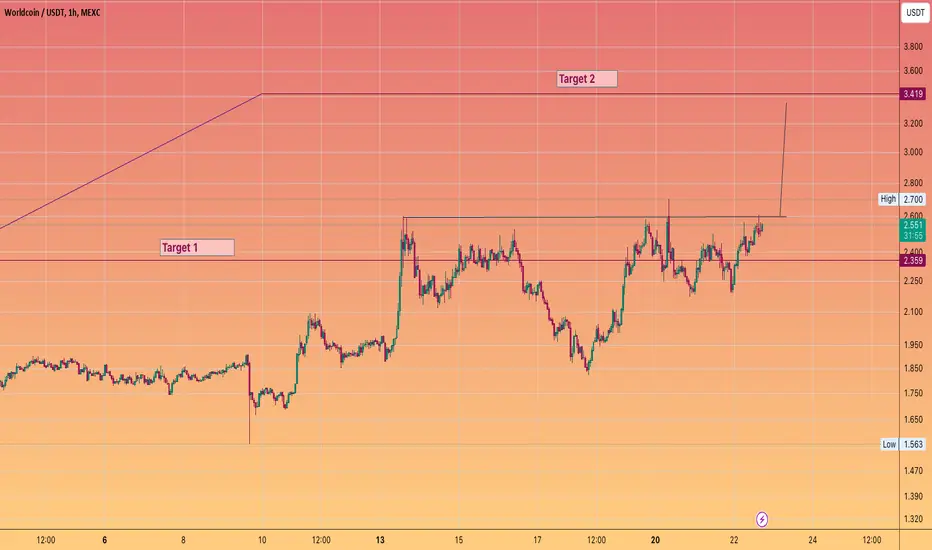
WORLDCOIN #WLD Trade Update .. ready to push onto Target 2Inverse Head & Shoulders
depending how u draw the neckline
we are approaching a breakout
and the run should take us home to Target 2
(see my original idea on this coin)
5$ comes.. WLDI like this new coin. It has surpassed resistance and is heading towards a new all-time high (ATH). Considering getting in. We'll see at $5.

WLD/USDT: Wild trade for WorldCoinWLD is about to breakout from one of its strong resistance line. This breakout will fuel sudden surge in the price for WLC.
We can also see multiple LH (lower highs) and forming the strong support level for BINANCE:WLDUSDT
Entry Price: 2.6
Stoploss: 2.483
TP1: 2.785
TP2: 3.00
TP3: 3.127
TP4: 3.278
We will update this post when we enter the trade. Stay tuned for breakout confirmation.
Like and share your thoughts in the comments
Cheers
GreenCrypto

🔥 WLD Bullish Triangle Break Out: Watch Out Bears!WLD saw a huge sell-off after the initial launch on Binance, but has recovered all the losses since then.
In my eyes, the next stop is going to be the Binance launch high around 5.25$, which we could reach within a couple of weeks really.
The bullish triangle has been broken on the top side, I'm expecting more bullishness to reach WLD in the near future.

#WLD Price Discovery Mood#WLD Trying to break ATH.
Flip here and the price discovery mood will start
WLD 👁️I'm out but long on leverage🛩️ALTMAN + CTRL + DEL... Or World Income ? 👁️
This is a first time that:
👍I like the potential and tempted to buy
⛔ I don't like the idea and not going to buy
WLD:
''The mission of the Worldcoin project is to build the world’s largest identity and financial network as a public utility, giving ownership to everyone. A key component of the Worldcoin project is the development of the foundational infrastructure that will be important for a world where AI plays an increasingly large role.''
Worldcoin, co-founded by Sam Altman and Alex Blania, aims to create a global digital identity and financial network using blockchain. The project uses iris scans to provide a unique digital identity, called World ID, through their World App. Despite attracting significant investment the project has faces controversies over privacy and data collection concerns.
Time to decide if you want to enter into the Matrix
WEF+Altman: www.weforum.org
One Love,
The FXPROFESSOR🧝
ps. It is all a social experiment.. it will fail

altman wins wld routeSam Altman has proven to be a leader in the field of artificial intelligence. Now we will see how his flagship project, the icing on the cake, the revolutionary redistribution mechanism behaves. Investors watch from the podium and speculation must proceed on behalf of Altman. His power structure has never been stronger; watch how he sets a precedent in the corporate structure. Now the one in charge is the one who achieves it, money no longer matters, especially when we talk about AGI.
We will soon see that my prediction is that AGI will become an imminent possibility to begin deploying in 2025-2027. This will be an interesting, dangerous, and different era of transition from all previous ones. We will see unprecedented changes in the structure of human reality. Do not be late accordingly, even if you do not like it or think in an obtuse manner, these AI subjects will get their place, whether by good means or bad.
Disclaimer: these are my opinions and market concepts, not direct or indirect investment advice.

WLDUSDTWLDUSDT is in bulllish trend.
Potentially printing HH and HL.
No sign of reversal here.
We buy at CMP

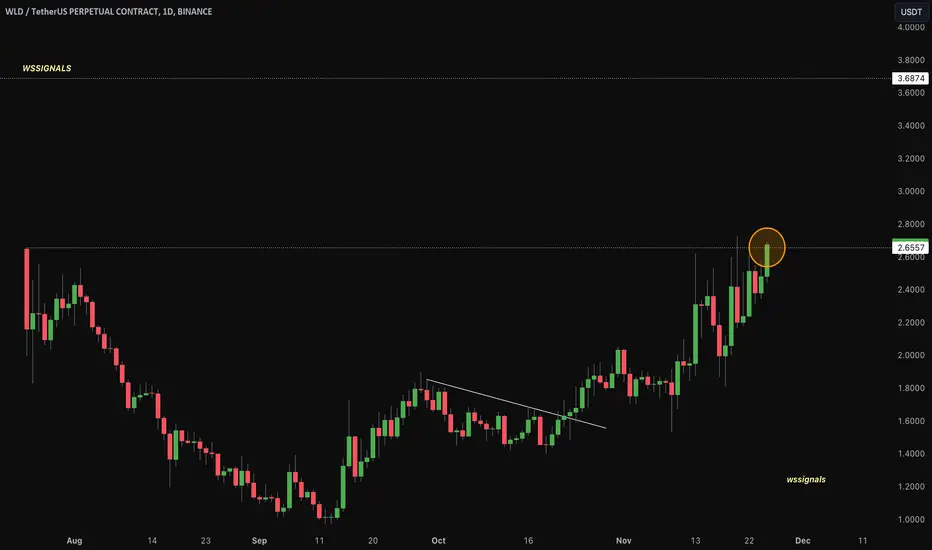
Worldcoin (WLD) surges by over 6% as Sam Altman rejoins OpenAISam Altman has returned to OpenAI as CEO, causing a ripple effect that includes Worldcoin, a crypto he co-founded.
Altman’s return results in significant changes to OpenAI’s board, including strategic collaborations and renewed optimism for the future.
On November 22, OpenAI officially announced the rehiring of Sam Altman as CEO, marking a watershed moment for the organization.
Altman’s return is accompanied by changes to the board structure, including the appointment of Bret Taylor as Chairman and the inclusion of influential figures such as Larry Summers and Adam D’Angelo.
The board reshuffle is in response to the changing dynamics in the AI industry. Altman’s ambitious approach to AI development is said to have clashed with the board’s conservative stance, leading to his previous firing. The new board makeup reflects a strategic alignment with OpenAI’s future vision.
Altman expressed his enthusiasm for his return to OpenAI and emphasized the collaborative efforts with Microsoft. This collaboration is expected to bring new perspectives and synergies that will help to shape the future of AI innovation.
Altman’s reappearance has heightened interest in Worldcoin, the crypto he co-founded. Following the announcement, the price of Worldcoin increased from $2.199 to $2.85.
This price increase reflects investors’ confidence and optimism in the crypto’s potential, indicating that it will perform well in the future. The price of Worldcoin has changed dramatically in the last 24 hours. After reaching $2.85, there was a slight correction that brought the price down to $2.55.
Despite this minor dip, the overall mood remains upbeat, with high expectations for Worldcoin’s growth and stability.

1The crypto market is experiencing a bullish momentum, as more institutional investors and mainstream adoption are driving the demand for digital assets. Bitcoin, the largest cryptocurrency by market capitalization, has reached a new all-time high of over $75,000, breaking the previous record set in April 2021. Ethereum, the second-largest cryptocurrency, has also surged to a new high of over $4,500, as the network prepares for a major upgrade that will improve its scalability and efficiency. Other altcoins, such as Cardano, Solana, and Polkadot, have also performed well, as they offer innovative solutions for decentralized applications and smart contracts.
However, the crypto market is also facing some challenges and risks, such as regulatory uncertainty, cyberattacks, environmental concerns, and volatility. Some countries, such as China and India, have imposed strict restrictions or bans on crypto activities, creating legal and operational hurdles for crypto users and businesses. Moreover, the crypto space is vulnerable to hacking and theft, as several incidents have shown in the past. Additionally, some critics have raised questions about the environmental impact of crypto mining, which consumes a lot of energy and generates carbon emissions. Furthermore, the crypto market is highly volatile and unpredictable, as prices can fluctuate significantly in a short period of time due to various factors, such as supply and demand, news, sentiment, and speculation.
Therefore, the crypto market is a dynamic and complex field that requires careful analysis and research before making any investment decisions. Crypto investors and traders should be aware of the potential rewards and risks of the market, and diversify their portfolio to reduce their exposure to any single asset or event. Crypto enthusiasts and innovators should also keep an eye on the latest developments and trends in the industry, and explore new opportunities and challenges that the crypto space offers.

WLD MAPMapped out WLD for the next year. Step curve as all alts are hitting now. wave 2 usually is the biggest but hey, this is a bullish scenario.

WLD/USDT - Worldcoin: Super Trend◳◱ On the $WLD/ CRYPTOCAP:USDT chart, the Super Trend pattern suggests a pause in volatility, potentially gearing up for a breakout. Traders might observe resistance around 2.18 | 2.413 | 2.958 and support near 1.635 | 1.323 | 0.778. Entering trades at 2.382 could be strategic, aiming for the next resistance level.
◰◲ General info :
▣ Name: Worldcoin
▣ Rank: 157
▣ Exchanges: Binance, Kucoin, Bybit, Huobipro, Gateio, Mexc
▣ Category/Sector: N/A
▣ Overview: Worldcoin project overview is currently unavailable. I'll try to update this in the upcoming analysis.
◰◲ Technical Metrics :
▣ Mrkt Price: 2.382 ₮
▣ 24HVol: 64,467,313.067 ₮
▣ 24H Chng: 20.669%
▣ 7-Days Chng: 21.74%
▣ 1-Month Chng: 56.25%
▣ 3-Months Chng: 60.77%
◲◰ Pivot Points - Levels :
◥ Resistance: 2.18 | 2.413 | 2.958
◢ Support: 1.635 | 1.323 | 0.778
◱◳ Indicators recommendation :
▣ Oscillators: BUY
▣ Moving Averages: STRONG_BUY
◰◲ Technical Indicators Summary : STRONG_BUY
◲◰ Sharpe Ratios :
▣ Last 30D: 3.81
▣ Last 90D: 1.42
▣ Last 1-Y: 0.46
▣ Last 3-Y: 0.46
◲◰ Volatility :
▣ Last 30D: 1.07
▣ Last 90D: 1.27
▣ Last 1-Y: 1.24
▣ Last 3-Y: 1.24
◳◰ Market Sentiment Index :
▣ News sentiment score is N/A
▣ Twitter sentiment score is N/A
▣ Reddit sentiment score is N/A
▣ In-depth WLDUSDT technical analysis on Tradingview TA page
▣ What do you think of this analysis? Share your insights and let's discuss in the comments below. Your like, follow and support would be greatly appreciated!
◲ Disclaimer
Please note that the information and publications provided are for informational purposes only and should not be construed as financial, investment, trading, or any other type of advice or recommendation. We encourage you to conduct your own research and consult with a qualified professional before making any financial decisions. The use of the information provided is solely at your own risk.
▣ Welcome to the home of charting big: TradingView
Benefit from a ton of financial analysis features, instruments and data. Have a look around, and if you do choose to go with an upgraded plan, you'll get up to $30.
Discover it here - affiliate link -

Long trade setup for WLDUSDFor the BINANCE:WLDUSDT.P Long Trade Setup, the following values are suitable for our interval trade:
Entry: 5.6427
Target: 6.062
Stop: 5.3825
Cost Reduction: -
The profit is reasonable relative to the risk.
*This is not investment advice; you can lose money. Crypto AI Signals is not responsible for any trades. 🚫💰

WLDUSDTmy entry on this trade idea is taken from a point of interest BELOW an inducement.. I extended my stoploss area to cover for the whole swing as price can target the liquidity there before going as i anticipate.. just a trade idea, not financial advise
