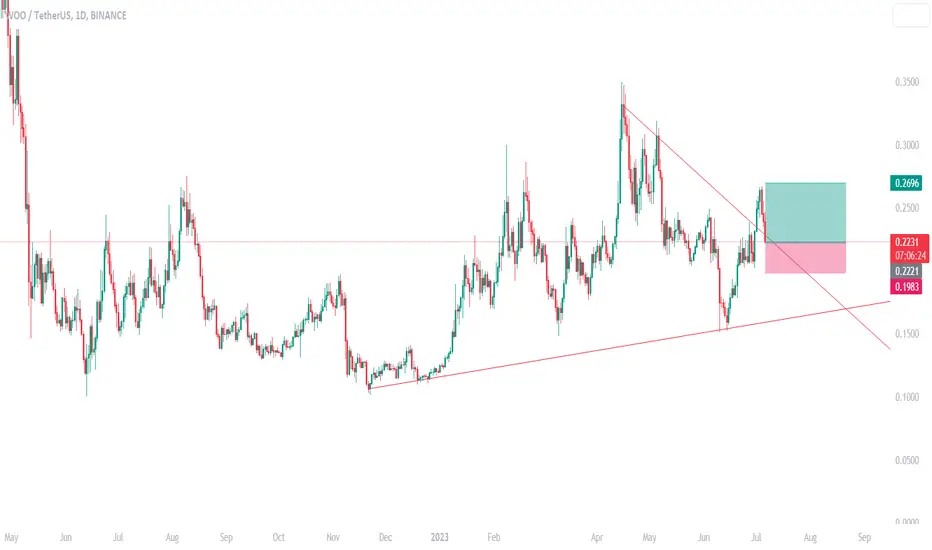
Support Zones | Long BiasDaily Chart
BINANCE:WOOUSDT 's downed to support around 0.19
I expect BINANCE:WOOUSDT will bounce from this zones and go up to 0.22
Wait for next move
WOOUSDT.P trade ideas

WOOUSDT Rally: Bullish Momentum Gains Steam!💎Since finding support at $0.15, #WooNetwork has been on a continuous ascent, forming higher highs and higher lows. The breakthrough above the downtrend trendline, along with the subsequent minor resistance breakout, signals a potential shift in momentum as buyers assert their presence.
💎Currently, the probability of an uptrend is slightly higher compared to the downtrend scenario, prompting buyers to seek a favorable risk/reward opportunity. #WOO is currently trading near the demand zone and testing the support uptrend trendline, indicating a phase of buying accumulation. This accumulation process is likely to persist as long as the price remains above the demand zone.
💎Such accumulation is expected to pave the way for an explosive price growth, offering a promising 73% upside potential. In the event of an uptrend, #WOO is likely to target the previously formed high at $0.35. However, the price action around the 78.6% Fibonacci retracement level, representing a minor supply zone, warrants close monitoring.
💎While maintaining a bullish outlook on #WOOUSDT, it is essential to consider an alternative scenario. Should the price break below the demand zone, the probability could shift in favor of the bears, potentially leading to a drop down to the 78.6% Fibonacci support or even lower.
💎As diligent Paradisers, we shall remain attentive to both possibilities, ensuring informed decisions amid the evolving market conditions. Stay informed, stay prepared! 🌴

WOO 3 ScenarioWOO
As shown in the chart, the Bitcoin currency has risen strongly this year
Investors injected good liquidity into the currency
There are two support lines as shown in the chart
The price may rise at the moment, as we are standing on the first support line
If the price breaks the first trend line and the price goes down, we will touch the main support line, and I think it will be a great opportunity to buy
what are you expecting ?
(Sorry my english is not good)
Did you like my analysis? Leave a comment, like, and follow to get more

Big pumpo ahead , Be ready for it Woo is moving sideways for a days & it is time to pump to 0.26431 area , that is all I am seeing rn ,

Woo idea succeded I was telling you guys some pump is abt to take place and I was right , overall we take profit partially

Double Bottom then Head ShouldersWeekly Chart
On the chart, easily to spot Strong Resistance around $0.33 and price is moving up to that level after reject bottom at $0.15
Chart 4H TF
BINANCE:WOOUSDT is happening a reversal pattern Head Shoulders
Wait and see next move

CEX WatchCentralized Exchanges are a safeish place to purchase and custody crypto currencies. I like these. Perhaps one will win, perhaps all will win.


NOT FINANCIAL ADVICE! MY OPINION ON WOO/USDT IS SHORT FOR NOW.Idea is that market will target the liquidity below and continue higher after. Market has taken Liquidity above and has made a structural shift, CHoCH.
My guess is that market will take internal liquidity in upcoming days.
There is a chance that price can continue downward to take out double bottom on 0.148. and then continue up.
Second possibility is that after taking all internal liquidity price will tap in the POI and will make a break of external structure in future.


WOOUSDTThis is a risky position because of the sensitive conditions of Bitcoin
⚠️"Daily crypto market analyses I provide are personal opinions & not financial advice. Trading carries risks, so do your own research & seek advisor's help."
Don't forget to like and comment
Woo...What goes up must come downI gone short on Woo, we have a bearish harmonic pattern, rejection at resistance, sharp short down to support. Lev 25x. The red labels are resistance, blue support, also has the % coin has to travel to hit targets. Should help with position size
My leverage extended, Lets see how these trades go for the week

#WOO/USDT 8h (ByBit) Descending trendline breakoutWoo Network looks good for bullish continuation after consolidating above 100EMA support, targeting broadening wedge resistance.
⚡️⚡️ #WOO/USDT ⚡️⚡️
Exchanges: ByBit USDT
Signal Type: Regular (Long)
Leverage: Isolated (5.9X)
Amount: 5.0%
Current Price:
0.2131
Entry Targets:
1) 0.2103
Take-Profit Targets:
1) 0.2389
Stop Targets:
1) 0.1960
Published By: @Zblaba
FWB:WOO #WOOUSDT #WooNetwork #CeFi
Risk/Reward= 1:2
Expected Profit= +80.2%
Possible Loss= -40.1%
Estimated Gaintime= 1-2 weeks
woo.org

woousdt long is normalit is braek the important resistance I think long is normal.
please do money manegment

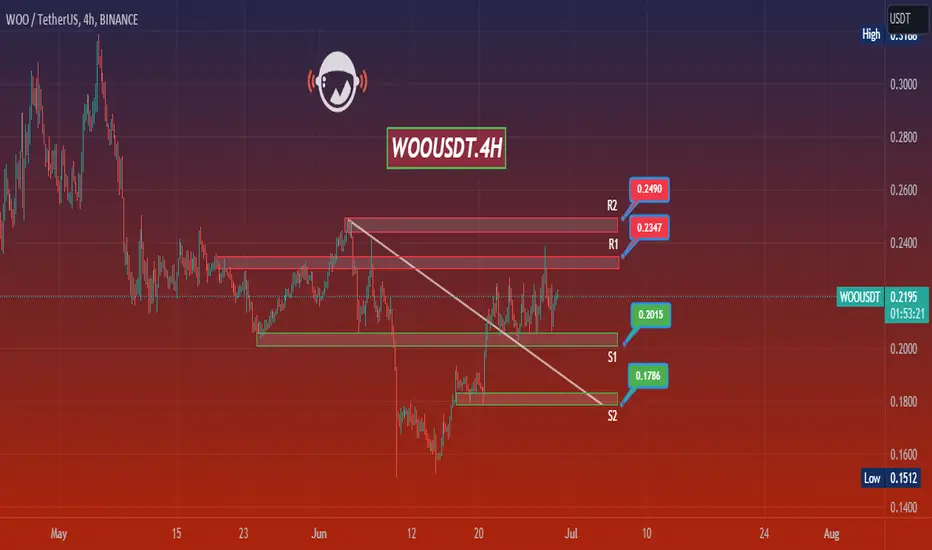
WOO target 0.24~0.274h time frame
-
WOO has potential to create a structure to reach 0.24~0.27.
Be careful of the PRZ there.
-
TP: 0.24~0.27
SL: 0.202

WOOUSDTHello Crypto Lovers, This is a 4H frame analysis for WOOUSDT The price is currently fluctuating within the range between the first support line and the resistance line, and as you can see, until the price breaks out from one side, we cannot issue a signal, so if the price is able to break the resistance line and establish a higher low, I expect a bullish move towards the resistance line. Currently, the price is moving towards the resistance line and there is a possibility of breaking it. Warning: This is just a suggestion and we do not guarantee profits. We advise you to analyze the chart before opening any positions. Take care
Possible short on $WooIf this plays out, take profit along the way
• This is a reversal pattern and you can use it for a short or long position as long as you can identify it on either an inverted or normal chart
• The pattern is characterised by Higher low followed by a lower low and a deep dive that can be traded.
* You can allow the deep dive to play out completely before taking the reversal position
* Research more on the 3 driver pattern and the fib. levels.

WOOUSDTNot an investment recommendation. This chart was made for personal study and personal use only. If you liked the idea, please like it. If not, write why. In my humble opinion, the price will go up.
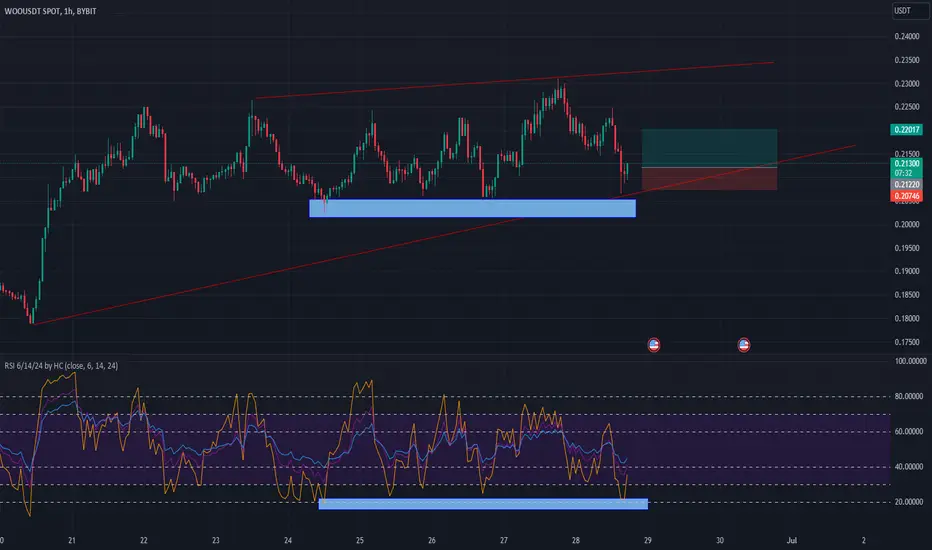
WOOUSD ❕ trading in the rangeOn the 4H Timeframe the price, the RSI chart and the trading volumes have formed an extended bearish divergence.
I think the asset will continue to decline after it overcomes support.

WOOUSDT Will WOOUSDT repeat the previous pattern for a massive bullish attempt of around 17% ?. If the instrument close above 0.2255 , will be a nice buying option.

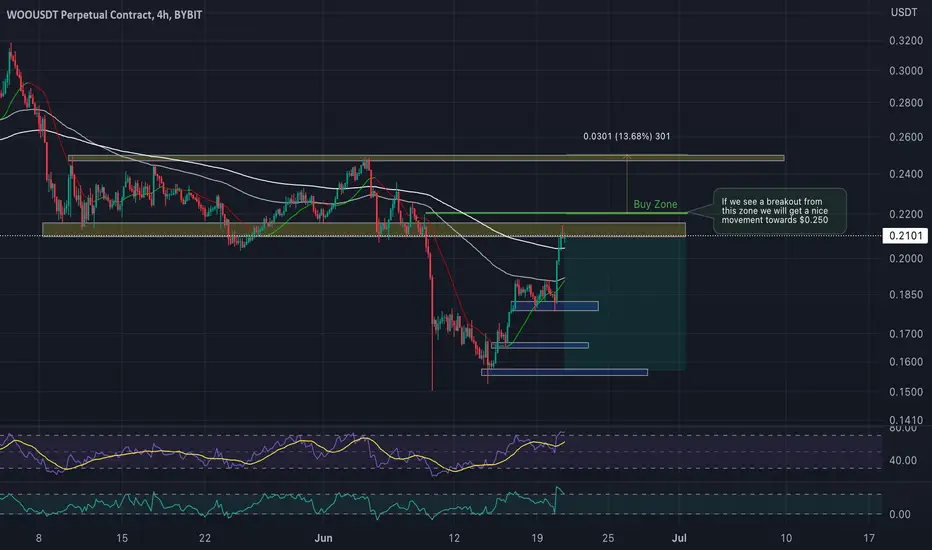
WOO/USDT with a potential breakout...or?Hey traders 👋
Let's take a look at WOO coin which has been performing pretty good recently where price is currently going for a breakout from 200EMA. We see here two potential moves to happen:
First one - Price breakout from current market price and goes for "buy zone" from where we will most likely head towards $0.250
Second one - 200EMA rejects the price of which will leave a price below both EMAs. Meaning we will most likely head towards those blue boxes for some correctional movement!
If you like ideas provided by our team you can show us your support by liking and commenting.
Yours Sincerely,
Swallow Team
Disclamer:
We are not financial advisors. The content that we share on this website are for educational purposes and are our own personal opinions.
CROUSDT (4H) - Bullish breakoutHi Traders
WOOUSDT (4H Timeframe)
The market is in an uptrend and we are waiting for an entry signal to go LONG above the 0.1914 resistance level. Only the downward break of 0.1789 would cancel the bullish scenario.
Trade details
Entry: 0.1914
Stop loss: 0.1789
Take profit 1: 0.1991
Take profit 2: 0.2116
Score: 6
Strategy: Bullish breakout

woo network short setup Stop: above the trebdline and mini triangle
entry at 0.618 Fib + GAP + POC
traget : previous POC
Hello Traders, here is the full analysis for this pair, let me know in the comment section below if you have any questions, the entry will be taken only if all rules of the strategies will be satisfied. I suggest you keep this pair on your watchlist and see if the rules of your strategy are satisfied. Please also refer to the Important Risk Notice linked below.
