WOOUSDT the price has approached to the 4H trend and also breaking downward channel
.I thought that the price will go up.
WOOUSDT.P trade ideas


SHORT WOO 11RRbeautiful support breakdown
backtested as resistance.
Im in a little more leverage because btc and eth are not looking convincing.

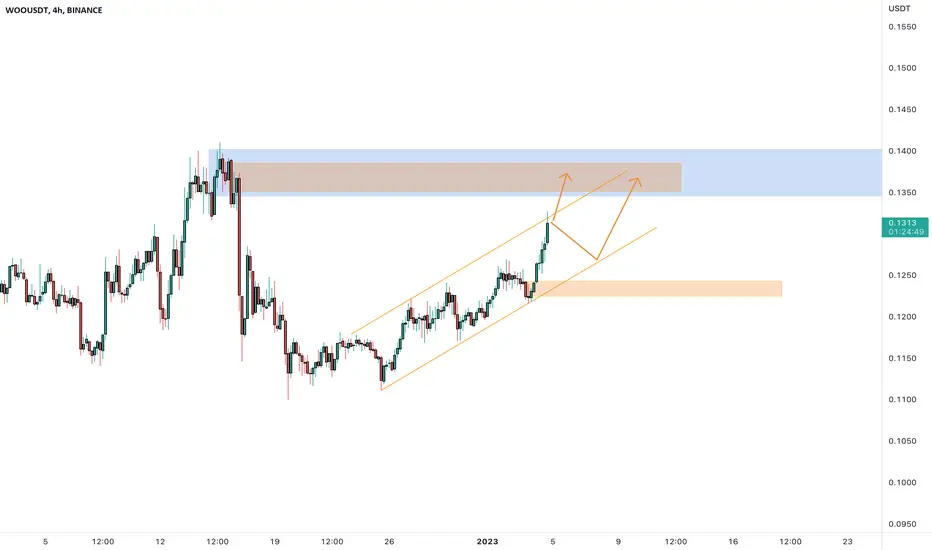
Support and Resistance Trend Line Trading (Woo 4H)Hey guys, let me share today's perspective!
We expect the 4hour candle to rebound when it closes with beekeeping.
If you break below the support line and the resistance line, Run away.!

WOOSalaam
Hope all of you doing well
Woo broke the inverse head and shoulders pattern and pulled back.
Also, it seems it moves in a falling wedge, regarding the last move, the target could be around 0.33-4 area.
The trade setup is despite that I expect some retrace for cryptos when BTC is around 25.7-26k area.
So it's more important to use SL and manage risk.
Good luck
Manage the risk PLZ!

WOOUSDT another jump ahead...WooNetwork drop was stopped at the demand area. This implies bullish dominance and should result in at least one more wave to the upside.

WOOUSDT good RR trade setupWe love this pullback, as we are able to get some WOO at a discounted price. At least onether strong wave up is expected.

WOO - Short from range highWOO showing a bearish divergence on the daily timeframe and is also at range high. Good short opportunity.
Yasir, your coin goin to the grave...

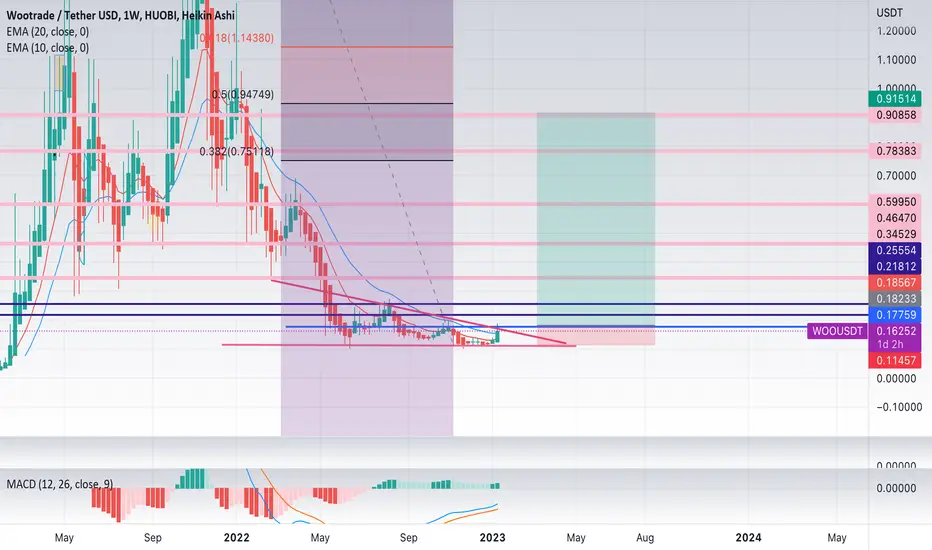
WOO - a very promising projectWOO finance is a very promising project with good fundamentals and tokenomics.
price shattered to the floor due to the launch during the crash of 2021.
while 1 WOO token has the promise to reach upto 10$, we focus on the maths and the golden pocket says that price has the potential to move to 0.5$ (even if it turns out to be a fake bull run).
the MAs have indicated the resurrection of the price and bottom for this coin is in at 0.1$...
recently it made a jump tp 0.3$ and currently trading at 0.22$.
this is a good time to enter in this trades the RR is very high.
Let's meet on the other side of the trade. Ciao.

WOOUSDT | SETUPWOO has broken above the falling trend line after taking support from horizontal zone.
The bulls are in control as long as price is above the support zone.
Manage your trades accordingly.

Massive cup and handle? With the handle currently formingMight be a big cup and handle pattern with the handle currently forming within the ascending triangle? The RSI is also making an ascending triangle. Not to sure if this will hold up tho just publishing it so I can keep a track of it.

BLOOD WOOİkili tepe formasyonu çalışırsa eğer hedeflenen bölgeye doğru düşüş gerçekleşecektir. BTC hareketleri izlenmeli... Yatırım tavsiyesi değildir.
Bekleyip göreceğiz.

WOOUSDT wants the supply zone?WOOUSDT has seen substantial growth in recent times, as indicated by a return of more than 79% since my previous idea.
The market for this asset recently broke out of a falling wedge pattern, with support noted at 0.18.
The price has since retested the 0.5 Fibonacci level, allowing it to acquire new liquidity.
The next target for this asset is expected to be the supply zone at 0.24 dollars, so According to Plancton's strategy , we can set a nice order
–––––
Keep in mind.
🟣 Purple structure -> Monthly structure.
🔴 Red structure -> Weekly structure.
🔵 Blue structure -> Daily structure.
🟡 Yellow structure -> 4h structure.
⚫️ black structure -> <= 1h structure.
–––––
Follow the Shrimp 🦐

WOO 1D chartAt the beginning of January this year, with the rise of BTC, many currencies also rose, and WOO was no exception.
-
It can be seen from the 1D chart that WOO has broken through the pressure trend line starting from the high point of 0.2747. After breaking through the previous high of 0.1975, it came to 0.2281, and the trend turned to higher high and higher low.
-
Fibonacci retracement with the high point of 0.2281 and the low point of 0.1016, WOO steps back at 0.1649~0.1798, and the first target is 0.2914~0.3063.
It should be noted that 0.2764 (1.382) overlaps with the previous high of 0.2747. The previous high point usually has a resistance effect, and WOO may consolidate here for a period of time before going out.
-
WOO target price:
0.2764
0.2914~0.3063
0.3546
0.4103
0.4382
-


WOO USDT LONGSeems good RR area for spot or lev buy. We need to hold this nice deman zone. Retesting currently. I'm buying some and will dca till half / bottom of zone around 18900.
Aiming for red line being daily resistance level (15% move if we get there).


WOOSDT (4H) - Bullish Wave LTFHi Traders
WOOSDT (4H Timeframe)
A high probability, entry signal to go LONG will be given with the upward break of 0.212 after the market found support at 0.192. Only the downward break of 0.192 would cancel the bullish scenario.
Trade details
Entry: 0.212
Stop loss: 0.192
Take profit 1: 0.250
Take profit 2: 0.285
Score: 8
Strategy: Bullish Wave LTF

WOOUSDT wants the resistanceThe price is testing the upper trendline inside an ascending channel
How to approach it?
IF the price is going to have a breakout or if the price is going to grab new liquidity, According to Plancton's strategy , we can set a nice order
–––––
Keep in mind.
🟣 Purple structure -> Monthly structure.
🔴 Red structure -> Weekly structure.
🔵 Blue structure -> Daily structure.
🟡 Yellow structure -> 4h structure.
⚫️ black structure -> <= 1h structure.
–––––
Follow the Shrimp 🦐
WOOUSDT - LongSimple range breakout play, of course dependent on BTC behaving. So long as BTC stays in range I trust this goes to test and take out the liquidity resting 0.23 region.
I'm long with a risk defined below Monday's low.

my spring / summer prediction for woo 2023 on the weeklyvolumes on woo are pumping , new implementations are rocking protected by live balance sheet and supported by zero fees
Woousdt buy idea We break the general downtrend ,I think the price will retest the broken trend then continue uptrend also we have fib 76 area which increases the chance to go up.

WOO - 10/01 - 1D Chart UpdateWOO - 10/01
#WOO is currently trading in a ascending channel after it manage to confirm a breakout on the daily candle.
After some good news on the WOO Network the coin had a 48% increase and touched the first resistance.
Given the current market we can expect it to try a breakout again from the first resistance zone ($0.189~$0.205) and if it manages to break that zone we can easily see the price go to $0.25.
*Candle color depicts volume
