WOO ANALYSIS📊 #WOO Analysis
✅As we can see that #WOO was consolidating in a small range but right now there is a breakout or major resistance level. We would see a good bullish movement in #WOO
👀Current Price: $0.2490
🚀 Target Price: $0.2880
⚡️What to do ?
👀Keep an eye on #WOO price action and volume. We can trade according to the chart and make some profits⚡️⚡️
#WOO #Cryptocurrency #TechnicalAnalysis #DYOR
WOOUSDT trade ideas

#WOO Getting Ready for a Major Breakout | Key Levels to WatchYello, Paradisers! Will #WOOUSDT finally break out of its descending channel, or are we heading for another drop? Let’s break it down #WOO:
💎#WOO has been trading within a descending channel on the 8-hour chart, showcasing a classic consolidation structure. Currently, the price is approaching a critical descending resistance, making this a pivotal moment for traders.
💎A break above the resistance at $0.3041 could confirm a bullish breakout which would set the stage for an extended rally. If bulls gain control, the next target zone lies between $0.4000–$0.4500, a significant supply zone where sellers may reappear. We need strong confirmation with robust volume and bullish momentum for this scenario to play out.
💎On the downside, $0.2044 serves as an essential demand zone and has been a reliable support level during the recent consolidation. If #WOOUSD fails to hold this demand we may see a retest of this strong support at $0.161.
💎A close below the $0.161 strong support would invalidate the bullish outlook and could result in a deeper correction. If this happens, the price may drop to test the $0.1500 region, marking a significant shift in sentiment.
Stay focused, patient, and disciplined, Paradisers🥂
MyCryptoParadise
iFeel the success🌴

WOO/USDT Long ( Low Timeframe )WOO Looking like is building bottom structure before potential extension upwards,
3 Limit Orders Setup

WOO TF 1D - Up only (?)WOO TF 1D - has a potential bullish pattern based on historical chart pattern.
Feel free to discuss.

Woousdt bullish As we can se woousdt just rejected from inversions so i am bullish on woousdt as per my analysis

Woolish not yet well i am a fan of Woo and their team the way they have managed to bring all the things together is awesome but i may be biased but still think that box is yet to filled i may miss the bottom entry but my gut says that it will fill any ways if it don't i don't run this market flip the orange level and stay ther for a week or two and then lets go woolish
bitcoin is bullish so that may be a push ahead for sure

Woousdt Crossed Throgh the mid line of the accumulation channelWoousdt Crossed Throgh the mid line of the accumulation channel

#WOO Ready for a Major Upward Move Or Not? Key Levels to WatchYello, Paradisers! Are #WOO bulls ready to maintain momentum above or not? Let's discuss the latest analysis of #WOO and see what's happening:
💎#WOO has recently broken above the resistance of its ascending channel, igniting bullish momentum and raising expectations for a potential rally toward higher price levels. However, the next move will depend heavily on the $0.34-0.37 supply zone, a critical barrier that traders must closely monitor.
💎If #WOO can decisively break above $0.34, it would confirm a continuation of the bullish breakout, opening the door for a run toward the major resistance zone between $0.63–$0.70. Such a move would likely attract fresh buying interest and signal the start of a stronger upward trend.
💎However, there’s still a risk of a pullback. If WOO fails to maintain momentum above $0.34, a retracement to the $0.2354–$0.2021 demand zone becomes likely. This zone will act as the key support area, and any dip into this level could provide a re-entry opportunity for bulls.
💎Should #WOO close a daily candle below the $0.2021 level, it would invalidate the bullish breakout entirely and confirm a bearish reversal. Such a move could trigger a deeper correction, with the price potentially revisiting the $0.15 region, reinforcing bearish sentiment and shaking out over-leveraged traders.
Stay focused, patient, and disciplined, Paradisers🥂
MyCryptoParadise
iFeel the success🌴

WOO trade update.We recently shared a potential breakout scenario for GETTEX:WOO :
In our initial analysis, we highlighted the possibility of a strong move above the previous monthly high. While our first entry did not pan out as planned (stop loss hit), this trade is a prime example of why risk management is non-negotiable.
Key takeaway: A well-placed stop loss keeps losses minimal and gives you the freedom to re-enter when conditions align.
And align they did. On the second attempt, we nailed it:
+40% Move.
Two profit targets hit flawlessly.
Second time’s the charm! 🏆

TradeCityPro | WOOUSDT Analysis Futures Opportunity👋 Welcome to the TradeCityPro channel!
Let’s take a detailed look at the WOOUSDT coin triggers, even on this relaxed Friday! 😊
🌍 Bitcoin's Market Overview
Before diving into WOO, as always, let’s check Bitcoin
Yesterday's analysis: After breaking 96610, a long position was suggested.
Additionally, if Bitcoin dominance decreases, it could confirm favorable setups for altcoins. However, Bitcoin remained range-bound, moving in sync with the overall market.
📊 Weekly Timeframe
WOO is one of those coins that hasn’t made any significant moves yet, but the buy trigger has been activated.
After breaking 0.2228, a mid-term buy was possible, and there’s still a logical opportunity to buy at market price with a stop loss at 0.1308, supported by increased volume and RSI entering the overbought zone.
If you missed this trigger, you can wait and join this coin upon breaking 0.3369.
📈 Daily Timeframe
We’ve seen a relatively strong move, but the price has hit a significant daily resistance at 0.275
where it has been ranging for several days. After breaking this resistance, further upward movement could begin.
Additionally, RSI is nearing the overbought zone. For a risky buy in the daily time frame, consider entering after breaking this resistance, with a risky stop loss at 0.2129 or a safer stop loss at 0.1550.
⏱ 4-Hour Timeframe
The price shows compression, forming something resembling a triangle, with higher lows being created consistently. This increases the probability of breaking the 4-hour resistance at 0.2779, which could serve as a solid trigger for a futures trade.
📈 Long Position Trigger
The trigger is clear after breaking 0.2779, aim to open a long position with a safe stop loss, such as 0.2340.
📉 Short Position Trigger
The market currently lacks momentum for shorts. Even with a 20% drop driven by whales, short positions aren’t attractive now. It’s better to wait for stronger bearish momentum to enter with smaller stop losses.
💡 BTC Pair Insight
WOO has been bearish against Bitcoin in the long term but currently shows significant trend weakness and is ranging within its daily box. Compared to most altcoins, WOO demonstrates better strength relative to Bitcoin. If lower time frames confirm a breakout, an upward trend could begin.
📝 Final Thoughts
Stay calm, trade wisely, and let's capture the market's best opportunities!
This analysis reflects our opinions and is not financial advice.
Share your thoughts in the comments, and don’t forget to share this analysis with your friends! ❤️

Ascending Channel Trade Setup for WOO/USDTThe chart shows WOO/USDT on a 4-hour timeframe, with price action within an ascending channel. The trend appears bullish, as the price consistently forms higher highs and higher lows, respecting the channel's support and resistance lines. A long position is indicated, with the entry near the channel support around 0.1770. The target is set near 0.2350, close to the channel's upper resistance, while the stop-loss is around 0.1480, slightly below the channel support. This setup suggests a favorable risk-to-reward ratio, betting on a continuation of the uptrend within the channel.


$WOOUSDT ready for 2xif its pull back slightly, I will add it to my portfolio. After that is sky is the limit. 2X will be easy for it

WOO - Potential breakout move above previous month high.As per Trend X indicator,
WOO has broken above the previous month high and has been retesting that level several times.
If it holds above, there is a high chance of an upwards move towards Resistance 1 and possibly past that level, all the way to Resistance 2 (that would be a ~30% move from entry)
Entry: $0.2392
Stop loss: $0.2277
TP1: $0.2754
TP2: $0.3140
R/R: 6.5

WOOUSDT.PWe are looking to re-enter WOO after a displacement move!
EN: 0.18562
SL: 0.18140 ~ 2.3%
TP: 0.2134
DYOR

WOOUSDT: Strong Bullish Breakout Signals Next Big Move!BINANCE:WOOUSDT has shown a strong bullish setup after a successful breakout from a falling wedge pattern, followed by an extended period of consolidation. This consolidation phase allowed the price to stabilize and gather momentum. Now BINANCE:WOOUSDT broke out of its consolidation box, indicating the start of a potential upward trend towards new highs. With strong volume supporting this breakout, the chart signals a bullish continuation. Traders should watch for key resistance levels and monitor volume to confirm momentum. GETTEX:WOO is showing strong potential as it heads toward higher levels—stay tuned for more movement!”
BYBIT:WOOUSDT Currently trading at $0.225
Buy level: Above $0.22
Stop loss: Below $0.178
TP1: $0.26
TP2: $0.35
TP3: $0.5
TP4: $0.65
Max Leverage 3x
Always keep Stop loss
Follow Our Tradingview Account for More Technical Analysis Updates, | Like, Share and Comment Your thoughts

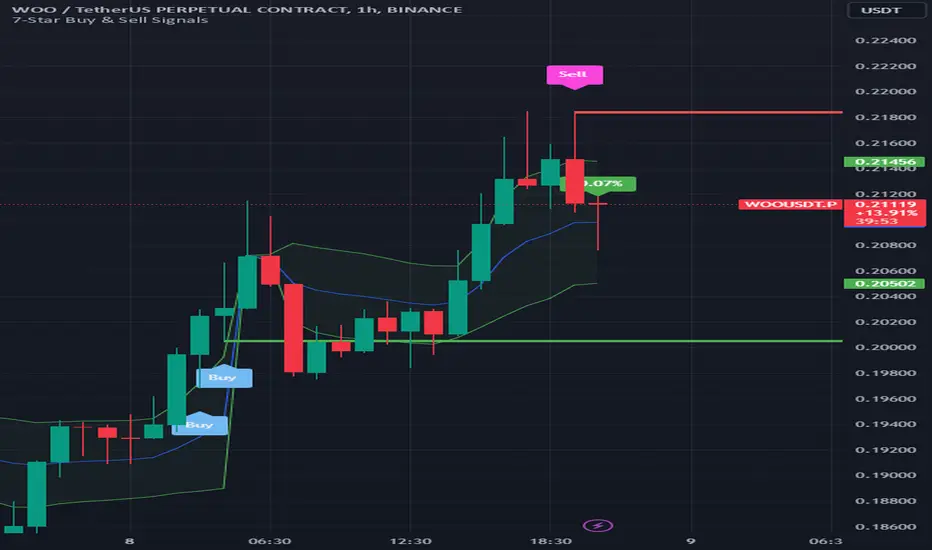
it's a WOO DAY.Hello traders, Hope you all are very excited with recent BTC bull run.
our indicator picked buy and sell prints perfectly with the woo coin. The sell print occurred after a great volume dip and also with BTC going down.
Next support will be the thick green line
DYOR
For indicator access you can text me.
Trade Alert: WOOUSDT Pair MovementDirection: Buy
Enter Price: 0.1632
Take Profit: 0.17173333
Stop Loss: 0.15523333
We have identified a potentially profitable opportunity with the WOOUSDT currency pair. Our recommendation is based on a Buy signal, aiming for entry at 0.1632 . Our analysis suggests setting the Take Profit level at 0.17173333 and a Stop Loss at 0.15523333 .
This prediction relies on the sophisticated modeling of the EASY Quantum Ai strategy, which takes into account multiple market factors:
1. Market Momentum : Recent analysis shows increasing bullish momentum, indicating a favorable environment for long positions.
2. Support and Resistance Levels : The Enter Price is strategically placed above a key support level, while the Take Profit is set just below a potential resistance, maximizing profit potential.
3. Volume Analysis : A surge in trading volume supports the upward prediction, implying strong market interest and liquidity.
Please remain vigilant and monitor the trade as market conditions can shift. This forecast utilizes advanced Ai analytics to optimize trading strategy, thus enhancing potential returns with calculated risk exposure.
Stay tuned for further updates as market patterns evolve.

#WOO ON TRACK TO NEXT RESISTANCE #WOO has once again bounced off our daily trendline nicely!
It should reach the next resistance at 0.2560 in no time 🙏

#Woo #bearishWoo closed the daily candle with a bearish rejection, indicating a likely further price drop.

$WOOUSDT Ready for Takeoff: Breaking Out of the Falling Wedge!BINANCE:WOOUSDT recently broke out from a falling wedge pattern and took a small retracement. It’s now starting to move upward again with strong volume behind it. Expecting significant jumps in the coming days as momentum builds! Keep an eye on key levels for potential entries.
GETTEX:WOO Currently trading at $0.186
Buy level: Above $0.185
Stop loss: Below $0.154
TP1: $0.22
TP2: $0.35
TP3: $0.5
TP4: $0.65
Max Leverage 3x
Follow Our Tradingview Account for More Technical Analysis Updates, | Like, Share and Comment Your thoughts

WOOUSDTWOO ~ 1W
#WOO In the event of a retest of this support block,. this is a very strong buy signal.

woo end of year rally on a weekly timeframe strategy long trading within one volatile but still reliable asset
long with trading 90 - 95 % spot and 5 -10% futures x 5
spot trading with full asset sell at every marked level - below 0.40 rebuy at 0.5 fib not to miss bullish reversion , above 0.40 rebuy at 0.618 fib
spot strategy involves 1000 % gain
warning : low volume on spot - gains not available with possible months of waiting untill final target is reached again
long & short day trading anticipating on the moves
big or obvious moves : 10% (right after big move up or big move down untill 50% gain )
small : 5% (right after small move up or small move down untill 25% gain)
warning : watch bitcoin , weekly and daily first before making a move
anticipation on 12 big moves and 24 small moves , and 2 liquidations
futures strategy involves 1000% gains available
