$WOOif we get a good altcoins correction then this $WOOuld be amazing lol
Scoop some there
Educational purpose only
Nfa
WOOUSDT trade ideas


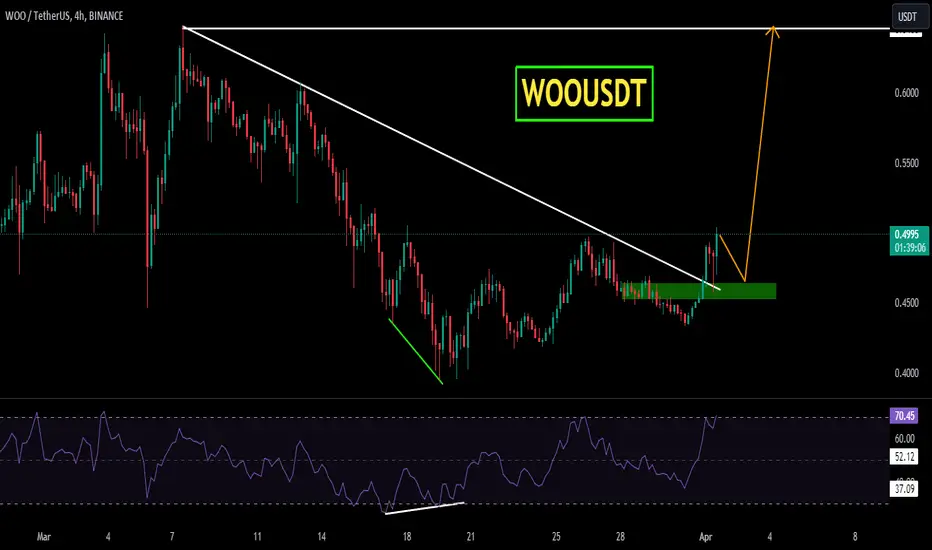
WOOUSDTWOOUSDT is trading inside the symmetrical triangle . The price is reacting well the support and resistance of symmetrical triangle.
Currently the price has given the breakout from declining trendline with confluence to strong bullish divergence and now seems like the bulls are getting ready for some strong upside movement.
If the bulls sustain to upside the optimum target could be 0.6500 followed by 0.700
What you guys think of this idea?
WOOUSDT DailyHi dudes,
I see a low risk short term position in this chart, 1-2-3-4--------> now waiting for 5, what do you think!?
Best Regard

Woo/Usdt On The Verge Of Breakout The Woo/USDT pair is currently on the verge of a potential trendline breakout. If this breakout is successful, we could see a significant bullish move of around 15-30% in the short term. Please note that this information is not intended as financial advice, and it is crucial for you to perform your own research (DYOR) before making any investment decisions. Trendline breakouts can serve as crucial technical indicators for traders, potentially signaling a shift in market sentiment and paving the way for price momentum. Keep a close eye on the price action and volume to confirm the breakout, and always manage your risk accordingly.

WOO/USDTWoo consistently forms lower highs, indicating a bearish trend on the lower time frame. I have set my take profit at the swing low.

Woo Long Woo coin has formed a clear Bullish structure. It will pump hard now. But question is where to Enter?. I have marked entry level and DCA Level on chart. Chart says everything.

When to buy WOO Coin?BINANCE:WOOUSDT
Coin WOO looks like it could be a good long opportunity on the daily timeframe. The price recently broke above the 0.6150 range, which is a bullish sign. The SMA 7 is also supporting the candle, which indicates that the uptrend is still intact. There was also a relatively good volume on the indecision candle, which suggests that there is interest in this coin at this level.
The overall market trend is still bullish, which is a positive factor for Coin WOO.
The RSI indicator is not overbought, which suggests that there is still room for the price to rise.
However, it is important to remember that this is just my idea and you should always do your own research before making any investment decisions. Please also use capital management in every position to protect your downside.

#WOO/USDT#WOO
The price is moving in an upward channel on a 4-hour frame
Some correction is expected, then the rectangle will break higher
This rise is supported by stability above the Moving Average 100
Entry price is 0.4340
The first target is 0.4705
The second target is 0.4936
The third goal is 0.5228

WOO😯 analaysisThe daily timeframe shows a rejection and there is a bearish trend on the hourly timeframe. I am currently in a short position.

WOO USDT TECHNICAL ANALYSISThe previous trend of chart is bullish
Chart is making continuous HH & HL's. There is no divergence on RS I. Also 0.65120 is last resistance on chart if this breaks we can approximate the upcoming resistance R1,R2 &R3 using Fib retracement . The possible reversal of current price is to be expected at the current price using Fib Retracement. After candle closing above 0.65120 and waiting for confirmation we can most probably expect the chart to rise .

$wooback in this bubba looking for a blow off top from here so shall let it run
invalid below white line
btc pair looks like its just above the 99 ema so as long as we hold this should leg up next

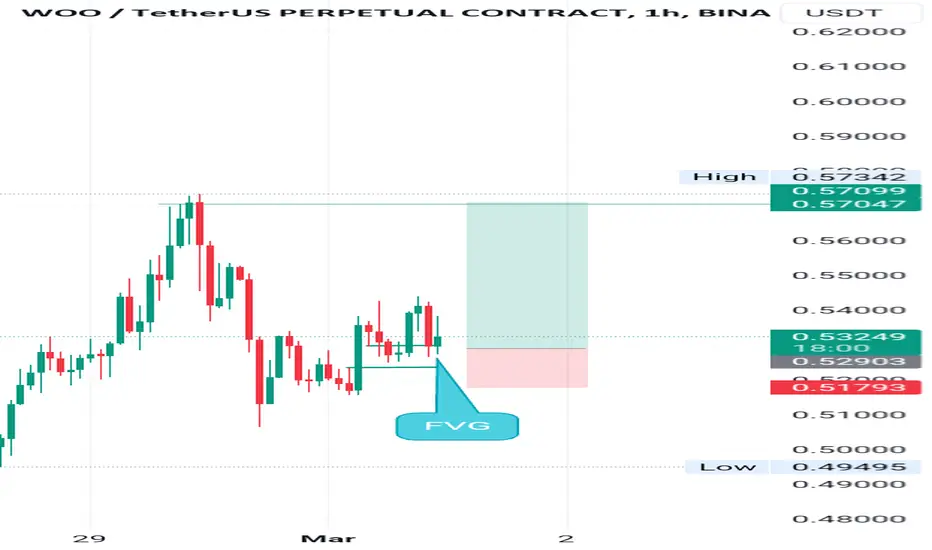
WOO/USDT ideaIn my opinion, Woo 1 hour fvg can serve as a support. I trust that it will hold, so I am taking a long position with a tight stop loss.
WOO/USDT Presenting Opportunity for Bulls? 👀🚀WOO Analysis💎Paradisers, let's focus on #WOOUSDT, where the current trends hint at a potential bullish turnaround from its essential support area.
💎A glance at #Woo's recent market activity reveals a notable 40% drop from its recent high. However, the steadfastness at the support level of $0.37 suggests an opportunity for an upward movement.
💎Despite the challenge of surpassing new highs or previous milestones, leading to prevailing bearish sentiment, the $0.37 level is crucial for #WOO. This juncture is primed to potentially initiate a considerable bullish wave with a fresh assessment.
💎As strategic traders, we're perpetually equipped with a backup plan. If #WOO declines further from this support, we're poised for a bullish comeback starting from the same support at $0.37. It's important to acknowledge, however, that descent through this marker could signal the start of more profound bearish trends.
💎Keep your strategies adaptable and your observation of the market sharp, Paradisers. Your ParadiseTeam is vigilantly watching, ready to guide you through these evolving market scenarios.

✴️ Woo Network | Another Good Looking One (Name Your Altcoin)So many good looking pairs it is starting to look scary.
Sometimes things start looking so good that you can start doubting, seriously... I am being fully honest... Well, not really, half-joking.
I can see the doubts but I never entertain them but instead become entertained by them.
Everything Crypto is looking good because it is about to get good.
All these Altcoins are looking great because that's what's coming... Years in the making, it is about time! ... Do you feel me?
There's a catch with the targets.
➖ Short-term = 1 month (within 30 days).
➖ Medium-term = 3 months (within 90 days).
➖ Long-term = 6 months or longer (within 180 days but can go for years)
So the targets that I am sharing can happen within a few days or weeks or it can take a few months but no more than 3, most of the time. By the time we reach 3 months the wave is over and a correction takes place.
People sometimes wait, wait, wait and never sell.
When they see that the correction lasted for 2 months, 3 months or even 6 months they say, "wow, I should have sold"... So there is a catch, you need a plan or at least have an idea as to what you will do when prices start to go up.
We have many people, thus many strategies so that each individual can adapt to their own lifestyle and liking...
Long-term? Just buy and hold!
Short-term? Sell on each wave!
Medium-term? You need to be an expert or you can missed most of the action in this frame.
Does this all makes sense?
Maybe this is a bit more advanced than beginners talk, but we are bound to get to this level after 8,000 charts.
Woo Network (WOOUSDT) is another Altcoin that is looking great.
Long-term higher lows (since June 2022) and present time break above EMA50 confirms the next bullish wave.
Don't get me wrong, things can change... But that's the current market bias, bullish!
Thank you for reading.
Namaste.

Woo Jinny Gann Levels/Gann FanzJinny Gann Fan Levels are on the Chart possible Trendlines my WAY.
Jinny Gann Fan/Horizontal Lines Works as Support / Resistance.
Important levels for the Big Cycle on the chart.
Trade Wisely.

WOO BULLISH!WOO BULLISH! WOO just touched an important support level showing signs of strength, accumulating

WOO 3d Chart, Q1-Q2 2024 Publishing an updated WOO chart to continue tracking it.
The road back to $1 needs WOO to break out of this cylinder, in a similar manner to RNDR.
If this can get past the .6-.7 and hold it successfully, the move to 1 should be fairly quick.
All contingent on no drastic BTC moves.

WOO, is $1 next?Woo should hold the Daily FVG to go up.
●upwards targets are $0.69 & $0.879.
●In case if Daily FVG is lost then we can Buy WOO at $0.46.
●WOO is Bullish until we don't get daily candle closing below the (24 Feb) Daily FVG

WOO chart looks juicyNon financial advice
WOO chart looks money maker. We are not here for the projects, we are here for the money.
Obviously, everything depends on BTC, but this chart looks like a rocket. I think the correction zones could be around .58 , .69 and .89 , but tbh I think this coin will be soon in 1 dollar.

WOO ANALYSIS🔮 #WOO Analysis - Breakout Trading
🌟🚀 #WOO was trading in a "Cup and Handle Pattern" and here we can see that #WOO gave a great breakout. Also there is a breakout of Bullish Flag Pattern. We can see a bullish move of more than 50% 📊📊
🔖 Current Price: $0.4844
⏳ Target Price: $0.8751
⁉️ What to do?
- We have marked crucial levels in the chart . We can trade according to the chart and make some profits. 🚀💸
#WOO #Cryptocurrency #Breakout #DYOR


