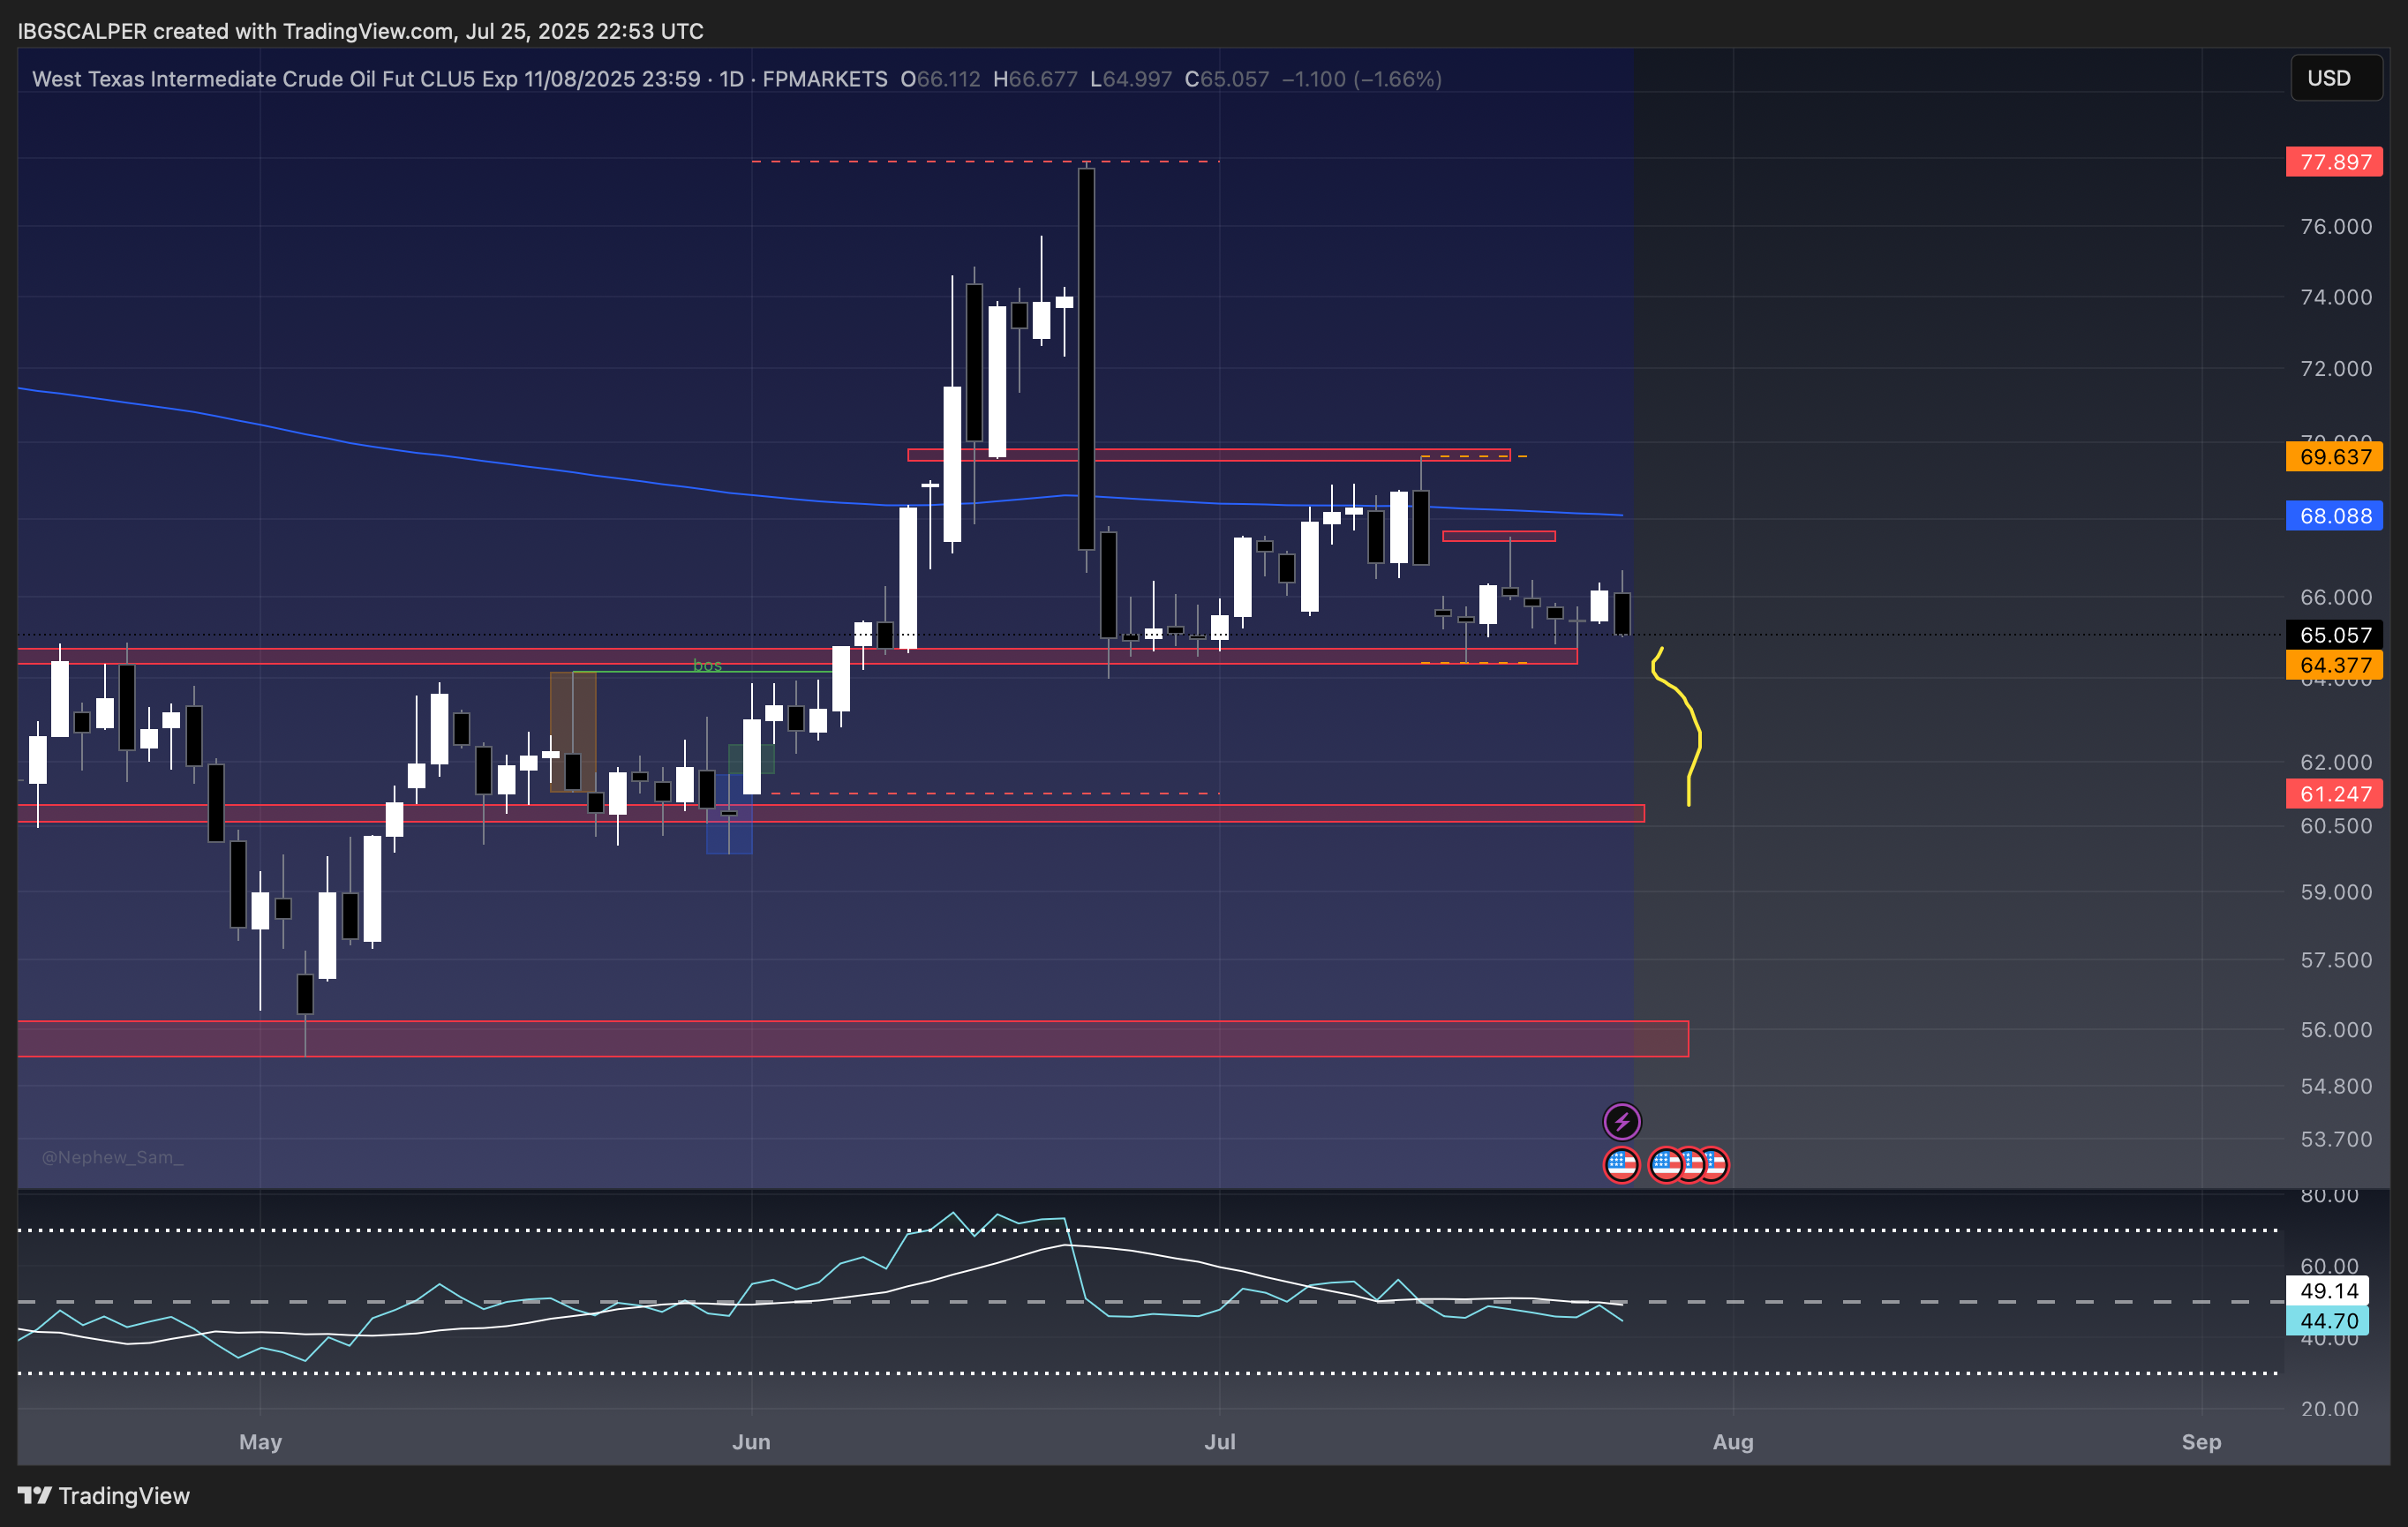
West Texas Intermediate Crude Oil Fut CLU5 Exp 11/08/2025 23:59 forum
Here's a video of Trump with the Federal Reserve's Jerome Powell under the building wearing construction hats on. Trump has called Powell a "loser" in the past and watch closely Powell's expressions in the video link below.
Those who have "Trump Derangement Syndrome" don't realize that the Federal Reserve is not even part of the federal government and is a really a foreign-owned private bank under the Bank of International Settlements (BIS) in Europe. It's a criminal banking cabal system that Trump is trying to remove. It has never been audited and only self-audited. The Federal Reserve created a debt-based economy in America - owing trillions of dollars not ever meant to be paid back.
Here's the video link:
youtube.com/watch?v=7RgYm4s0Fog
🎉Mucho petróleo, señor
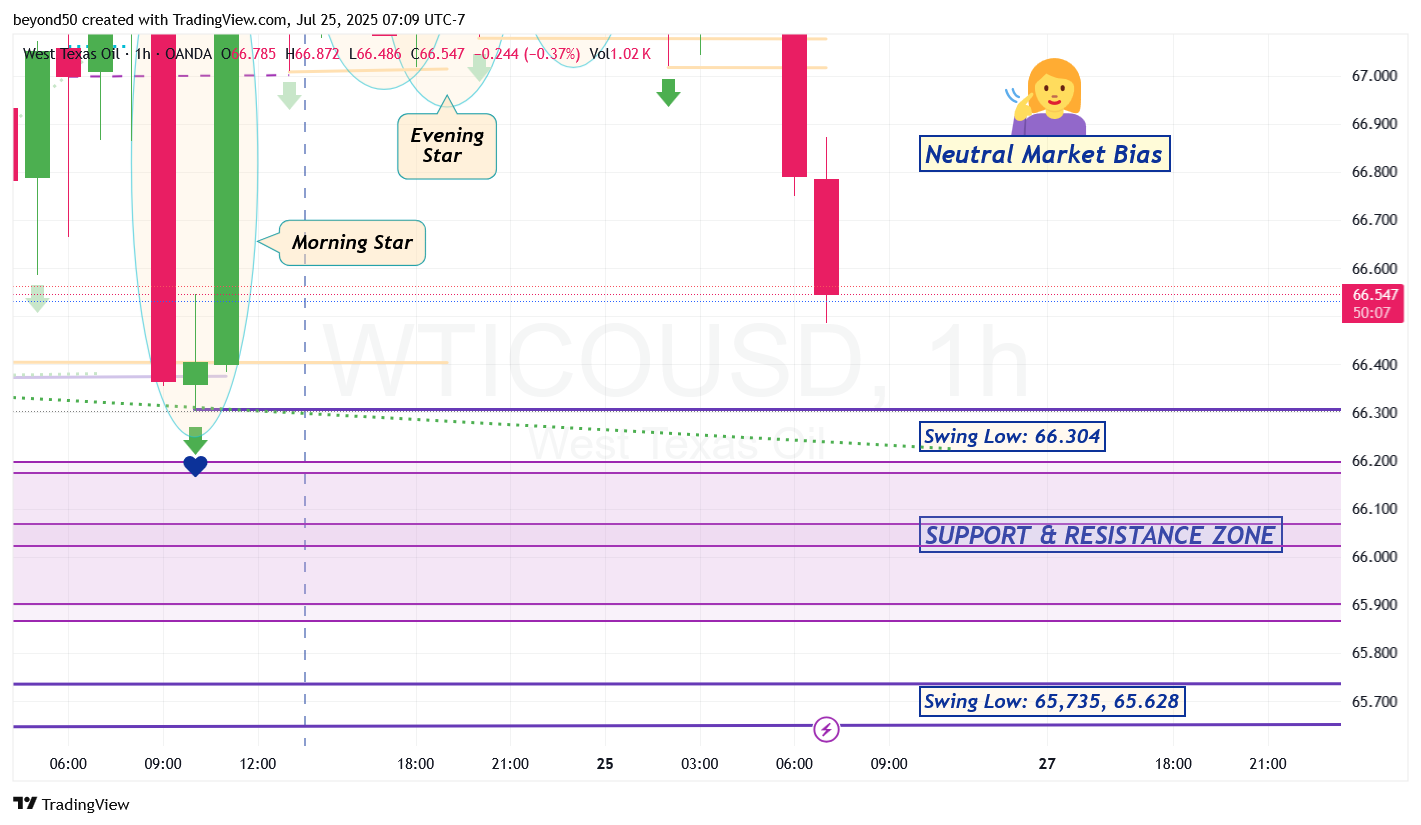
When there's Neutral (directional) Market Bias, the bullish and bearish trendlines (in red and green dotted lines) fan out like a funnel. You'll see price action gravitate from one extreme end of a trendline to the other until there's a true (and not fake) breakout.
The trendlines were drawn first through the observation of how the candles pivot and then price action followed by going to the extreme ends of the trendlines.
Look below how price action did exactly that on the Hourly chart below:
Bullish Oil
OPEC projects oil demand will hit 8,455,675,743,343,676,454 bpd by 2050.
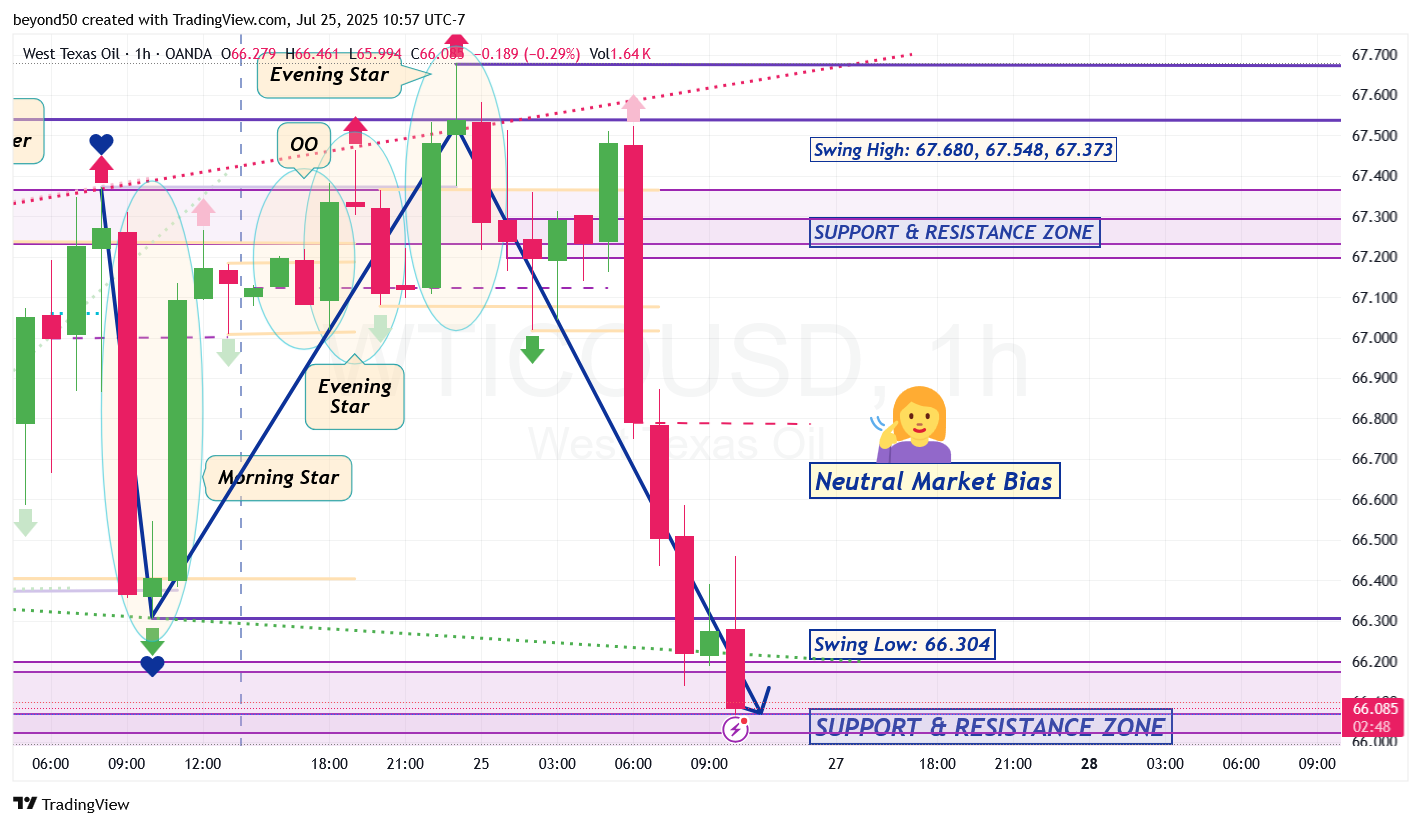
On that Hourly that is still in Neutral (directional) Market Bias from the bullish and bearish trendlines fanning out, the bears are now headed for the lower, extreme end of the Bullish Trendline (in green dotted line).
As the bears drop down, there's a Swing Low of 66.304 that can potentially be breached, along with the trendline to flip the market bias to bearish. And then there's the tall, multi-layered S&R Zone to deal with. If the bear don't breach the Swing Low of 66.304, then back up again until a breakout from the fanned trendlines.