Light Crude Oil Futures will dump between 61.16 and 57.55 (-15%)CL1! In the monthly timeframe is showing strong selling side that will lead the price between the region of 57.55 and 61.16 that is the value area low from march20 and the fibonacci 61.8% from the same low.
WTI3! trade ideas

Oil Price Approaches April HighThe price of oil may further retrace the decline from the April high ($71.16) as it continues to carve a series of higher highs and lows, and a move above 70 in the Relative Strength Index (RSI) is likely to be accompanied by a further advance in crude like the price action from earlier this year.
In turn, a break/close above the $70.30 (61.8% Fibonacci retracement) to $71.90 (38.2% Fibonacci retracement) zone may push the price of oil toward the February high ($73.84), with the next area of interest coming in around $76.00 (78.6% Fibonacci extension) to $77.20 (50% Fibonacci retracement).
At the same time, lack of momentum to test the April high ($71.16) may keep the RSI out of overbought territory but need a move below the $64.20 (61.8% Fibonacci retracement) to bring the monthly low ($61.06) on the radar.
--- Written by David Song, Senior Strategist at FOREX.com

Crude Oil Breaks out of Channel More Upside Ahead?Hey traders so in continuation of the last post which was Can Crude Oil Close above $68?
The answer is YES that didn't take long. 😁
One rule to live by that I have learned as a trader is Always Expect the Unexpected in Trading!
So I bored out of my mind watching paint dry and then all of sudden Boom out of nowhere news that changes everything can happen in the blink of eye in these markets!
So what Happened Opec? Iraq? Inventory Reports?
Well truthfully it great to read to the news but I prefer to read the charts instead. The charts are already showing you that demand has increased so regardless of if you caught the news yesterday or not the charts have already told the story.
Ok so now what it has closed above $68 which a strong bullish candle on 06/11 so did we miss the move?
Not at all especially if this is the beginning of new trend so best way to trade the break out of a channel is watch for it to retest the breakout zone.
So the breakout zone on the charts was $65 but now at $68 so if we can get a retest of $65-66 I believe it would be a great place to buy back in this market.
Like I always say don't chase the market let it come to you. The party has already started but that doesn't mean you missed the party. We might get a second invitation at $65 or $66 so if trading this market place a buy order around there and stop loss somewhere below support and half way in the channel around $62-63 below to give the market room to breathe.
What if we don't get a retest?
Well thats how it is sometimes I would rather wait for the market to pullback then enter at the highest price of the move. I have missed moves sometimes because of this disicpline but sooner or later eventually the profit taking will bring it back down. Patience is key imo unless you don't mind buying at the high.
Also Seasonally Oil Prices normally get increased demand due to the summer driving season. I will say sometimes there are fake channel breakouts to watch out for but this one looks bullish imo.
Always use Risk Management!
(Just in case your wrong in your analysis most experts recommend never to risk more than 2% of your account equity on any given trade.)
Hope This Helps Your Trading 😃
Clifford

Crude Oil Going Higher - TA and fundamentals aligneThe 0-5 count is not over yet.
Sudo 4 and 5 are still lurking.
It's good to see how the Medianline-Set cought the Highs of the swings. Likewise we can see the subborn rejection at the Center-Line at P3.
I will not trade CL to the short side, until it's clear that P4 is engraved in this Chart. Until then, I maybe shoot for some intraday or dayli trades in Crude.
Economy Facts that support a rise, up to P4:
Crude oil refineries typically switch to producing more gasoline (fuel for cars) in the spring, particularly around March to April in the United States and other northern hemisphere countries.
Seasonal demand: Warmer months mean more driving and vacation travel, increasing gasoline demand.
Regulatory change: Refineries begin producing summer-grade gasoline, which has lower volatility and is required by environmental regulations (especially in the U.S. under EPA rules).
The switch to summer-grade gasoline must be completed by June 1st for retail and May 1st for terminals and pipelines in the U.S.
In Summary:
- Switch begins: March–April
- Completed by: May (terminals), June (retail)
- This seasonal shift is often called the "refinery maintenance season" or "spring blend switch."

CRUDE OIL: 12 JUNE, 2025 - BOTTOM AND TAKE OFF!?Conclusion: The ABC)-orange correction may have just completed, and a five-wave is pushing much higher, targeting the nearest target at the high around 94.19 or 130.50.
Details: Since the high of 130.50, a decline with A,B,C)-orange has unfolded as a Zigzag. I counted a five-wave within the A)-orange, and a triangle within the B)-orange, and finally the C)-orange has completed as a five-wave. So, perhaps that ABC has ended with convincing evidence.
So crude oil is likely to rise in the medium term, even though the alternative scenarios with relatively high probability in another development also show increasing bullish weight. And it is aiming for the nearest target at 94.19. While price must always remain above 55.30 to keep the Bullish market view valid.

WTI(20250612)Today's AnalysisMarket news:
① The EU hopes that the trade negotiations will be extended beyond the suspension period set by Trump. ② Bessant: As long as "sincerity" is shown in the negotiations, the Trump administration is willing to extend the current 90-day tariff suspension period beyond July 9. ③ Trump will hold multiple bilateral talks during the G7 summit. ④ The total customs revenue of the United States in May reached a record high of US$23 billion, an increase of nearly four times year-on-year. ⑤ Lutnick: One deal after another will be reached.
Technical analysis:
Today's buying and selling boundaries:
66.02
Support and resistance levels:
69.56
68.23
67.38
64.66
63.80
62.47
Trading strategy:
If the price breaks through 67.38, consider buying in, and the first target price is 68.23
If the price breaks through 66.02, consider selling in, and the first target price is 64.66

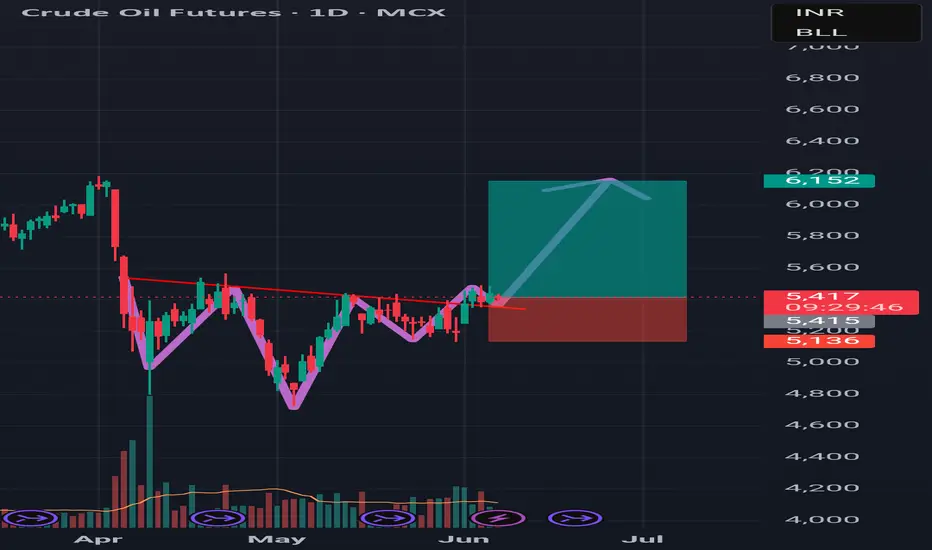
Crude Oil Triangle Breakout Near – Watch 5600 Zone Closely!🛢 CRUDEOIL – Weekly Outlook (4H Timeframe)
Published by: Shalvi Sharma (Power Commodity Trading)
Crude is trading around 5568 and approaching a crucial triangle breakout zone.
⚠️ Key Levels:
Breakout Resistance: 5600 – 5675
Bearish OB Zone: 5675 – 5800
Immediate Support: 5374 (EMA55)
Demand Zone: 5180 – 5270
🔍 Technical Outlook:
Price is compressing within a symmetrical triangle formation.
A breakout above 5600 with volume confirmation could push price towards the 5800 zone.
However, Bearish Order Block (OB) awaits near 5800 — this zone has historically rejected upside moves.
🎯 Possible Scenarios:
Bullish: Break & hold above 5600 → Upside targets: 5675 → 5740 → 5800
Bearish: Rejection at 5600 – 5675 → Downside pullback possible towards 5400 – 5374
📌 Wait for confirmation — breakout with volume will be the key driver.
Stay nimble and trade with defined risk.
#CrudeOil #MCXCrude #PowerOfCommodity #TriangleBreakout #TradingViewIndia #EnergyMarkets #TechnicalAnalysis
Comment below if you think it's bearish?

Chart Pattern Analysis Of CL1!
There are 4 candles close upon the neckline of a potential bullish triangle pattern,
It seems that another bull run will start here.
I am expecting an accelerate motive wave to touch or break up the nearest higher high at about 72USD.
On the other hand,
If K5 couldn’t close upon K4 to verify the strong bullish momentum,
It is also possible that a short-term consolidation will carry on from K3.
If the following candles successfully retest the downtrend line after a successful break up,
It is also a good place to buy it then.
Long-65.4/Stop-64.4/Target-72

Crude Oil ShortsDaily imbalance resting below, looking for price to respect daily rejection block. H6 SIBI + H1 Range. Looking simply for OTE Retracement before selling off. will look for M5 confirmation entry too.

WTI Crude Oil Stalls At Technical JunctureCrude oil has enjoyed a decent rally in recent weeks thanks to improved sentiment and OPEC+ scaling back production. Yet momentum turned against bulls on Tuesday, despite positive trade talks between the US and China. Today I discuss whether this could be a turning point for oil, or simply a bump in the road.
Matt Simpson, Market Analyst at City Index and Forex.com

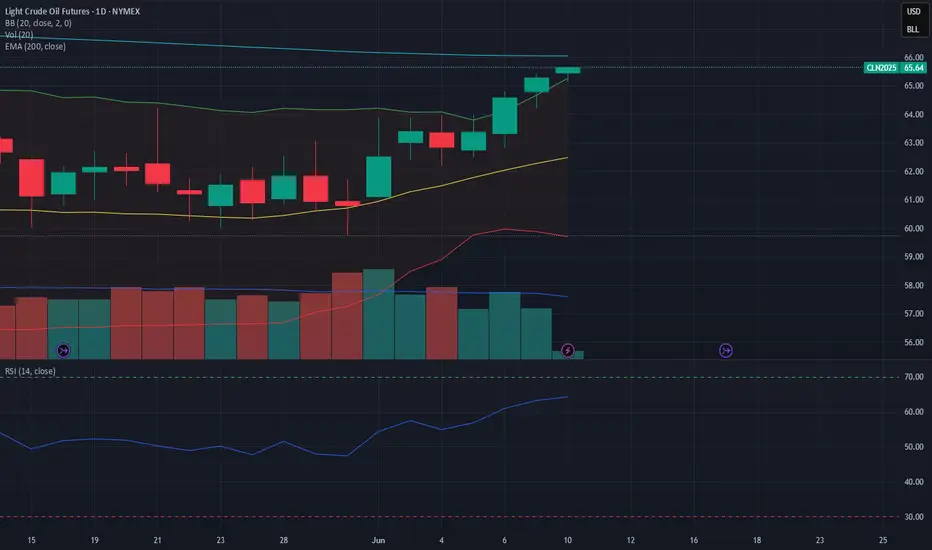
Will there be a big rise in oil prices? WTI crude futures rose to around $66.1 per barrel on Tuesday, continuing gains for the second consecutive session, as ongoing geopolitical tensions fuel concerns about a possible reduction in global supply.
Russia and Ukraine held a second round of direct peace talks after the sharp escalation of hostilities the previous day, but the discussions failed to produce any significant progress in resolving the three-year conflict.
Further intensifying supply concerns, a wildfire in Alberta, Canada, forced a temporary halt to oil and gas production. Meanwhile, OPEC+ kept its July production increase at the same level as the previous two months, easing fears of a supply surge.
In addition, an Iranian diplomat said on Monday that Iran is ready to reject the US proposal to resolve the decade-long nuclear dispute, saying it does not meet Tehran's interests or change Washington's position on uranium enrichment.
A fire in Alberta, Canada, caused a temporary disruption in oil and gas production, raising further concerns about supply. Meanwhile, OPEC+ decided to keep its July production increase at the same level as in the previous two months, easing concerns about oversupply.
Last week, OPEC+ decided to increase its combined production by an additional 411,000 barrels per day. The decision was made following expectations of a more significant increase that had affected energy stocks ahead of the group's latest meeting.
The increase was less than expected, which had a positive impact on prices, which continue to rise.
For investors in the oil sector, the worst fear is a possible repeat of a price war like the one in 2020, which led to a drastic collapse in oil prices.
This scenario is unlikely, as the US cannot afford an oil price below $50. In fact, $50 represents the break-even point for the oil sector. This situation is leading the US and Saudi Arabia towards a more cautious approach, which is why the expected significant increase in oil production did not occur last week.
A further positive sign for oil prices emerges from the analysis of the futures curve, which is currently in backwardation. Backwardation is a condition in which forward prices are lower than the current spot price, resulting in a downward slope of the forward curve. As the contract expiry date approaches, the differential between the spot price and the forward price tends to narrow, causing the curve to converge back towards the spot price.
The conditions of the futures markets are:
Normal market (contango): balanced supply and demand.
Weak demand and excess supply: amplification of contango.
Excess demand: reduction in contango to backwardation, where the difference between the near and far prices can theoretically increase indefinitely.
The recent rises, supported by above-average volumes, indicate that only exceeding the 200-period moving average could trigger a strong long trend with a target of $70 per barrel.
Recent geopolitical tensions suggest the possibility of a bullish move on oil. Iran has increased its stockpiles of enriched uranium to near weapons-grade levels in recent months, raising further doubts about the possibility of reaching an agreement with the US on Tehran's nuclear program.
Sanctions and restrictions on global oil supply will favor an increase in prices. Tensions between Russia and Ukraine continue, with mutual attacks instead of negotiations. We expect oil prices to be around $70 in the next quarter.
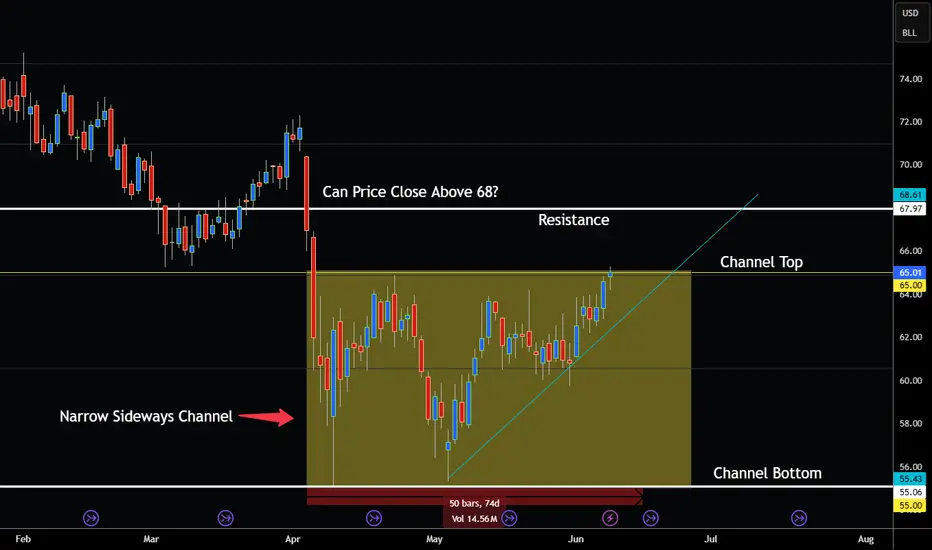
Crude Oil Stuck in Consolidation Watch for Breakout! Hey Traders so today was looking at oil market seems to be stuck in a very powerful pattern called the Narrow Sideways Channel. Basically market has been going no where for the last 75 days stuck between the highs and the lows moving back and forth moving sideways.
Most traders have probably fallen alseep because this market is boring as watching paint dry
just stuck in a range of $55-$65. I guess some traders can trade the range buy at the bottom or the channel sell near the top but imo the best way to trade is wait for a breakout of the channel.
Now if you research historical sideways channels or range markets you will find that almost every market that has ever traded sideways for more than 90 days or more led to an explosive breakout at one point in time!
Finally exciting news! That means the longer it consolidates the better for us traders to catch the breakout.
So if we look closely at the chart we can see right out of the channel top there is resistance ahead at $68. However if market can break above $68 and close above that level at the daily close that would be a serious buy signal for more upside. But don't go by intraday go by the close of the day intraday means nothing imo.
The Daily Close it all that counts!
So watch for breakout above $68 then look to buy on pullback if I does not break above $68 tje we are back to watching paint dry. 😂
Always use Risk Management!
(Just in case your wrong in your analysis most experts recommend never to risk more than 2% of your account equity on any given trade.)
Hope This Helps Your Trading 😃
Clifford
Crude oil PO3I am watching this PO3 for a while now. The invalidation for this would be below the last low and the technical target is at least the range high.

WTI(20250609)Today's AnalysisMarket news:
Fed Harker: Amid uncertainty, the Fed may still cut interest rates later this year. Musallem: There is a 50% chance that the trade war will lead to a sustained inflation outbreak. Tariffs may push up inflation within one or two quarters. The ECB cut three key interest rates by 25 basis points. Lagarde hinted that the rate cut cycle will end, and the market is no longer fully pricing in another 25 basis point rate cut this year.
Technical analysis:
Today's buying and selling boundaries:
63.43
Support and resistance levels:
65.29
64.60
64.14
62.71
62.26
61.56
Trading strategy:
If the price breaks through 64.14, consider buying in, with the first target price of 64.60
If the price breaks through 63.43, consider selling in, with the first target price of 62.71

.382 - 65.24 almost there Well I'll try a 55 m tf chart - support still hasn't updated prev but we're almost there -my daily chart from March 11 th shows bigger picture . watching if this is a bear at the .382 or how it's played - green is mid mth barn -supply to April - 65 to stay alive . keep your stick on the ice - GL

Weekly Market Forecast: BUY Stock Indices & Oil! Sell Gold! In this Weekly Market Forecast, we will analyze the S&P 500, NASDAQ, DOW JONES, Gold and Silver futures, for the week of June 9 - 13th.
Stock Indices are looking more bullish. Valid buys only!
Gold is weak. Sells only until there is a market structure shift upwards.
Oil prices have room to go higher. Buy it.
Silver is a wait and see. Should start to pull back this week, as it closed last week stronger than Gold.
CPI Wednesday. After the news is announced, the market should be very tradeable for the rest of the week.
Enjoy!
May profits be upon you.
Leave any questions or comments in the comment section.
I appreciate any feedback from my viewers!
Like and/or subscribe if you want more accurate analysis.
Thank you so much!
Disclaimer:
I do not provide personal investment advice and I am not a qualified licensed investment advisor.
All information found here, including any ideas, opinions, views, predictions, forecasts, commentaries, suggestions, expressed or implied herein, are for informational, entertainment or educational purposes only and should not be construed as personal investment advice. While the information provided is believed to be accurate, it may include errors or inaccuracies.
I will not and cannot be held liable for any actions you take as a result of anything you read here.
Conduct your own due diligence, or consult a licensed financial advisor or broker before making any and all investment decisions. Any investments, trades, speculations, or decisions made on the basis of any information found on this channel, expressed or implied herein, are committed at your own risk, financial or otherwise.

#202523 - priceactiontds - weekly update - wti crude oilGood Day and I hope you are well.
comment: Time to be very cautious as a bear and hopeful as a bull. 3 clear legs down and the third could not make a new low. Now the market closed at the weekly high and it’s a fitting place for a reversal. 65 should be the highest bears should allow it. If bulls get follow-through beyond, this is a buy with stop 59.5. The target above 65 is obviously 70 and maybe even the bigger bear trend line around 73.
current market cycle: monthly time frame is a broad bear channel - weekly tf is a bear wedge - daily is a trading range
key levels: 59 - 65
bull case: Bulls got their first daily close above the weekly20 ema since February. Bears tried to get the market below 60 but failed to keep it below - 3 times now since April. Markets will try one thing only so much until they try something else. 65 is the next target which will likely get hit early next week but I expect a bit more sideways until one side clearly gives up. Technically this is a double bottom April/May lows and now a higher low and bulls want to get the major trend reversal.
Invalidation is below 65.5
bear case: Bears are hopeful that the bear wedge is still enough resistance that we test down to 60 but they need a strong reversal below 65 to make it happen and when a weekly bar closes at the very high, it’s probably not a good time to be a bear. Best bears can hope for here is to stay below 65 and continue inside the current range 60-65.
Invalidation is above 65.5
short term: Bullish. I think a bull breakout is much more likely than hitting 60 again. Buying 64.58 with a stop 59.5 is likely a decent trade already. Confirmation for the breakout is 65.5ish.
medium-long term - Update from 2025-06-08: Market finds no acceptance below 60 since 2021 and now we have 3 clear legs down, a higher low and a breakout above prior high with a weekly close at the highs and the weekly 20ema. This is likely as good of a swing long as you can get.

Crude. Daily Internal to External Range Liquidity. 06.06.25Covering the crude expansion from daily internal towards the first external range liquidity

Crude oil-----Sell near 64.00, target 63.00-62.00Crude oil market analysis:
Crude oil is still bearish, and we will continue to sell on rebounds. If it does not break 65.00, it will fluctuate. The general trend is bearish. If it breaks, we will adjust our thinking. Today's crude oil is the key. Will it start to take off before the data? The previous crude oil inventory data did not allow crude oil to break the position. The crude oil fluctuation range is 60.00-65.00. If it breaks this range, we will adjust our thinking on fluctuations.
Operational suggestions
Crude oil-----Sell near 64.00, target 63.00-62.00

Long On CrudeI hold a strong conviction that in July Oil prices may soar above current trading levels

REVERSE HEAD AND SHOULDER PATTERNSCrude oil looks good can go long with Stoploss. Bigbreakout expected
WTI(20250606)Today's AnalysisMarket news:
The European Central Bank cut three key interest rates by 25 basis points. Lagarde hinted that the rate cut cycle will end, and the market is no longer fully pricing in another 25 basis point rate cut this year.
Technical analysis:
Today's buying and selling boundaries:
62.58
Support and resistance levels:
63.97
63.45
63.12
62.05
61.71
61.19
Trading strategy:
If the price breaks through 63.12, consider buying, and the first target price is 63.45
If the price breaks through 62.58, consider selling, and the first target price is 62.05

CL SELLSELL CL at 71.0000 or 68.000, riding it down to 55.5000 to 51.0000 as Profit Targets, Stop Loss is at 73.0000!
Warning: This is only for entertainment and opinion purpose. Trading is a risky business, so do your own due diligence, and trade at your own risk. You can loose all of your money and much more.
