WTI USOIL WEEKLY CHARTKey Offshore Oil and Gas Installations at Risk of Iranian Attack
Based on recent escalations and Iran's retaliatory capabilities, the following offshore installations are most vulnerable:
Strait of Hormuz Infrastructure
Why at risk: A critical global chokepoint handling 21 million barrels of oil daily. Iran has repeatedly threatened closure if provoked.
Potential targets: Tanker routes, underwater pipelines, and monitoring stations.
Qatar’s North Field Gas Facilities
Why at risk: Directly adjacent to Iran’s South Pars field (recently attacked by Israel). Shared reservoirs mean disruptions could cascade.
Vulnerability: Iran could target Qatari platforms to amplify global gas shortages.
Saudi/UAE Offshore Fields
Key sites:
Saudi Arabia’s Safaniya (world’s largest offshore oil field).
UAE’s Upper Zakum oil field.
Why at risk: Iran views Gulf states as Israeli allies; striking them would disrupt U.S.-aligned economies.
Israeli Mediterranean Gas Rigs
Leviathan and Tamar fields:
Provide 90% of Israel’s electricity.
Already targeted by Iranian proxies (e.g., Hezbollah rockets in 2023).
Bahrain/Kuwait Offshore Facilities
Strategic value: Proximity to Iran enables rapid drone/missile strikes. Past attacks (e.g., 2019 Aramco) demonstrate capability.
Why These Targets?
Retaliatory logic: Iran’s energy infrastructure (e.g., South Pars) was damaged by Israeli strikes. Targeting adversaries’ assets aligns with its "escalate to deter" strategy.
Global leverage: Disrupting Hormuz or major fields could spike oil prices 30–50%, pressuring Western governments.
Technical feasibility: Iran’s naval drones, cruise missiles, and mines can penetrate offshore defenses.
Immediate Threats
Target Risk Level Potential Impact
Strait of Hormuz Critical Global oil prices surge; 20% of LNG shipments halted
Qatar’s North Field High 10% of global LNG supply disrupted; Europe/Asia energy crisis
Israeli Gas Rigs High Israel’s energy security crippled; regional conflict escalation
Conclusion
Iran’s most likely retaliation targets are offshore installations in the Strait of Hormuz, Qatar, and Israeli Mediterranean fields, leveraging proximity and asymmetric tactics. Such attacks would aim to inflict maximum economic damage while avoiding direct confrontation with the U.S. or NATO. Global energy markets face severe disruption if hostilities escalate further.
A successful breakout above this descending trendline and resistance zone (near $74–$75) would confirm a bullish reversal, potentially opening the way for further upside toward $80 and $100 as next target.
US crude inventories have declined recently, reducing oversupply fears and supporting prices.
Global oil demand is forecast to grow by 720,000 barrels per day in 2025, while supply increases are more modest.
OPEC+ decisions to maintain production cuts or limit increases have also contributed to price support.
Summary
Oil prices are testing and potentially breaking out of a long-term descending trendline formed since mid-2022.
breakout will be long buy hope that we see 80$ per barrel.
#usoil #oil
WTICOUSD trade ideas

Diversion def high_accuracy_signal(df):
df = df .rolling(10).mean()
df = df .rolling(50).mean()
df = compute_rsi(df , 14)
df = df .rolling(5).mean()
df = (
(df > df ) &
(df > 55) & (df < 70) &
(df > 2 * df )
)
return df [ ]
def compute_rsi(series, period=14):
delta = series.diff()
gain = delta.where(delta > 0, 0)
loss = -delta.where(delta < 0, 0)
avg_gain = gain.rolling(period).mean()
avg_loss = loss.rolling(period).mean()
rs = avg_gain / avg_loss
rsi = 100 - (100 / (1 + rs))
return rsi

USOIL: Strong Bearish Sentiment! Short!
My dear friends,
Today we will analyse USOIL together☺️
The in-trend continuation seems likely as the current long-term trend appears to be strong, and price is holding below a key level of 73.969 So a bearish continuation seems plausible, targeting the next low. We should enter on confirmation, and place a stop-loss beyond the recent swing level.
❤️Sending you lots of Love and Hugs❤️

WTI POSSIBLE TRADE SETUPPotential Trade Setup on WTI
WTI has been on a strong 2-week rally, following the geopolitical escalation where Israel launched a preemptive attack on Iran. This event sparked a 2% surge, keeping prices hovering around $77 for the past two weeks.
Despite the bullish momentum, I am anticipating a healthy pullback before looking to engage.
My eyes are on two key zones:
- April High Region (Previous resistance turned support)
- 50% Fibonacci Retracement (Measured from recent rally low to high)
🧭 Trading Plan:
1. BUY: is currently the only play, and as I anticipate for a two-level of pullback on the 4H chart.
🟢 Risk-to-Reward:
Targeting 1:3 R/R on either entry.

Analysis of crude oil trend next week, hope it helps youNext Week's Crude Oil Trend Analysis
(1) Price Movement and Market Sentiment
The crude oil market on last Friday (June 21) resembled a roller coaster that slightly dipped at the end. WTI crude oil futures closed at $74.93 per barrel, down 0.28% from the previous day, but still up 2.67% for the entire week; Brent crude oil fell more, dropping 2.33% to close at $77.01 per barrel. This is analogous to driving uphill, slightly sliding back near the peak but still trending upward overall. Investors now have mixed feelings: while worrying that escalating Middle East tensions will push oil prices higher, they also believe the U.S. may not intervene in the conflict immediately, so oil prices may not rise temporarily. As a result, everyone is on the sidelines, hesitant to trade.
(2) Geopolitics: Where is the Switch on the Powder Keg?
The Middle East is now like a barrel filled with gunpowder, and whether the U.S. will throw a match has become crucial. Israel and Iran are still attacking each other—Israel bombed Iran's gas fields, and Iran struck Israel's refineries. More tensely, the U.S. said it would decide whether to join the conflict in the next two weeks, and five aircraft carriers have already headed to the Middle East, like placing a lighter beside the powder keg, ready to ignite the fire at any moment. However, the market thought the U.S. might not take action immediately last Friday, so oil prices fell slightly first.
There is also the critical Strait of Hormuz. Iran has been threatening to block it. If it actually does, 20% of global maritime crude oil transportation will be affected, and oil prices may soar like a rocket. Now the market is like watching a suspense movie, not knowing when Iran will press the "blockade" button or talk about a ceasefire with Europe.
Next week's crude oil market will swing between geopolitical risks and supply-demand changes. If Middle East conflicts ease, the impact of OPEC+ production increases may emerge, and oil prices may fall; if conflicts escalate, especially if Iran blocks the Strait of Hormuz, oil prices may rise sharply. Investors should flexibly adjust their trading strategies according to the actual market conditions and not stubbornly adhere to one view. At the same time, it is necessary to stay calm, not be affected by short-term market fluctuations, and avoid making impulsive trading decisions.
Analysis of crude oil trend next week, hope it helps you
USOIL sell@74.5~75
SL:76
TP:73.5~73

Weekly crude oil chart shows continued bullish outlook.Last week's candlestick chart closed with a strong bullish candle at the channel's upper boundary. This week's close formed a pin bar.
Two consecutive weeks of candlestick patterns.Creating a Harami pattern
Strong bullish signals
Patiently observe market developments.

USOIL BEST PLACE TO SELL FROM|SHORT
USOIL SIGNAL
Trade Direction: short
Entry Level: 73.94
Target Level: 72.14
Stop Loss: 75.12
RISK PROFILE
Risk level: medium
Suggested risk: 1%
Timeframe: 2h
Disclosure: I am part of Trade Nation's Influencer program and receive a monthly fee for using their TradingView charts in my analysis.
✅LIKE AND COMMENT MY IDEAS✅

Analysis of crude oil trend next week, hope it helps youThe Middle East currently resembles a barrel filled with gunpowder, ready to explode at any moment. Israel and Iran continue to attack each other—Israel bombed Iran's nuclear facilities, while Iran fired missiles at Israeli cities. More worryingly, the U.S. may decide to join the conflict within the next two weeks, and five U.S.-UK aircraft carriers are converging on the Middle East, akin to lighting a match beside the powder keg. However, Iran has also held talks with European nations in Geneva, stating that if Israel halts its attacks first, it is willing to discuss nuclear issues. This creates a paradox: while the risk of war grows, there is also hope for negotiations—similar to two market factions, one fearing war will drive oil prices higher, and the other believing talks could push prices down.
The Strait of Hormuz, a critical global oil transport corridor, sees massive oil shipments pass through daily. Iran has repeatedly threatened to block the strait, and if it does, oil prices could skyrocket like a rocket. So far, however, Iran has not taken such action, and the market is watching closely to see if it will.
Trading Strategy
If oil prices rebound to the $74.5–$75 range and candlestick charts show prices stalling (forming consecutive long upper shadows) with trading volume decreasing rather than increasing, consider opening light short positions with 25% of funds. When prices retreat to $73.5, close 40% of short positions to take profits. If prices continue to fall, hold the remaining short positions for a target of $72.5. However, if prices break through $76, immediately trigger a stop loss to prevent further losses from a potential upward trend.
Analysis of crude oil trend next week, hope it helps you
USOIL sell@74.5~75
SL:76
TP:73.5~73

USOILKey Offshore Oil and Gas Installations at Risk of Iranian Attack
Based on recent escalations and Iran's retaliatory capabilities, the following offshore installations are most vulnerable:
Strait of Hormuz Infrastructure
Why at risk: A critical global chokepoint handling 21 million barrels of oil daily. Iran has repeatedly threatened closure if provoked.
Potential targets: Tanker routes, underwater pipelines, and monitoring stations.
Qatar’s North Field Gas Facilities
Why at risk: Directly adjacent to Iran’s South Pars field (recently attacked by Israel). Shared reservoirs mean disruptions could cascade.
Vulnerability: Iran could target Qatari platforms to amplify global gas shortages.
Saudi/UAE Offshore Fields
Key sites:
Saudi Arabia’s Safaniya (world’s largest offshore oil field).
UAE’s Upper Zakum oil field.
Why at risk: Iran views Gulf states as Israeli allies; striking them would disrupt U.S.-aligned economies.
Israeli Mediterranean Gas Rigs
Leviathan and Tamar fields:
Provide 90% of Israel’s electricity.
Already targeted by Iranian proxies (e.g., Hezbollah rockets in 2023).
Bahrain/Kuwait Offshore Facilities
Strategic value: Proximity to Iran enables rapid drone/missile strikes. Past attacks (e.g., 2019 Aramco) demonstrate capability.
Why These Targets?
Retaliatory logic: Iran’s energy infrastructure (e.g., South Pars) was damaged by Israeli strikes. Targeting adversaries’ assets aligns with its "escalate to deter" strategy.
Global leverage: Disrupting Hormuz or major fields could spike oil prices 30–50%, pressuring Western governments.
Technical feasibility: Iran’s naval drones, cruise missiles, and mines can penetrate offshore defenses.
Immediate Threats
Target Risk Level Potential Impact
Strait of Hormuz Critical Global oil prices surge; 20% of LNG shipments halted
Qatar’s North Field High 10% of global LNG supply disrupted; Europe/Asia energy crisis
Israeli Gas Rigs High Israel’s energy security crippled; regional conflict escalation
Conclusion
Iran’s most likely retaliation targets are offshore installations in the Strait of Hormuz, Qatar, and Israeli Mediterranean fields, leveraging proximity and asymmetric tactics. Such attacks would aim to inflict maximum economic damage while avoiding direct confrontation with the U.S. or NATO. Global energy markets face severe disruption if hostilities escalate further.
A successful breakout above this descending trendline and resistance zone (near $74–$75) would confirm a bullish reversal, potentially opening the way for further upside toward $80 and $100 as next target.
US crude inventories have declined recently, reducing oversupply fears and supporting prices.
Global oil demand is forecast to grow by 720,000 barrels per day in 2025, while supply increases are more modest.
OPEC+ decisions to maintain production cuts or limit increases have also contributed to price support.
Summary
Oil prices are testing and potentially breaking out of a long-term descending trendline formed since mid-2022.
A confirmed breakout above the $74–$75 resistance zone would mark a bullish reversal, supported by tightening supply, geopolitical risks, and improving demand.
Traders should watch for confirmation signals and potential corrective pullbacks before further upside.
Failure to hold above key support levels could resume the downtrend.
#usoil #oil

Crude Oil BreakoutOil has been in a descending wedge pattern for quite a while, the last 19 months or so. It is just now breaking out, price target is between $100-$110 a barrel but could go higher we will have to see how inflation progresses.

OIL 2 Best Places For Buy Very Clear , Don`t Miss This 1000 PipsHere is my opinion on oil , we have a very aggressive movement to upside and this is normal right now , i`m looking to buy this Pair if the price go back to retest my support and this will be the best place to buy it for me , and if the price moved directly without retest it i will wait the price to break the other res and then i can enter a buy trade and targeting the highest level the price touch it , also if the price go back to retest my support and go up and closed above the other res i will add one more entry with the same target.

ALL EYES ON WTI Nice and simple: If this breaks up, Stocks and Crypto Dump. If this rejects, nice pump incoming...
What happens in the Strait.. will dictate all...

TP REACHED ON OUR TRADE ON OILThis morning I posted to sell on Crude Oil, and our TP got filled to close the week with 5 profitable days strike.
Follow for more!

USOIL:Waiting to go long
The impact of the news is still continuing, the situation did not ease in a short period of time, there is still a rise, the above large space to see 76-77, trading ideas on the long space and advantages are greater. Intraday short - term trading to consider low long.
Trading Strategy:
BUY@72.8-73.2
TP: 74.5-75
More detailed strategies and trading will be notified here ↗↗↗
Keep updated, come to "get" ↗↗↗

USOIL may saturated and is about to swing downUSOIL may reach a saturation point and is likely to swing down, at least in the Short Term.
Technically, the price has tested the upper boundary of the descending channel near the key psychological resistance at $75 per barrel but failed to close above it, despite a brief breakout. This reflects the strength of the 75 resistance zone.
Moreover, the RSI entered the overbought zone, and Bearish Divergence between price and RSI occured, which further increases the probability of a correction.
Therefore, at this stage, crude oil prices potentially pull back to the $70 level before determining the next directional move.
From a fundamental perspective, the recent surge in oil prices has been primarily driven by geopolitical tensions in the Middle East.
However, historically, the situation tends to cause only short-lived spikes in oil prices. Sustainable gains in oil prices require real demand support. Although the conflict persists, markets are less reactive, likely due to the absence of supply chain disruptions or transport route closures.
Additionally, the US decision to hold the strike and increase diplomat time has given investors time to adjust their portfolios, potentially for profit-taking from previously accumulated long positions.
As a result, oil prices may pull back during this period.
Now, considering the long-term factors, there are several reasons why oil prices are unlikely to rise significantly beyond The current levels:
Oversupply:
Global crude oil production has been increasing, particularly from non-OPEC+ countries such as the United States, Canada, and Brazil. At the same time, OPEC+ members have been gradually raising their output as well, resulting in a market where supply exceeds demand.
Sluggish Demand Growth:
Oil demand is growing slowly due to a lackluster global economic outlook, the rising adoption of electric vehicles, and ongoing efforts to reduce fossil fuel consumption. Additionally, increasing risks such as new taxation and geopolitical tensions have led to investment slowdowns in certain regions.
Rising Inventories:
Global oil stockpiles have been steadily increasing, exerting downward pressure on prices.
Major entities have released their West Texas Intermediate (WTI) crude oil price forecasts for 2025 and 2026. J.P. Morgan projects prices at $66 per barrel for 2025 and $58 for 2026. The U.S. Energy Information Administration (EIA) offers a slightly different outlook, forecasting $62 per barrel in 2025 and $59 in 2026. Meanwhile, Trading Economics anticipates a price of $63.28 by the end of Q2 2025, rising to $65.70 in 2026.
Analysis by: Krisada Yoonaisil, Financial Markets Strategist at Exness

SELL USOILIt’s been a while since I last posted about American market.
You can sell USOIL, the target is the daily Liquidity high and the stop is at the PVH of the reversal.
Follow for more!

A QUICK SELL OPPORTUNITY ON USOILPrice might drop further after we saw a sharp from $75 per barrel. A sell opportunity is envisaged from the current market price. Target profit is at 72.146

Can Crude Oil Spike to 150 USD / bbl ? Scenario Analysis.With Mid East tensions rising and overall unpredictable
situation around Strait of Hormuz, let's review potential
scenarios for the Crude Oil Prices. I've outlined three
scenarios with projected oil prices for each scenario below.
🚨 Market Alert: Israel-Iran Conflict Impact Forecast 📈
🔴 Worst-Case Scenario: Regional War + U.S. Military Involvement
🚢 Oil (Brent): Soars to $150–$200+ if Strait of Hormuz closes
🥇 Gold: Skyrockets to $4,500–$5,000 (safe-haven rush)
₿ Bitcoin: Initial volatility; settles at $80k–$100k
📉 SPX: Crashes to 4,000–4,500
💻 NDX: Drops sharply to 15,000–16,000
🟠 Base-Case Scenario: Protracted Tension, No Major Disruption
🛢 Oil: Stabilizes at elevated $75–$95, occasional spikes
🥇 Gold: Moves higher, trading $3,500–$3,800
₿ Bitcoin: Trades steady, $90k–$110k range
📊 SPX: Pullback moderate, around 5,200–5,500
💻 NDX: Moderately lower, 18,000–19,000 range
🟢 Best-Case Scenario: Diplomatic De-Escalation
🌊 Oil: Eases down to $65–$75
🥇 Gold: Mild decline, holds at $3,300–$3,500
₿ Bitcoin: Positive sentiment, lifts to $100k–$120k
📈 SPX: Slight dip; stays strong near 5,800–6,200
💻 NDX: Minor correction, remains high at 20,000–22,000

Bullish continuation?WTI Oil (XTI/USD) is falling towards the pivot which has been identified as a pullback support and could bounce to the 1st resistance.
Pivot: 73.41
1st Support: 70.19
1st Resistance: 77.67
Risk Warning:
Trading Forex and CFDs carries a high level of risk to your capital and you should only trade with money you can afford to lose. Trading Forex and CFDs may not be suitable for all investors, so please ensure that you fully understand the risks involved and seek independent advice if necessary.
Disclaimer:
The above opinions given constitute general market commentary, and do not constitute the opinion or advice of IC Markets or any form of personal or investment advice.
Any opinions, news, research, analyses, prices, other information, or links to third-party sites contained on this website are provided on an "as-is" basis, are intended only to be informative, is not an advice nor a recommendation, nor research, or a record of our trading prices, or an offer of, or solicitation for a transaction in any financial instrument and thus should not be treated as such. The information provided does not involve any specific investment objectives, financial situation and needs of any specific person who may receive it. Please be aware, that past performance is not a reliable indicator of future performance and/or results. Past Performance or Forward-looking scenarios based upon the reasonable beliefs of the third-party provider are not a guarantee of future performance. Actual results may differ materially from those anticipated in forward-looking or past performance statements. IC Markets makes no representation or warranty and assumes no liability as to the accuracy or completeness of the information provided, nor any loss arising from any investment based on a recommendation, forecast or any information supplied by any third-party.

Today's crude oil trading strategy, I hope it will be helpful to Crude Oil Trend Analysis
(1) Geopolitics: Tensions Propel Oil Price Expectations
The Middle East has long been a "powder keg" for the crude oil market, and recent developments have intensified tensions. Military conflicts between Iran and Israel continue to escalate—Iran’s latest attacks injured approximately 50 people in Israel. Controlling the Strait of Hormuz, through which 30% of global seaborne crude oil passes, Iran’s strategic position is pivotal. After the conflict escalated, Iran threatened to block the strait, instantly igniting international oil prices. Brent crude surged to around $79 per barrel. As long as the conflict persists, market fears of crude supply disruptions—like an invisible hand—will continue to underpin price gains.
(2) Supply Side: Interplay of Production Increases and Geopolitical Risks
OPEC+ previously announced plans to increase production by 411,000 barrels per day, but actual output growth has fallen short of market expectations. With current Middle East tensions, the feasibility of this plan remains uncertain. If Iran’s crude production and exports are constrained by the conflict, global supply could tighten. In the U.S., shale oil production remains unstable, affected by technical, cost, and policy factors. Thus, the supply side is fraught with uncertainty: production increase expectations may exert downward pressure on prices, while geopolitical risks could tighten supply outlooks and push prices higher.
(3) Demand Side: Battle Between Seasonality and Economic Prospects
From a seasonal perspective, the northern hemisphere’s summer travel peak has boosted demand for petroleum products like gasoline and jet fuel. Data from the U.S. Energy Information Administration (EIA) shows U.S. crude oil inventories have declined for several consecutive weeks, indicating rising market demand. However, the global economic environment remains bleak: trade protectionism, tariff policies, and other factors have slowed global growth, constraining crude demand. Major economies like China and Europe have failed to meet oil demand projections. Thus, the demand side is torn: seasonal factors provide support, but economic headwinds act as a drag.
Today's crude oil trading strategy, I hope it will be helpful to you
USOIL BUY@72.5~73
SL:71.5
TP:74~75

Oil diggers?🚀💥 OIL-DIGGERS, where you at?!
WTI delivered a picture-perfect reversal off the ELFIEDT – X-REVERSION signal, printing a clean “UP” just before price launched over 300 ticks straight up!
This is what happens when you combine exhaustion, momentum shift, and smart signal logic — early entries, minimal risk, and maximum juice.
🎯 SL below the signal candle. No hesitation. Just execution.
🛢️ If you trade oil and didn’t catch this one… it’s time to add this tool to your chart.
#WTI #OilTrading #Reversion #ELFIEDT #SmartMoneyMoves #TradingViewScripts #TrendReversal #CrudeOil

WTI Oil H1 | Overlap resistance at 61.8% Fibonacci retracementWTI oil (USOIL) is rising towards an overlap resistance and could potentially reverse off this level to drop lower.
Sell entry is at 76.02 which is an overlap resistance that aligns closely with the 61.8% Fibonacci retracement.
Stop loss is at 78.00 which is a level that sits above a multi-swing-high resistance.
Take profit is at 71.40 which is a swing-low support that aligns closely with the 78.6% Fibonacci retracement.
High Risk Investment Warning
Trading Forex/CFDs on margin carries a high level of risk and may not be suitable for all investors. Leverage can work against you.
Stratos Markets Limited (tradu.com ):
CFDs are complex instruments and come with a high risk of losing money rapidly due to leverage. 63% of retail investor accounts lose money when trading CFDs with this provider. You should consider whether you understand how CFDs work and whether you can afford to take the high risk of losing your money.
Stratos Europe Ltd (tradu.com ):
CFDs are complex instruments and come with a high risk of losing money rapidly due to leverage. 63% of retail investor accounts lose money when trading CFDs with this provider. You should consider whether you understand how CFDs work and whether you can afford to take the high risk of losing your money.
Stratos Global LLC (tradu.com ):
Losses can exceed deposits.
Please be advised that the information presented on TradingView is provided to Tradu (‘Company’, ‘we’) by a third-party provider (‘TFA Global Pte Ltd’). Please be reminded that you are solely responsible for the trading decisions on your account. There is a very high degree of risk involved in trading. Any information and/or content is intended entirely for research, educational and informational purposes only and does not constitute investment or consultation advice or investment strategy. The information is not tailored to the investment needs of any specific person and therefore does not involve a consideration of any of the investment objectives, financial situation or needs of any viewer that may receive it. Kindly also note that past performance is not a reliable indicator of future results. Actual results may differ materially from those anticipated in forward-looking or past performance statements. We assume no liability as to the accuracy or completeness of any of the information and/or content provided herein and the Company cannot be held responsible for any omission, mistake nor for any loss or damage including without limitation to any loss of profit which may arise from reliance on any information supplied by TFA Global Pte Ltd.
The speaker(s) is neither an employee, agent nor representative of Tradu and is therefore acting independently. The opinions given are their own, constitute general market commentary, and do not constitute the opinion or advice of Tradu or any form of personal or investment advice. Tradu neither endorses nor guarantees offerings of third-party speakers, nor is Tradu responsible for the content, veracity or opinions of third-party speakers, presenters or participants.

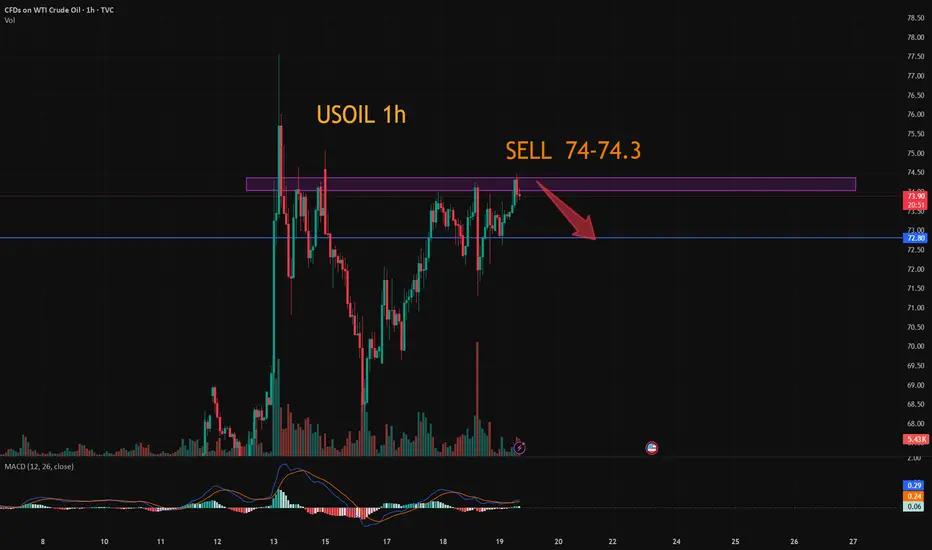
USOIL:The trading strategy of going short
USOIL: Consider shorting for now, as there are signs of a top above 74.5, but I think this is only a short-term high and will continue to surge higher. The trading idea is to sell short today and wait for the right position to be long.
Trading Strategy:
SELL@74-74.3
TP: 73.2-72.7
↓↓↓ More detailed strategies and trading will be notified here ↗↗↗
↓↓↓ Keep updated, come to "get" ↗↗↗