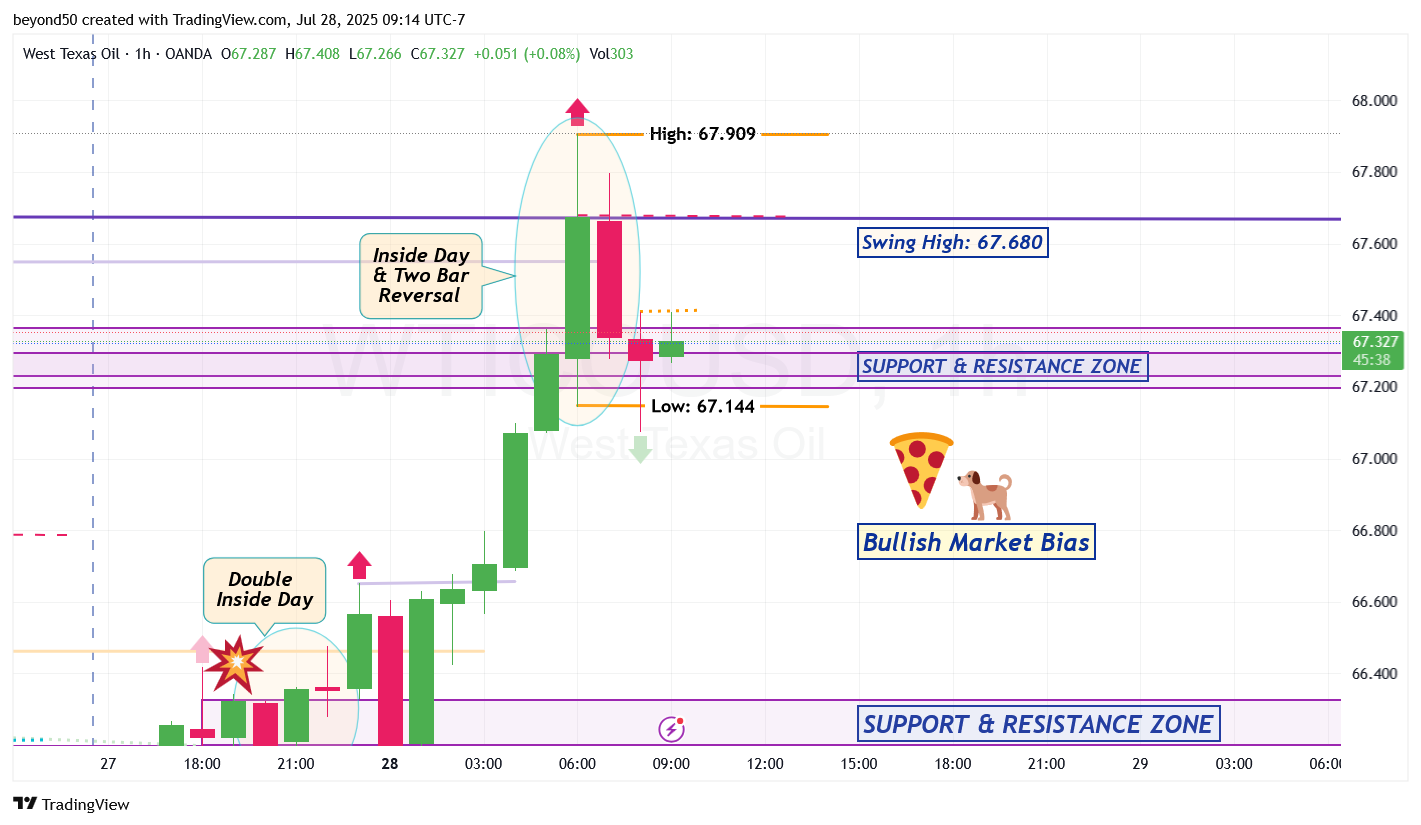
WTICOUSD Usually after a long trend, which was the bullish one earlier, the market wants to take a pause, which it's doing now.
On the Hourly, the candles are consolidating within an Inside Day pattern, which signifies a market pause with no clear direction until a breakout from either the pattern's high at 67.909 or low of 67.144 (shown as orange lines).
Watch for a true and not a fake breakout. If a fake one, then you'll see an opposite colored candle show up to counter the breakout.
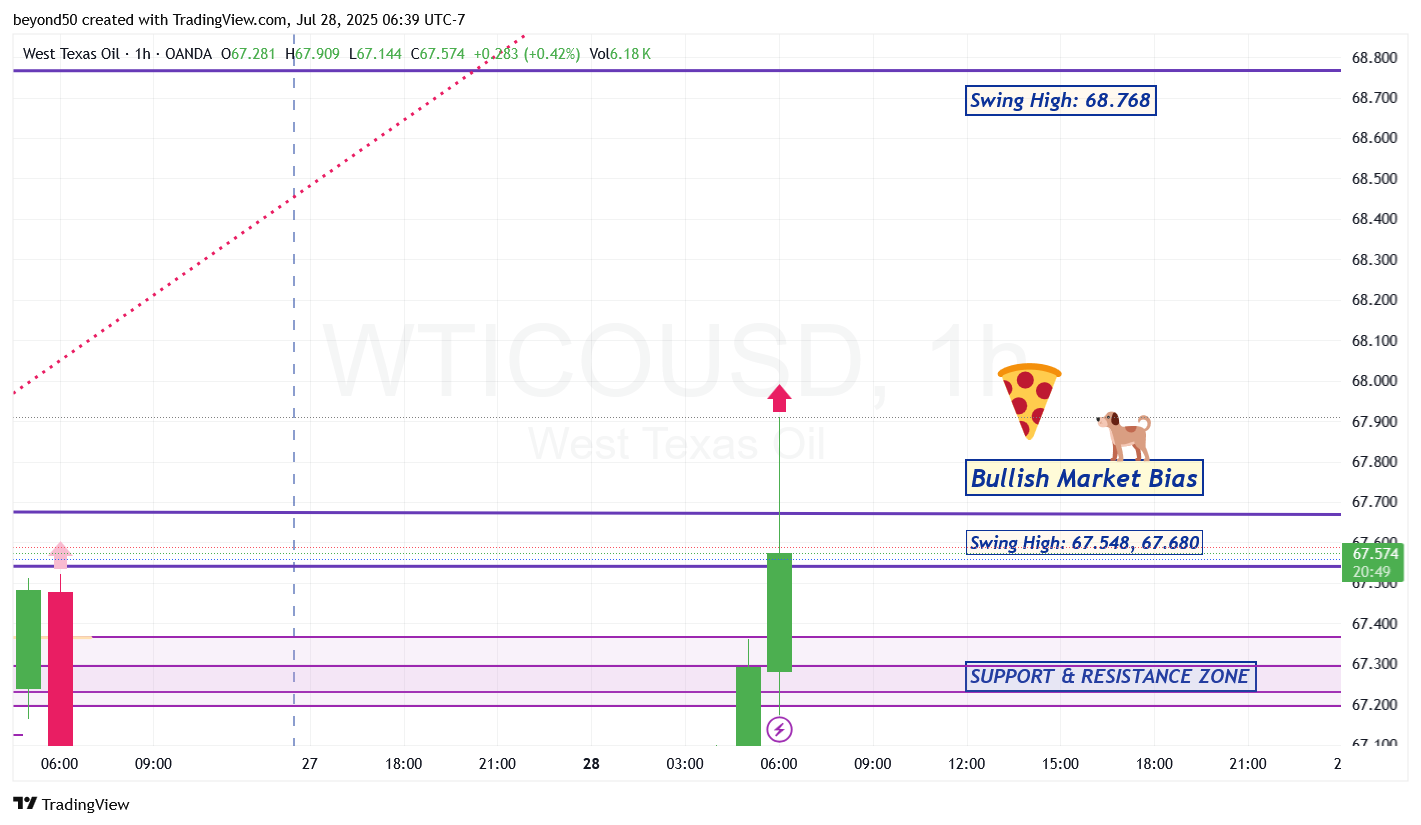
WTICOUSD What's Above? On the Hourly, the bulls are rallying with slower momentum. Let's see if they have it within them to breach the Swing Highs of 67.548 and 67.680. With a candle close on these prices, it reinforces the Bullish (directional) Market Bias for more moves to the upside.
But if the bulls can't even breach the Swing High of 67.548, then back down for a retracement towards 66.691 (based on mean reversion) and rally again after that.