SILVER (XAGUSD): Bearish Correction ContinuesI believe that 📉SILVER could continue to decline after breaking below the support level of a consolidation within a horizontal trading range,
which is now acting as resistance.
Additionally, I observe a bearish engulfing candle following the test of the broken structure on the 4H timeframe.
Tar
About Silver / U.S. Dollar
Silver Prices have been followed for centuries. Silver (XAG) is a precious metal used in jewelry, silverware, electronics, and currency. Silver prices are widely followed in financial markets around the world. Silver has been traded for thousands of years and was once used for currency backing. Silver continues to be one of the most commonly traded commodities today. Silver prices are highly volatile due to speculation and supply and demand. Ag is the chemical symbol for silver on the periodic table of elements and its ISO currency symbol is XAG.

11.08.25 Morning ForecastPairs on Watch -
FX:USDCAD
FX:GBPAUD
FX:CADJPY
OANDA:XAGUSD
A short overview of the instruments I am looking at for today, multi-timeframe analysis down to what I will be looking at for an entry. Enjoy!

Silver at a Crossroads – 38.50 Break or 38.00 Collapse?Right now, Silver is worth keeping on the radar.
After falling from multi-year highs near 40 down to 36.20, the metal reversed and broke above both the falling trendline from the top and the 37.80 resistance.
Similar to Gold, the final sessions of last week were marked by range trading, with a cle

XAGUSD H4 | Bullish bounce off 38.2% Fibonacci support?Based on the H4 chart analysis, we could see the price fall to the buy entry which is a pullback support that aligns with the 38.2% Fibonacci retracement and could bounce from this level to the upside.
Buy entry is at 37.67, which is a pullback support that lines up with the 38.2% Fibonacci retrace

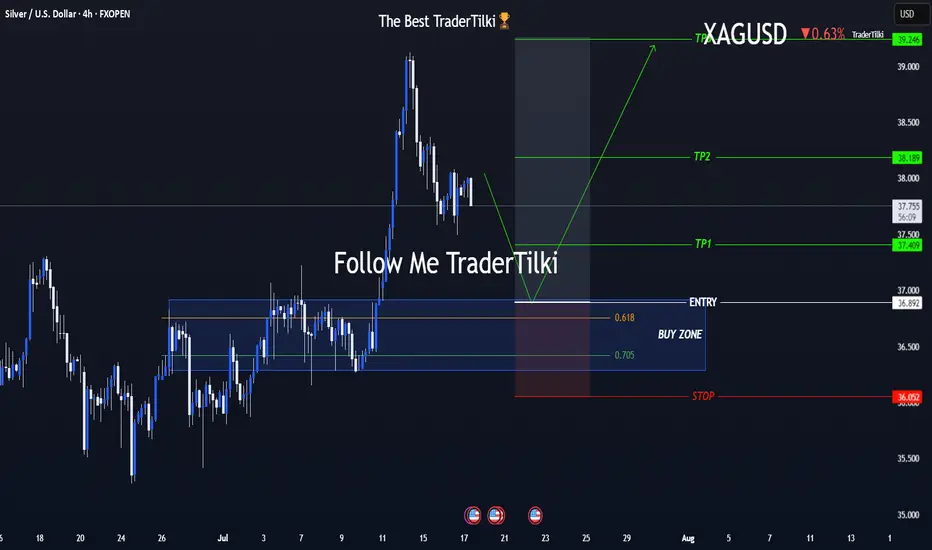
One Shot, Clear Strategy – Silver Buy Zone in SightHey everyone 👋
📌 BUY LIMIT ORDER / XAGUSD-SILVER Key Levels
🟢 Entry: 36,892
🎯 Target 1: 37,409
🎯 Target 2: 38,189
🎯 Target 3: 39,246
🔴 Stop: 36,052
📈 Risk/Reward Ratio: 2,79
I double-checked the levels and put together a clean, focused analysis just for you. Every single like seriously boost
XAGUSD: Correction May Be Over – Watch $37.60 BreakoutAfter reaching a local top around the $39.50 zone on July 24, Silver entered a normal corrective phase, with price dropping over 3,000 pips from top to bottom — roughly an 8% retracement.
📉 Despite the strength of the drop, the structure was clearly corrective, not impulsive. Even more, the move fo

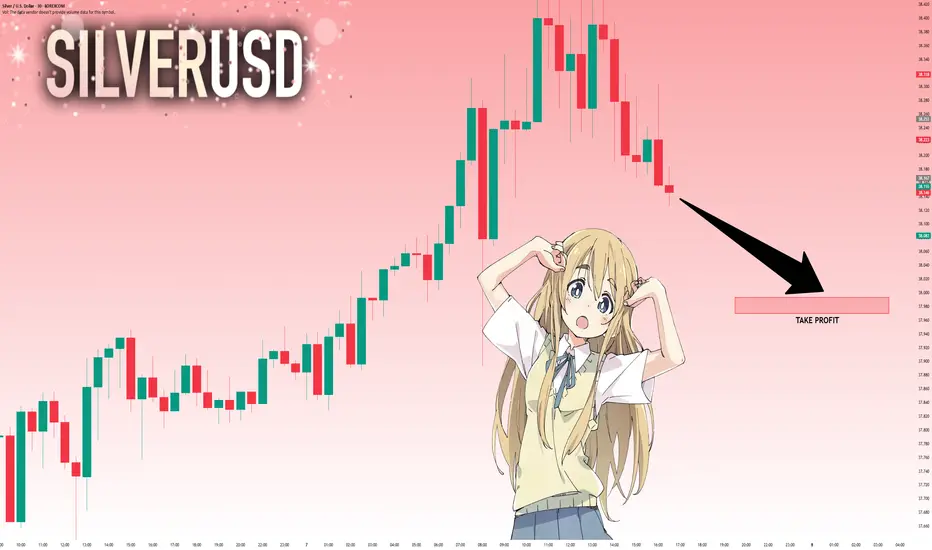
SILVER: Strong Bearish Sentiment! Short!
My dear friends,
Today we will analyse SILVER together☺️
The recent price action suggests a shift in mid-term momentum. A break below the current local range around 38.167 will confirm the new direction downwards with the target being the next key level of 37.993.and a reconvened placement of
SILVER WILL GO UP|LONG|
✅SILVER is going up
Now and the pair made a bullish
Breakout of the key horizontal
Level of 37.73$ and the breakout
Is confirmed so we are bullish
Biased and we will be expecting
A further bullish move up
LONG🚀
✅Like and subscribe to never miss a new idea!✅

Once in a life time baby!I have shown you this many times.
All you need to understand about silver is that it tracks gold's trend versus inflation.
And yeah, these are also possibly the greatest combo of yearly chart breakouts (silver pending 2025 close) you will ever see.
Once in a life time baby!

"THE SILVER JOB" // $XAG/USD ROBBERY PLAN UNLOCKED🚨SILVER HEIST LOADING... BULLS ON THE MOVE! 💥 XAG/USD THIEF PLAN 💰🐂
Asset: XAG/USD “The Silver”
📈 Plan: Bullish Thief Raid
🎯 Target Zone: 40.000 – “Police Barricade Resistance” + Overbought Hotspot
🛑 Stop Loss: 37.500 – Vault Alarm Level
💼 Entry: “Anywhere, Anytime” – The thief is layering his limit

See all ideas
Displays a symbol's price movements over previous years to identify recurring trends.