Silver (XAG/USD) Bullish Trade Setup from Key Support ZoneXAG/USD (Silver) Trade Analysis – 2H Chart (July 2, 2025)
🔹 Trade Setup Overview:
Entry Point: 35.84299
Target (TP): 37.32540
Stop Loss (SL): 35.59483
Current Price: 36.36350
Risk/Reward Ratio: ~5.9:1 (Very favorable)
🔹 Technical Insights:
Support Zone:
Price recently tested and respected a strong demand zone between 35.60 – 35.84, which has now acted as a bounce level.
Multiple wicks and rejections at this zone highlight buyer interest.
Moving Averages:
50 EMA (red) is starting to flatten, possibly hinting at momentum reversal.
200 EMA (blue) held as dynamic support during the last dip — a bullish signal.
Breakout Potential:
Price has bounced off the entry zone and is approaching minor resistance near 36.40–36.60.
A clean break above this area can trigger momentum toward the 37.30s.
Volume & Momentum:
The latest candle shows strong bullish momentum, validating the bounce setup.
No sign of exhaustion yet.
🔹 Strategy Suggestion:
Entry has already occurred or is slightly above entry zone — ideal for aggressive traders to ride the momentum.
Conservative traders may wait for a pullback near 36.00–36.10 before entering.
SL is well-placed below previous lows and structure — reasonable protection.
🔹 Conclusion:
This setup reflects a bullish continuation trade from a strong support zone. Given the risk/reward profile and recent bullish action, this trade is technically sound as long as price stays above 35.84. A close below this level could invalidate the setup
XAGUSD trade ideas

SILVER Will Go Lower From Resistance! Short!
Here is our detailed technical review for SILVER.
Time Frame: 12h
Current Trend: Bearish
Sentiment: Overbought (based on 7-period RSI)
Forecast: Bearish
The market is approaching a significant resistance area 3,654.7.
Due to the fact that we see a positive bearish reaction from the underlined area, I strongly believe that sellers will manage to push the price all the way down to 3,536.0 level.
P.S
Please, note that an oversold/overbought condition can last for a long time, and therefore being oversold/overbought doesn't mean a price rally will come soon, or at all.
Disclosure: I am part of Trade Nation's Influencer program and receive a monthly fee for using their TradingView charts in my analysis.
Like and subscribe and comment my ideas if you enjoy them!

XAG/USD (Silver) - Triangle Breakout (09.07.2025)The XAG/USD (Silver) pair on the M30 timeframe presents a Potential Buying Opportunity due to a recent Formation of a Wedge Breakout Pattern. This suggests a shift in momentum towards the upside and a higher likelihood of further advances in the coming hours.
Possible Long Trade:
Entry: Consider Entering A Long Position around Trendline Of The Pattern.
Target Levels:
1st Resistance – 3749
2nd Resistance – 3781
🎁 Please hit the like button and
🎁 Leave a comment to support for My Post !
Your likes and comments are incredibly motivating and will encourage me to share more analysis with you.
Best Regards, KABHI_TA_TRADING
Thank you.
Disclosure: I am part of Trade Nation's Influencer program and receive a monthly fee for using their TradingView charts in my analysis

SILVER: Short Signal with Entry/SL/TP
SILVER
- Classic bearish setup
- Our team expects bearish continuation
SUGGESTED TRADE:
Swing Trade
Short SILVER
Entry Point - 36.935
Stop Loss - 37.204
Take Profit - 36.369
Our Risk - 1%
Start protection of your profits from lower levels
Disclosure: I am part of Trade Nation's Influencer program and receive a monthly fee for using their TradingView charts in my analysis.
❤️ Please, support our work with like & comment! ❤️

A SUPER XAGUSD BUYYesterday XAGUSD reached its demand bottom, and now it is rising to the supply ceiling,
In the meantime I found an order block in the 1 min time frame, and immediately I placed a Buy order, and I will travel with it until the price reaches the supply ceiling with 1.2 win rate.

XAGUSD Strong accumulation waiting for a break-out. Silver (XAGUSD) has been trading within a 3-month Channel Up pattern and since the June 18 Higher High, it has entered a Descending Triangle.
This has previous been an Accumulation pattern, which after broken to the upside, it led to June's High. Similarly, we expect a bullish break-out once the 4H RSI breaks above its MA, and as long as the 4H MA200 (orange trend-line) holds, we expect a +15.50% minimum rise (like the first Bullish Leg of the Channel Up), with our Target se at 40.500.
-------------------------------------------------------------------------------
** Please LIKE 👍, FOLLOW ✅, SHARE 🙌 and COMMENT ✍ if you enjoy this idea! Also share your ideas and charts in the comments section below! This is best way to keep it relevant, support us, keep the content here free and allow the idea to reach as many people as possible. **
-------------------------------------------------------------------------------
💸💸💸💸💸💸
👇 👇 👇 👇 👇 👇

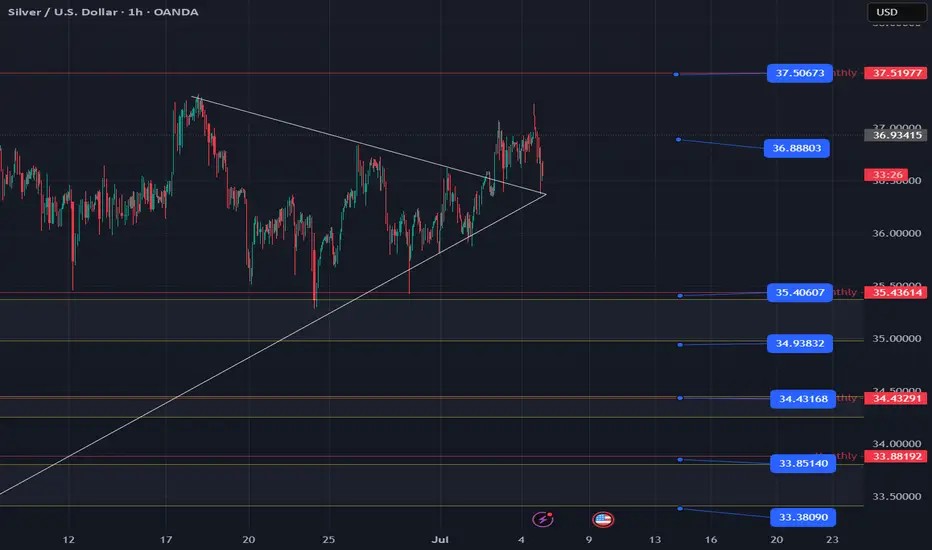
SILVER US$ 1H CHART PATTERNSilver (XAG/USD) 1H timeframe, here’s a breakdown of the target levels indicated:
📈 Chart Analysis Highlights:
The chart shows a bullish ascending triangle pattern, which is typically a continuation pattern signaling upward movement.
The price has recently broken above resistance around the 36.36–36.40 area.
You’ve marked two target points:
---
🎯 Target Levels:
1. First Target Point:
Price Level: Approximately 37.40 USD
This is the first significant resistance level after breakout, potentially reachable if momentum continues.
2. Second Target Point (Extended Target):
Price Level: Approximately 37.80 USD
This would be a more ambitious target assuming strong bullish follow-through.
---
📌 Notes:
Ensure to monitor volume on breakout for confirmation.
Risk management is important — consider stop-loss near 36.10 or below the ascending trendline.
Watch for any false breakouts especially near Ichimoku cloud resistance zones.
Would you like help setting up entry/exit levels or risk-reward ratios?

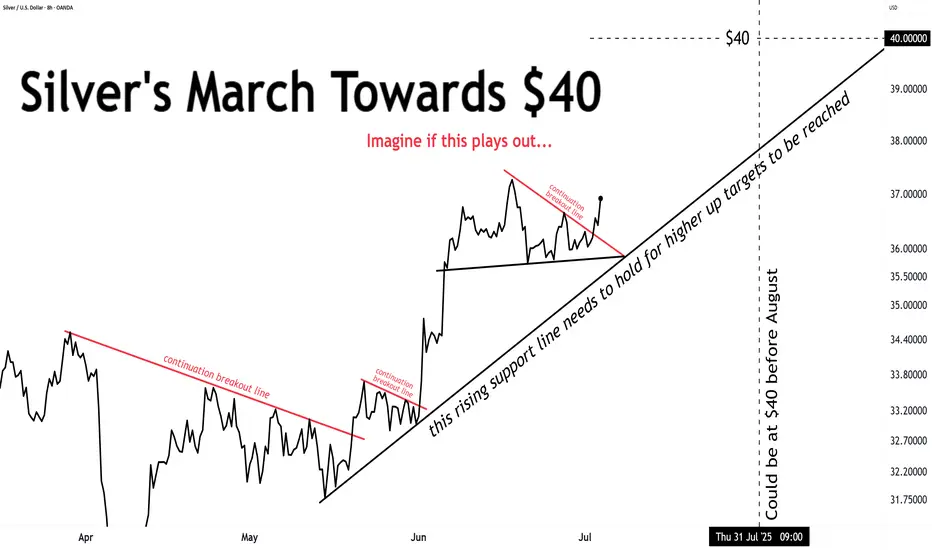
And silver's ride to $40 continues ...this rising support line needs to hold for higher up targets to be reached
XAGUSD – Bullish Setup for a Move Toward 40 1. What happened recently
After the massive selloff in early April, Silver (XAGUSD) reversed aggressively — gaining nearly 10,000 pips and breaking into multi-decade highs near 38. That kind of move is not noise. It’s power.
The month of June brought consolidation, with price slowly correcting and stabilizing. But this doesn’t look like distribution — it looks like new accumulation.
2. The key question
Is Silver building a base for the next breakout, or has the rally run out of steam?
3. Why I expect another leg up
- 35.00 is now acting as a solid support — tested, respected
- The correction has been shallow, typical for a bull rectangle structure
- Momentum remains on the buyers’ side — no major breakdown signs
- If buyers step in strongly, the next target is clearly the 40.00 psychological level
- This is a textbook bullish continuation setup.
4. Trading plan
Swing traders should watch the 35.00–35.20 zone for buying opportunities.
The risk/reward is attractive — with a potential for +5000 pips on a move toward 40, while keeping stops under the base.
Buy the dips — not the breakouts.
5. Final thoughts 🚀
Silver is shining again. The trend is up, the structure supports further gains, and the chart is offering a clean setup. Until 35 fails, the bias remains bullish.
Disclosure: I am part of TradeNation's Influencer program and receive a monthly fee for using their TradingView charts in my analyses and educational articles.

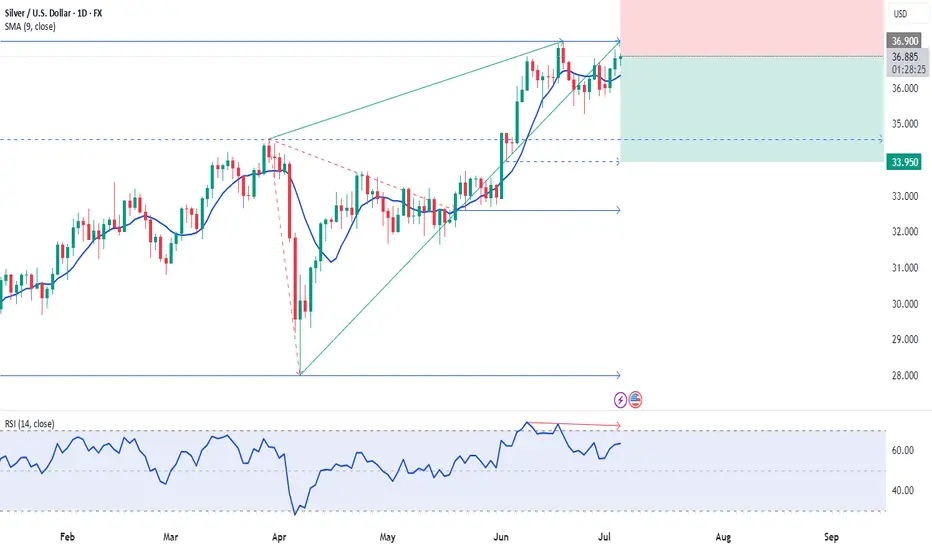
04.07.2025 #XAGUSDSELL 36.9000 | STOP 38.5000 | TAKE 34.7000 - 33.9500 | Medium-term investment forecast on silver deal for the next 2-3 months. On the D1 chart we observe the technical structure of the completion of the ascending wedge. Formation of double top of highs. We also consider a probable potential for the output of volumes in this instrument and a gradual decline to a pronounced support range on the background of growing interest and the potential of the US dollar until the end of summer.
Final Stretch for SilverSilver OANDA:XAGUSD COMEX:SI1! AMEX:SLV continues to follow the plan
At this stage, price has either:
already completed wave ④ and is now entering wave ⑤,
or wave ④ is still in progress, currently in its final stages.
In either case, the wave structure suggests a final impulsive move upward into the $38–40 range — the climactic fifth wave of the sequence.
Volume Profile Analysis:
Price is currently trading between σ1 and σ2, with room to expand toward σ3 (~$40) if momentum continues.
The accumulation phase is behind us — we are now in the distribution zone.
Price action also supports the bullish outlook:
Last month closed with a strong bullish candle, showing no signs of reversal.
Keeping an eye on the move — the $38–40 zone remains the key target for the completion of this impulse.
#Silver #XAGUSD #ElliottWave #VolumeProfile #PriceAction #WaveAnalysis

Nasdaq, BTCUSD, ETHUSD, EURUSD & XAGUSD Daily Trade SetupsIn this update we review the recent price action in the Nasdaq, Bitcoin, Ethereum, Euro & Silver and identify the next high probability trade setups and price objectives to target. To review today's video analysis click here!

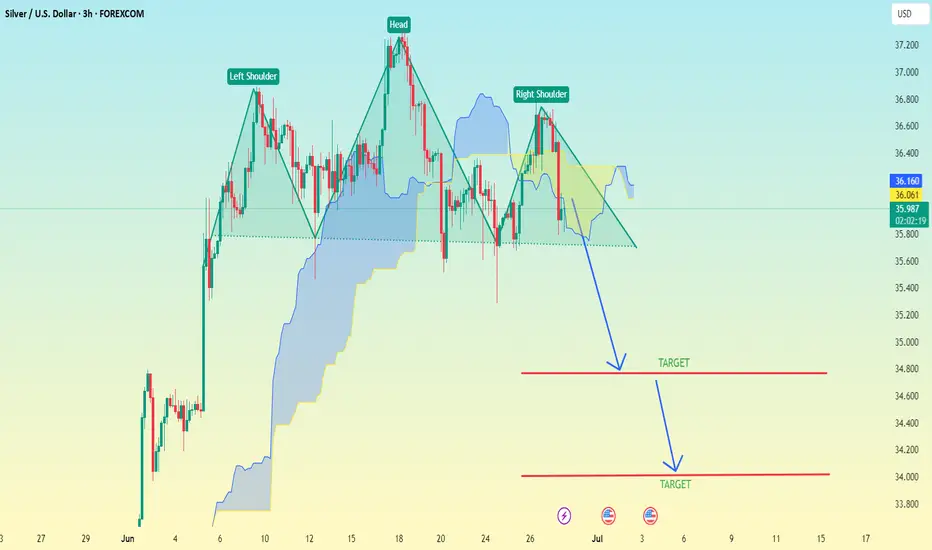
(XAG/USD – Silver vs USD–3h timeframe) Head and Shoulder Pattern(XAG/USD – Silver vs USD – 3h timeframe), a Head and Shoulders pattern is clearly marked, which is a bearish reversal signal.
Key Details:
Pattern: Head and Shoulders
Neckline: Approximately at the 35.90–36.00 level
Breakout Direction: Down
Measured Move Target Method: To estimate the target, subtract the height from the head to the neckline from the neckline level.
---
Target Estimation:
Head High: ~36.95
Neckline Level: ~35.90
→ Difference: 36.95 - 35.90 = 1.05
Target 1 (conservative): 35.90 - 1.05 = 34.85
Target 2 (aggressive): Based on the secondary arrow and extended support, it's pointing toward ~34.00–34.20
---
📉 Final Targets:
✅ First Target: 34.85
✅ Second Target: 34.00–34.20 (if bearish momentum continues)
Let me know if you want stop-loss or risk management levels included.
Silver Dip Offers a Long OpportunityThis is a good opportunity to go long on silver.
Nothing has changed fundamentally — I still expect the asset to move higher.
The recent drop following the economic data release is giving me a chance to add to my silver position.

Long SilverExpecting Silver to do a little bit of consolidation before going up higher. Price is just for reference. Please do your own due diligence before trading. Also please manage your risk as well. Trade safe everyone. God bless.

Short term pullback is overFrom my last analysis on silver, we had a sell on silver, but it happened that the short term sell was liquidity the market used to buy dip.
Looking at the red rectangle we can see that silver has finished accumulating at that zone and is heading north ⬆️,so we are bullish going forward.
Target profit:38.00 , 39.00

XAG/USD Daily AnalysisPrice is moving within a bullish channel, which is itself situated inside a bigger bullish structure.
The most recent price action appears to be a consolidation within the uptrend.
Price may possibly be setting up for another impulsive move towards the top of structure for a 3rd test.
If you agree with this analysis, look for a trade that meets your strategy rules.

Setupsfx_ | SILVER: Preparing For Another Bullish Move! There are two buying areas we believe could reverse the price trend, which would be a significant move in silver price history. We may even see it go above $40 for the first time. Silver is becoming a secondary best option to invest in the global market, but it will never surpass gold at least for now.
Good luck and trade safely!
Team Setupsfx_

Watching Silver Prices After Recent HighsI see 3 main scenarios for silver's next few moves. I don't expect its lower support levels to be tested if the pattern represents the yellow path. I expect the green scenario to be the most likely outcome. Blue wouldn't surprise me either ($$) especially as the dollar's performance has a downward momentum.
DYOR
Trade Slick

SILVER: Local Bearish Bias! Short!
My dear friends,
Today we will analyse SILVER together☺️
The price is near a wide key level
and the pair is approaching a significant decision level of 36.435 Therefore, a strong bearish reaction here could determine the next move down.We will watch for a confirmation candle, and then target the next key level of 36.336..Recommend Stop-loss is beyond the current level.
❤️Sending you lots of Love and Hugs❤️

SLIVER Weekly patternJust another view from the weekly chart. To give confirmation of the daily bias

Silver (XAGUSD) Structural Analysis : Curve break & TargetSilver is exhibiting a textbook bullish continuation pattern, guided by a parabolic curve structure that reflects intensifying buyer momentum. This unique setup provides a high-probability trading roadmap as we approach a major reversal zone—one where smart money may look to offload long positions or enter fresh shorts.
This analysis aims to help traders anticipate the likely path of XAGUSD based on structure, liquidity behavior, and trend psychology.
🔍 Key Structural Observations:
1. Black Mind Curve Support (Dynamic Bullish Structure)
This parabolic arc acts as dynamic support. Every bounce from the curve shows growing strength in buyer conviction.
The price is riding the curve upward with higher lows, signaling accumulation with momentum.
This is not a standard trendline but rather a curve reflecting the accelerated nature of this uptrend.
2. Aggressive Bullish Momentum
The recent price behavior has shown strong impulsive candles to the upside followed by shallow corrections, confirming bullish dominance.
Volume and candle size increase near the curve, suggesting institutional interest.
3. Reversal Zone: 37.20 – 37.45
Marked as the Next Reversal Zone, this green box represents a key supply area where previous swing highs exist.
Historically, price struggled to break this region cleanly, making it a high-probability reaction zone.
Expect either:
a bearish rejection (short-term correction), or
a consolidation before a breakout continuation.
4. Liquidity Pool & Needed Volume Zone (~35.20 – 35.50)
The market often revisits zones of untapped liquidity. This area likely holds:
Buy-side stop losses
Unfilled institutional orders
If the market needs a deeper retracement, this is the zone to watch for re-accumulation.
🧠 Market Psychology Behind This Setup:
This structure suggests a classic case of smart money accumulation, with price moving upward in a controlled yet aggressive fashion. The parabolic nature of the move points to:
Increasing retail buy-ins
FOMO-driven entries
Possible engineered sweep before the next impulse
The reversal zone could become a profit-taking area for institutions. If large players want to continue higher, they may first induce a pullback to absorb more volume at lower prices (near the curve or liquidity zone).
🔧 Tactical Playbook for Traders:
For Bulls (Long Bias):
Watch for pullbacks toward the curve or liquidity zone.
Enter long positions on bullish confirmation (e.g., engulfing candles, pin bars) off those zones.
Targets: 37.20 – 37.45, possibly higher if broken with strength.
For Bears (Countertrend Traders):
Wait for clear rejection patterns in the reversal zone.
Use confirmation like RSI divergence, momentum slowdown, or distribution volume.
Target: Curve support or deeper liquidity zone for reentry.
📌 Key Technical Levels:
Zone Price Range Description
Reversal Zone 37.20 – 37.45 Resistance / Take-Profit Area
Curve Support Dynamic (rising) Support based on parabolic arc
Liquidity Pool 35.20 – 35.50 High-volume demand zone
🧭 Conclusion
Silver is currently in a momentum-driven phase supported by smart money activity. The parabolic structure and clean liquidity map give traders a clear plan to engage both long and short setups with timing and precision. Patience around the reversal zone will be key, as the next major move may depend on how price behaves in this critical area.

Long XAGUSDXAGUSD has been holding the breakout of this wedge as well as the 8MA and 21MA. I like longs here using a break/hold below the 21MA as a stop. I would target 37, 37.5 initially and if we can see a break/hold of 37.5 I would target 39, 40.