11.08.25 Morning ForecastPairs on Watch -
FX:USDCAD
FX:GBPAUD
FX:CADJPY
OANDA:XAGUSD
A short overview of the instruments I am looking at for today, multi-timeframe analysis down to what I will be looking at for an entry. Enjoy!
XAGUSD trade ideas

XAGUSD: Correction May Be Over – Watch $37.60 BreakoutAfter reaching a local top around the $39.50 zone on July 24, Silver entered a normal corrective phase, with price dropping over 3,000 pips from top to bottom — roughly an 8% retracement.
📉 Despite the strength of the drop, the structure was clearly corrective, not impulsive. Even more, the move formed a descending broadening wedge, a pattern that often hints at a potential reversal.
📈 Yesterday, we saw a clean breakout above the wedge’s upper boundary — which may signal the end of the correction.
At the time of writing, price is trading at $37.45, right under a key horizontal resistance zone between $37.50 and $37.60.
A breakout above this level would confirm the low and likely initiate a new move toward the $38.70 resistance.
________________________________________
🎯 Summary & Plan:
• A break above $37.60 = bullish confirmation
• Target: $38.70 (first resistance)
• Invalidation: If price drops below $37, bulls lose control
As long as price holds above the $37 zone, the technical outlook remains constructive, and traders could consider setups aligned with the upside scenario. 🚀
Disclosure: I am part of TradeNation's Influencer program and receive a monthly fee for using their TradingView charts in my analyses and educational articles.

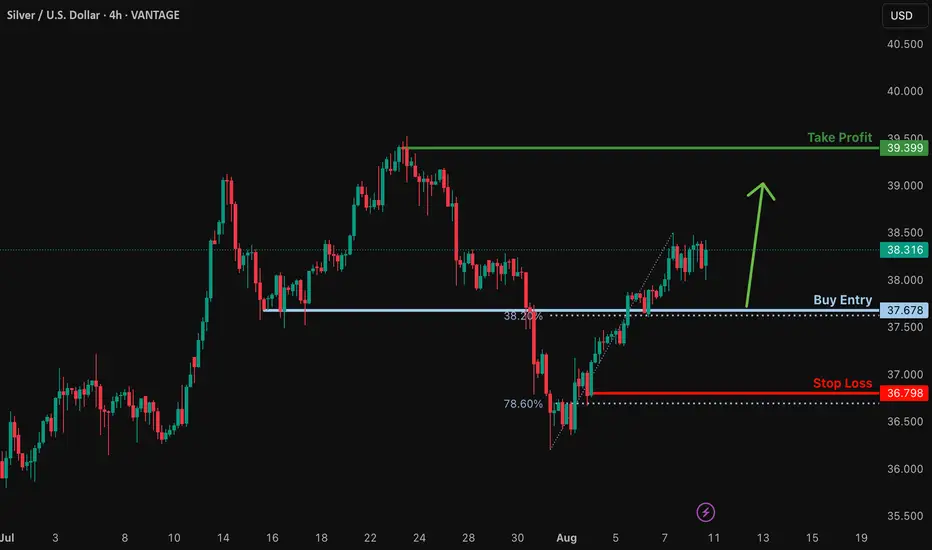
XAGUSD H4 | Bullish bounce off 38.2% Fibonacci support?Based on the H4 chart analysis, we could see the price fall to the buy entry which is a pullback support that aligns with the 38.2% Fibonacci retracement and could bounce from this level to the upside.
Buy entry is at 37.67, which is a pullback support that lines up with the 38.2% Fibonacci retracement.
Stop loss is at 36.89, which is a pullback support.
Take profit is at 39.39, which is a swing high resistance.
High Risk Investment Warning
Trading Forex/CFDs on margin carries a high level of risk and may not be suitable for all investors. Leverage can work against you.
Stratos Markets Limited (tradu.com ):
CFDs are complex instruments and come with a high risk of losing money rapidly due to leverage. 65% of retail investor accounts lose money when trading CFDs with this provider. You should consider whether you understand how CFDs work and whether you can afford to take the high risk of losing your money.
Stratos Europe Ltd (tradu.com ):
CFDs are complex instruments and come with a high risk of losing money rapidly due to leverage. 66% of retail investor accounts lose money when trading CFDs with this provider. You should consider whether you understand how CFDs work and whether you can afford to take the high risk of losing your money.
Stratos Global LLC (tradu.com ):
Losses can exceed deposits.
Please be advised that the information presented on TradingView is provided to Tradu (‘Company’, ‘we’) by a third-party provider (‘TFA Global Pte Ltd’). Please be reminded that you are solely responsible for the trading decisions on your account. There is a very high degree of risk involved in trading. Any information and/or content is intended entirely for research, educational and informational purposes only and does not constitute investment or consultation advice or investment strategy. The information is not tailored to the investment needs of any specific person and therefore does not involve a consideration of any of the investment objectives, financial situation or needs of any viewer that may receive it. Kindly also note that past performance is not a reliable indicator of future results. Actual results may differ materially from those anticipated in forward-looking or past performance statements. We assume no liability as to the accuracy or completeness of any of the information and/or content provided herein and the Company cannot be held responsible for any omission, mistake nor for any loss or damage including without limitation to any loss of profit which may arise from reliance on any information supplied by TFA Global Pte Ltd.
The speaker(s) is neither an employee, agent nor representative of Tradu and is therefore acting independently. The opinions given are their own, constitute general market commentary, and do not constitute the opinion or advice of Tradu or any form of personal or investment advice. Tradu neither endorses nor guarantees offerings of third-party speakers, nor is Tradu responsible for the content, veracity or opinions of third-party speakers, presenters or participants.

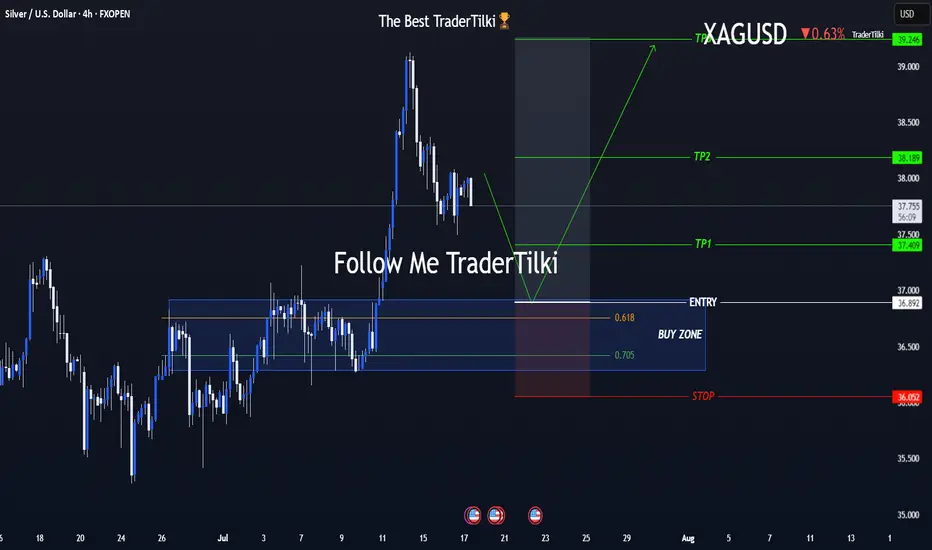
One Shot, Clear Strategy – Silver Buy Zone in SightHey everyone 👋
📌 BUY LIMIT ORDER / XAGUSD-SILVER Key Levels
🟢 Entry: 36,892
🎯 Target 1: 37,409
🎯 Target 2: 38,189
🎯 Target 3: 39,246
🔴 Stop: 36,052
📈 Risk/Reward Ratio: 2,79
I double-checked the levels and put together a clean, focused analysis just for you. Every single like seriously boosts my motivation to keep sharing 📈 Your support means the world to me! Huge thanks to everyone who likes and backs this work 💙 Our goals are crystal clear, our strategy is solid. Let’s keep moving forward with confidence and smart execution!
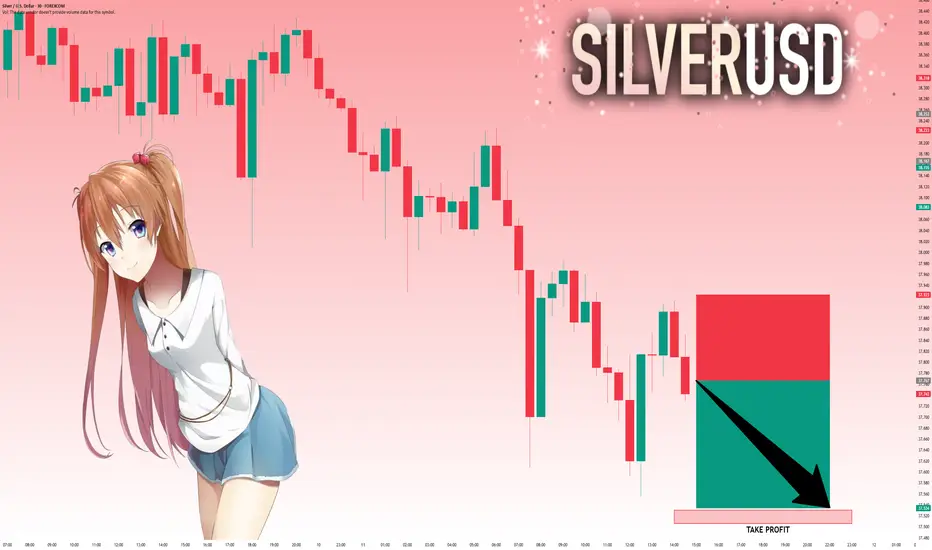
XAGUSD SWING: SHORT-TERM BEARISH OPPORTUNITY Hi there,
For Silver, I am long term bullish but we have a set up for some short opportunity.
As annotated, we are primed to see lower prices... between 34 - 34.5
If this happens, I'd resume looking for massive long opportunities.
You might want to keep this on your radar.
Cheers,
Jabari
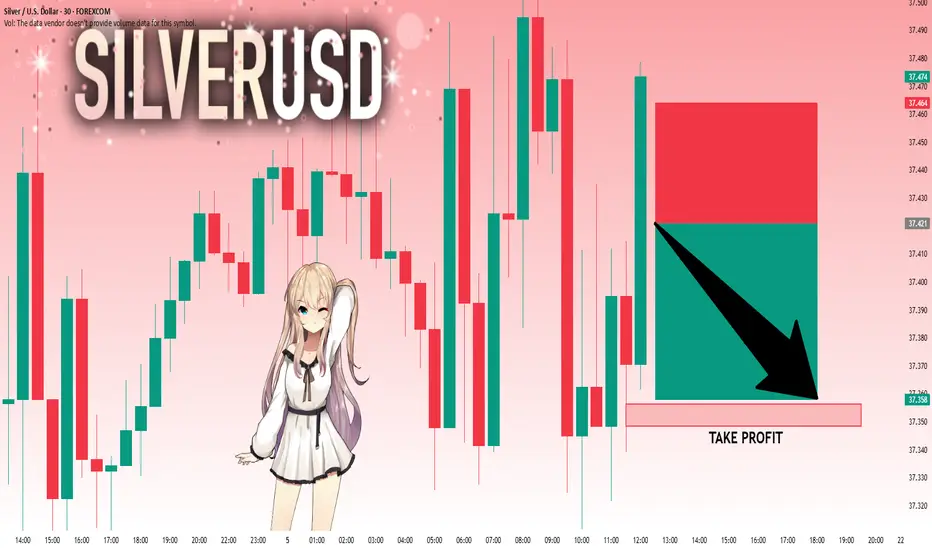
SILVER: The Market Is Looking Down! Short!
My dear friends,
Today we will analyse SILVER together☺️
The recent price action suggests a shift in mid-term momentum. A break below the current local range around 37.421 will confirm the new direction downwards with the target being the next key level of 37.356.and a reconvened placement of a stop-loss beyond the range.
❤️Sending you lots of Love and Hugs❤️
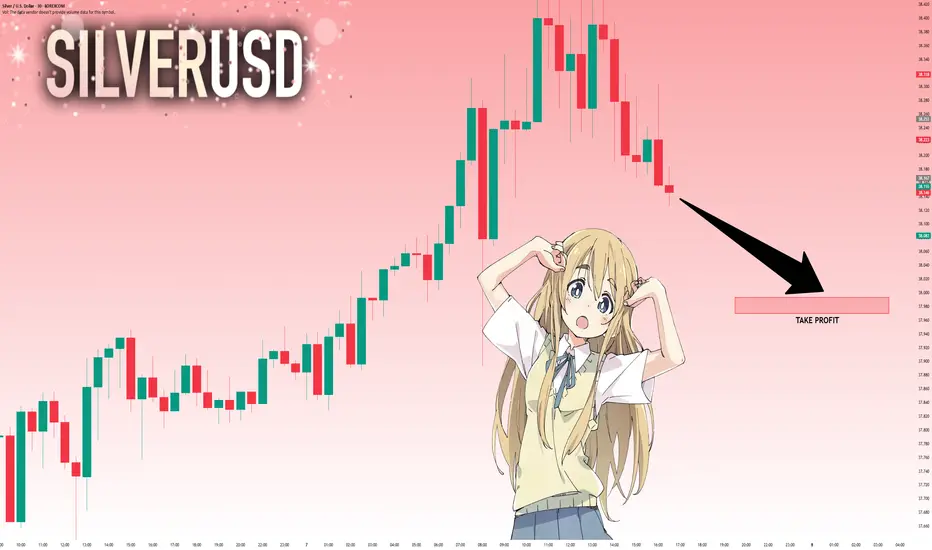
SILVER: Strong Bearish Sentiment! Short!
My dear friends,
Today we will analyse SILVER together☺️
The recent price action suggests a shift in mid-term momentum. A break below the current local range around 38.167 will confirm the new direction downwards with the target being the next key level of 37.993.and a reconvened placement of a stop-loss beyond the range.
❤️Sending you lots of Love and Hugs❤️
SILVER WILL GO UP|LONG|
✅SILVER is going up
Now and the pair made a bullish
Breakout of the key horizontal
Level of 37.73$ and the breakout
Is confirmed so we are bullish
Biased and we will be expecting
A further bullish move up
LONG🚀
✅Like and subscribe to never miss a new idea!✅

Silver at a Crossroads – 38.50 Break or 38.00 Collapse?Right now, Silver is worth keeping on the radar.
After falling from multi-year highs near 40 down to 36.20, the metal reversed and broke above both the falling trendline from the top and the 37.80 resistance.
Similar to Gold, the final sessions of last week were marked by range trading, with a clear top at 38.50 and bottom at 38.00.
Looking ahead:
• Bullish case: A break above 38.50 would be significant for buyers and could open the door for another test of the 40.00 zone.
• Bearish case: A daily close below 38.00 would be very negative, confirming a lower high at 38.50 and raising the probability of an ABC-type correction. In this scenario, 35.50 support becomes a likely target, with potential for a 2,500-pip drop.
Disclosure: I am part of TradeNation's Influencer program and receive a monthly fee for using their TradingView charts in my analyses and educational articles.

"THE SILVER JOB" // $XAG/USD ROBBERY PLAN UNLOCKED🚨SILVER HEIST LOADING... BULLS ON THE MOVE! 💥 XAG/USD THIEF PLAN 💰🐂
Asset: XAG/USD “The Silver”
📈 Plan: Bullish Thief Raid
🎯 Target Zone: 40.000 – “Police Barricade Resistance” + Overbought Hotspot
🛑 Stop Loss: 37.500 – Vault Alarm Level
💼 Entry: “Anywhere, Anytime” – The thief is layering his limit orders like a true market infiltrator!
💸💣THE THIEF'S MASTER ROBBERY PLAN👇
🧠 Mindset:
This isn’t just a trade — it’s a full-scale Silver Heist 🐱👤💰
The Thief has eyes on the big vault near 40.000, and we’re sneaking in using multiple limit orders. No fixed entry — just strategic placements near pullbacks or recent swings.
🔒 Stop Loss: Hidden beneath recent traps (37.500). If the alarm goes off — we vanish.
🚔 Target: 40.000 – Major resistance where the market police are camping! It's also an overbought zone, so get in, loot, and exit clean.
📉 SITUATION REPORT:
📊 Market Mood: Bullish
🔥 Momentum Shift: Strong breakout signs
⚠️ Danger Zone: High volatility approaching — stay alert!
💥 Macro + Technical Confluence: Bulls gathering force – volume rising, trend intact.
👇 TIPS FROM THE THIEF 👇
🧲 Scalpers & Swingers:
Stick to the Long side only!
Use a Trailing SL like a grappling hook — protect profits as you climb.
⚔️ If you’re undercapitalized, layer wisely and avoid overexposure!
📰 News Threat?
Don’t raid during sirens (major releases). Wait it out, then re-enter when it’s calm again.
🧠 Psych Game:
Avoid revenge trades. Set your plan, rob smart, rob clean 🧤🔍
🚀 Ready to Ride with the Robbery Crew?
💖 Boost this Idea to support the Thief Guild!
🎯 Stay tuned for more Heist Plans!
🤑 Join the raid. Rob the market. Run with profits. 🎒💨

One more move up and then we should sell for now....This pb has allowed the shorts to cash in...we are at signficant support (middle of prior funnel) and the bottom of the channel...in my opinion, we resume the move up...but I think $42-$44 zone is the likely pivot pt for a significan move back down...back to mid to low $30's...This current pb is will shake off the weak hands! However, let this be a lesson...avoid leverage or you may pay dearly....
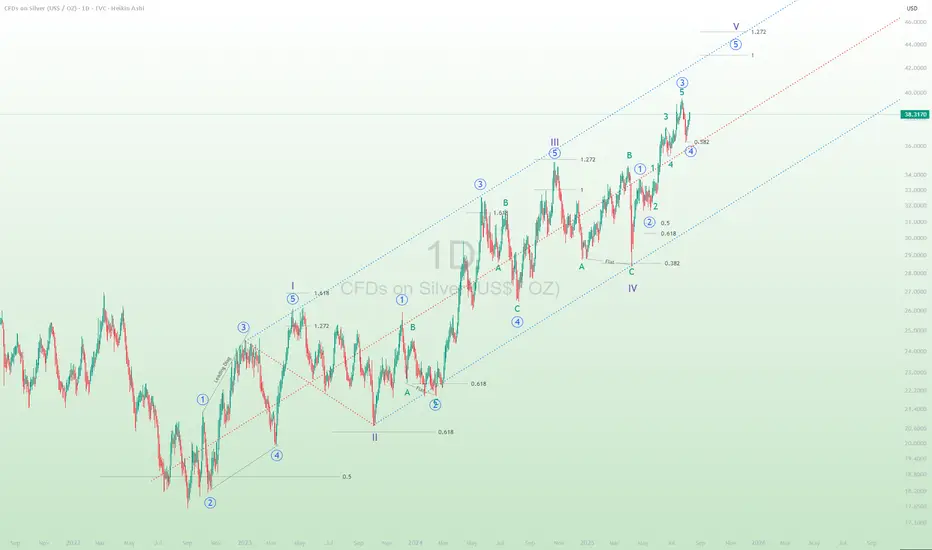
Elliott Wave Analysis: Silver (XAGUSD) Targets $40.3 in Wave 5 The ongoing cycle in Silver (XAGUSD), initiated from the April 7 low, continues to unfold as an impulsive Elliott Wave structure. Wave (3) of this impulse concluded at 39.52, as illustrated on the 1-hour chart. The subsequent pullback in wave (4) terminated at 36.17, exhibiting a zigzag internal structure. From the peak of wave (3), wave ((i)) declined to 38.67, followed by a rally in wave ((ii)) to 39.19. Wave ((iii)) then dropped to 37.93, with wave ((iv)) rebounding to 38.33. The final leg, wave ((v)), completed at 37.88, finalizing wave A in a higher degree. Wave B then rallied to 38.28.
Wave C descended in a five-wave impulse pattern. From wave B, wave ((i)) fell to 37.98, and wave ((ii)) climbed to 38.24. Wave ((iii)) dropped to 36.76, followed by wave ((iv)) rising to 37.268. The final wave ((v)) concluded at 36.17, completing wave C of (4). Silver has since begun advancing in wave (5). However, it must surpass the wave (3) high of 39.52 to eliminate the possibility of a double correction. As long as the 36.17 pivot holds, expect upward momentum. The potential target for wave (5) lies at the 123.6% inverse retracement of wave (4), projecting to 40.3. This analysis supports a bullish near-term outlook, provided the key support level remains intact.

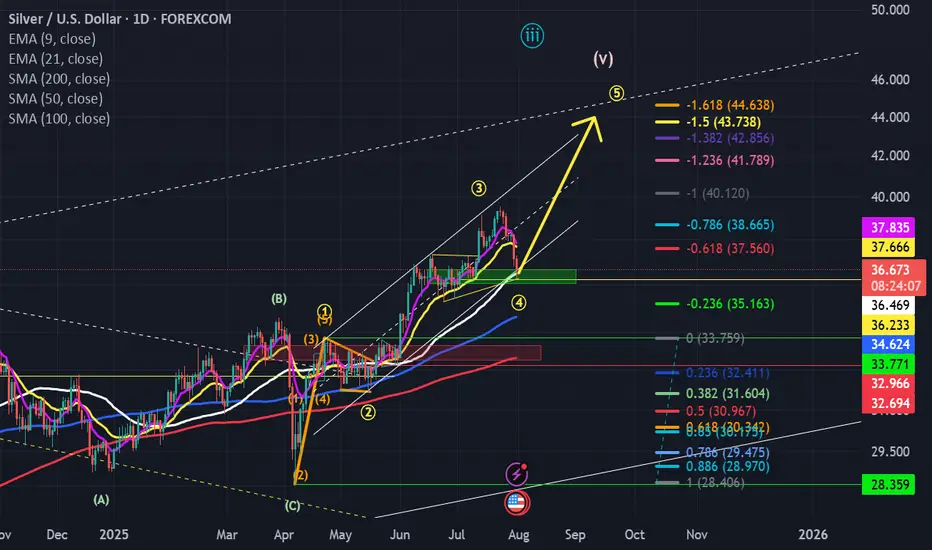
SILVER is going for Wave 5Trend: Uptrend
Expected the completion of subwave 4 in blue circle, and the price is going up for the continuation to subwave 5 of wave V.
Do your own analysis before starting any trade. Take your own risk.
SILVER: Target Is Down! Short!
My dear friends,
Today we will analyse SILVER together☺️
The in-trend continuation seems likely as the current long-term trend appears to be strong, and price is holding below a key level of 37.767 So a bearish continuation seems plausible, targeting the next low. We should enter on confirmation, and place a stop-loss beyond the recent swing level.
❤️Sending you lots of Love and Hugs❤️
Silver (XAG/USD):Silver extended its bullish move, breaking above the $38.00 resistance zone, and is currently trading near $38.34.
🔹 Bullish Scenario (1):
If momentum continues and price holds above $38.30, the next potential targets are $38.80, followed by $39.00.
🔹 Bearish Scenario (2):
However, a rejection followed by a break below $37.95 and $37.62 may trigger a deeper pullback toward the demand zone $37.30 .
⚠️ Disclaimer:
This is not financial advice. Please monitor price action and market conditions before making any investment decisions.

XAGUSD--LONG--monthly bullish, weekly bullish (bullish engulfing)
--wait for pullback to the 37.258 level
--entry=37.325
--stop loss: break of 39.258
--tp1=39.146
--tp1 upper level of green channel

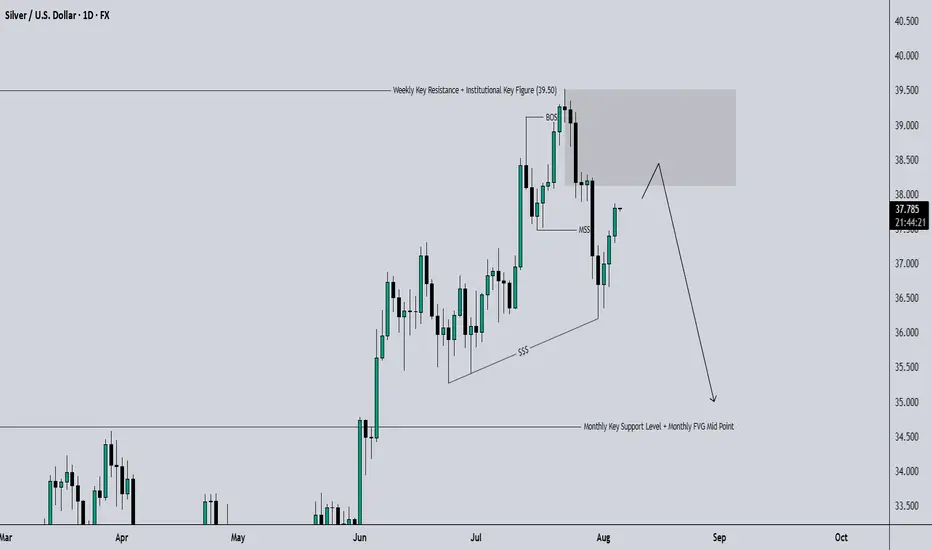
XAGUSDB wave looks cooked — rejection off the 0.618 zone. As long as 38.25 holds, C wave down to 35.80 → 34.50’s is in play. Break above = plan invalid.
#XAGUSD #Silver #WaveAnalysis

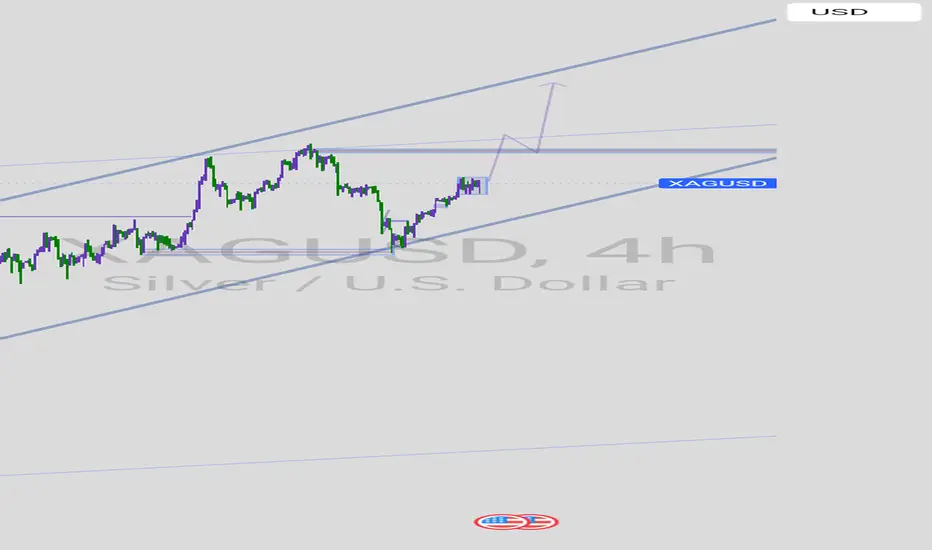
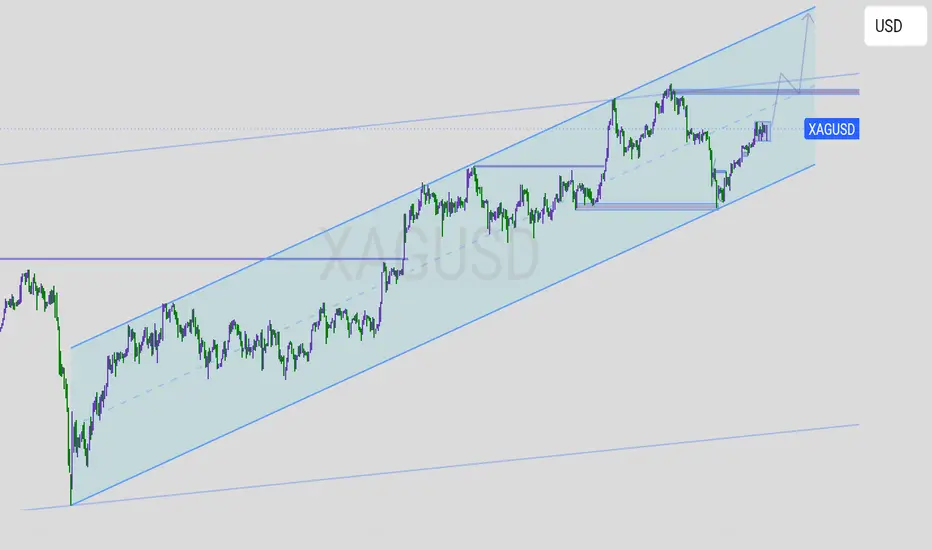
Silver (XAGUSD) on the **4-hour** chart is in a **clear rising Price has been making higher highs and higher lows and is currently in a small consolidation inside the channel. The annotated purple arrow forecasts a breakout continuation toward the channel’s upper boundary (next major resistance). Bullish bias while price stays inside the channel; a break below the lower channel or the horizontal support invalidates the bullish view.
---
# What the chart shows (observations)
1. **Timeframe:** 4-hour (swing/trend context).
2. **Trend structure:** Long-term uptrend — price moving inside a wide ascending channel drawn with two parallel trendlines (support = lower boundary, resistance = upper boundary).
3. **Horizontal levels:** Several purple horizontal zones mark prior support/resistance — notably a mid-channel support (around where price bounced recently) and a resistance area that price has used previously.
4. **Current price action:** A boxed consolidation (small range) near the mid-to-upper channel area — a classic continuation flag/pennant inside an uptrend.
5. **Projection:** The purple arrow drawn on the chart shows an expected breakout from the small consolidation, retest of the prior resistance (now support) and then a push up toward the upper channel resistance (the chart’s target area).
---
# Technical interpretation
* **Bullish overall:** Higher highs & higher lows inside an ascending channel — that’s bullish.
* **Continuation pattern:** The small boxed consolidation after a prior leg higher looks like a continuation pattern (flag/box). Break above the box → likely continuation to the upper channel.
* **Key supports:** The mid-channel horizontal zone and the rising lower trendline. These are the areas bulls want to hold.
* **Key resistance/target:** The upper channel boundary (and the horizontal resistance near the top) — this is the obvious profit target for longs.
---
# Possible trade ideas (examples, not financial advice)
1. **Aggressive long (momentum):**
* Entry: on clean breakout above the consolidation box with volume/candle confirmation.
* Stop: below the bottom of the box or below the nearby horizontal support.
* Target: first to the purple horizontal / mid-upper resistance, then to the channel top.
2. **Conservative long (pullback):**
* Wait for a breakout, then wait for a retest of the breakout level (or the rising mid-channel support). Enter on a bullish rejection/candle pattern.
* Stop: below retest low.
* Target: channel top.
3. **Invalidation / short idea:**
* If price breaks and closes **below the lower channel trendline** or the major horizontal support zone, that breaks the bullish structure. Consider shorting on confirmation toward the lower channel or a measured move down.
---
# Risk management & things to watch
* **Risk per trade:** size position so your stop loss equals a small % of equity (e.g., 1–2%).
* **Watch macro events:** USD strength, US CPI, Fed rate decisions, and real yields strongly affect silver — they can cause fast moves that blow through technical levels.
* **False breakouts:** Small timeframes can produce fake breakouts; prefer confirmation (close above resistance + follow-through candle).
* **Channel slope changes:** If price chops sideways and slope flattens, the trend may be losing momentum even before a break.
---
# Quick checklist before trading this setup
* Is breakout confirmed by a clean 4-hour close above the box or resistance? ✅
* Is volume / momentum supporting the move? ✅
* Is my stop placed below logical support (not just a random level)? ✅
* Do macro calendars (CPI/Fed/etc.) have events that could spike volatility? ✅
SILVER Will Go UP! Buy!
Hello,Traders!
SILVER keeps trading in an
Uptrend and the pair already
Made a rebound from the
Horizontal support of 38.10$
So we are bullish biased and
We will be expecting a
Further bullish continuation
Buy!
Comment and subscribe to help us grow!
Check out other forecasts below too!
Disclosure: I am part of Trade Nation's Influencer program and receive a monthly fee for using their TradingView charts in my analysis.

Bullih bounce off pullback support?XAG/USD is falling towards the support level, which is a pullback support that aligns with the 38.2% Fibonacci retracement and could bounce from this level to our take profit.
Entry: 37.67
Why we like it:
There is a pullback support that lines up with the 38.2% Fibonacci retracement.
Stop loss: 36.79
Why we like it:
There is a pullback support level that is slightly above the 78.6% Fibonacci retracement.
Take profit: 39.39
Why we like it:
There is a swing high resistance.
Enjoying your TradingView experience? Review us!
Please be advised that the information presented on TradingView is provided to Vantage (‘Vantage Global Limited’, ‘we’) by a third-party provider (‘Everest Fortune Group’). Please be reminded that you are solely responsible for the trading decisions on your account. There is a very high degree of risk involved in trading. Any information and/or content is intended entirely for research, educational and informational purposes only and does not constitute investment or consultation advice or investment strategy. The information is not tailored to the investment needs of any specific person and therefore does not involve a consideration of any of the investment objectives, financial situation or needs of any viewer that may receive it. Kindly also note that past performance is not a reliable indicator of future results. Actual results may differ materially from those anticipated in forward-looking or past performance statements. We assume no liability as to the accuracy or completeness of any of the information and/or content provided herein and the Company cannot be held responsible for any omission, mistake nor for any loss or damage including without limitation to any loss of profit which may arise from reliance on any information supplied by Everest Fortune Group.
Silver consolidation supported at 3753The Silver remains in a bullish trend, with recent price action showing signs of a continuation breakout within the broader uptrend.
Support Zone: 3753 – a key level from previous consolidation. Price is currently testing or approaching this level.
A bullish rebound from 3753 would confirm ongoing upside momentum, with potential targets at:
3875 – initial resistance
3913 – psychological and structural level
3954 – extended resistance on the longer-term chart
Bearish Scenario:
A confirmed break and daily close below 3753 would weaken the bullish outlook and suggest deeper downside risk toward:
3720 – minor support
3676 – stronger support and potential demand zone
Outlook:
Bullish bias remains intact while the silver holds above 3753. A sustained break below this level could shift momentum to the downside in the short term.
This communication is for informational purposes only and should not be viewed as any form of recommendation as to a particular course of action or as investment advice. It is not intended as an offer or solicitation for the purchase or sale of any financial instrument or as an official confirmation of any transaction. Opinions, estimates and assumptions expressed herein are made as of the date of this communication and are subject to change without notice. This communication has been prepared based upon information, including market prices, data and other information, believed to be reliable; however, Trade Nation does not warrant its completeness or accuracy. All market prices and market data contained in or attached to this communication are indicative and subject to change without notice.

XAGUSD UPTRAND CHANNEL if you take a deep look at this chat you'll see a creal uptrand channel,
as you can see currentry price has rejected from channel's support.
by next week we are goin long, as long as price never make a shift in structure.
so now we should plan long trade whenever price make any retracemant.
if you agree with my bios just vote for long trade.
and follow for more.
silver big picturedisclaimer: i got no idea what i am doing
but somehow silver got a 40 year cup and handle pattern in the chart, given the current sentiment and short squeeze potential in the markets, I think it is likely that silver will go back to the midline of the channel at around 100$.
After that I got less conviction what will happen next, it might depend a lot on inflation in fiat currencies and if commodities go into a decade long bull market.
