Silver (XAG/USD) Bullish Trade Setup from Key Support ZoneXAG/USD (Silver) Trade Analysis – 2H Chart (July 2, 2025)
🔹 Trade Setup Overview:
Entry Point: 35.84299
Target (TP): 37.32540
Stop Loss (SL): 35.59483
Current Price: 36.36350
Risk/Reward Ratio: ~5.9:1 (Very favorable)
🔹 Technical Insights:
Support Zone:
Price recently tested and respected a strong demand zone between 35.60 – 35.84, which has now acted as a bounce level.
Multiple wicks and rejections at this zone highlight buyer interest.
Moving Averages:
50 EMA (red) is starting to flatten, possibly hinting at momentum reversal.
200 EMA (blue) held as dynamic support during the last dip — a bullish signal.
Breakout Potential:
Price has bounced off the entry zone and is approaching minor resistance near 36.40–36.60.
A clean break above this area can trigger momentum toward the 37.30s.
Volume & Momentum:
The latest candle shows strong bullish momentum, validating the bounce setup.
No sign of exhaustion yet.
🔹 Strategy Suggestion:
Entry has already occurred or is slightly above entry zone — ideal for aggressive traders to ride the momentum.
Conservative traders may wait for a pullback near 36.00–36.10 before entering.
SL is well-placed below previous lows and structure — reasonable protection.
🔹 Conclusion:
This setup reflects a bullish continuation trade from a strong support zone. Given the risk/reward profile and recent bullish action, this trade is technically sound as long as price stays above 35.84. A close below this level could invalidate the setup
XAGUSD trade ideas

XAGUSD – Bullish Setup for a Move Toward 40 1. What happened recently
After the massive selloff in early April, Silver (XAGUSD) reversed aggressively — gaining nearly 10,000 pips and breaking into multi-decade highs near 38. That kind of move is not noise. It’s power.
The month of June brought consolidation, with price slowly correcting and stabilizing. But this doesn’t look like distribution — it looks like new accumulation.
2. The key question
Is Silver building a base for the next breakout, or has the rally run out of steam?
3. Why I expect another leg up
- 35.00 is now acting as a solid support — tested, respected
- The correction has been shallow, typical for a bull rectangle structure
- Momentum remains on the buyers’ side — no major breakdown signs
- If buyers step in strongly, the next target is clearly the 40.00 psychological level
- This is a textbook bullish continuation setup.
4. Trading plan
Swing traders should watch the 35.00–35.20 zone for buying opportunities.
The risk/reward is attractive — with a potential for +5000 pips on a move toward 40, while keeping stops under the base.
Buy the dips — not the breakouts.
5. Final thoughts 🚀
Silver is shining again. The trend is up, the structure supports further gains, and the chart is offering a clean setup. Until 35 fails, the bias remains bullish.
Disclosure: I am part of TradeNation's Influencer program and receive a monthly fee for using their TradingView charts in my analyses and educational articles.

SILVER Will Go Lower From Resistance! Short!
Here is our detailed technical review for SILVER.
Time Frame: 12h
Current Trend: Bearish
Sentiment: Overbought (based on 7-period RSI)
Forecast: Bearish
The market is approaching a significant resistance area 3,654.7.
Due to the fact that we see a positive bearish reaction from the underlined area, I strongly believe that sellers will manage to push the price all the way down to 3,536.0 level.
P.S
Please, note that an oversold/overbought condition can last for a long time, and therefore being oversold/overbought doesn't mean a price rally will come soon, or at all.
Disclosure: I am part of Trade Nation's Influencer program and receive a monthly fee for using their TradingView charts in my analysis.
Like and subscribe and comment my ideas if you enjoy them!

SILVER (XAGUSD): Pullback From SupportIt seems that the time has come for 📈SILVER to experience a pullback.
This morning, I've observed a solid intraday bullish signal with the emergence of a head and shoulders pattern on the 4-hour chart.
I anticipate a pullback to at least 36.61, followed by a move to 36.95.

Silver (XAG/USD) on the 1-hour timeframe.Silver (XAG/USD) on the 1-hour timeframe, the chart shows a bullish breakout from a symmetrical triangle pattern. Here's the target breakdown:
📈 Silver Bullish Targets:
Current Price: Around 36.42
1st Target (TP1): Approximately 36.95 – 37.00
2nd Target (TP2): Approximately 37.40 – 37.50
These targets are based on the breakout from the triangle and previous resistance zones marked on your chart.
🛑 Suggested Support Zone (Breakout Retest Area):
Around 36.00 – 36.20 (acts as support now after the breakout)
If price holds above this zone, the bullish structure remains valid. Let me know if you'd like stop loss suggestions or lower timeframe analysis.

SILVER US$ 1H CHART PATTERNSilver (XAG/USD) 1H timeframe, here’s a breakdown of the target levels indicated:
📈 Chart Analysis Highlights:
The chart shows a bullish ascending triangle pattern, which is typically a continuation pattern signaling upward movement.
The price has recently broken above resistance around the 36.36–36.40 area.
You’ve marked two target points:
---
🎯 Target Levels:
1. First Target Point:
Price Level: Approximately 37.40 USD
This is the first significant resistance level after breakout, potentially reachable if momentum continues.
2. Second Target Point (Extended Target):
Price Level: Approximately 37.80 USD
This would be a more ambitious target assuming strong bullish follow-through.
---
📌 Notes:
Ensure to monitor volume on breakout for confirmation.
Risk management is important — consider stop-loss near 36.10 or below the ascending trendline.
Watch for any false breakouts especially near Ichimoku cloud resistance zones.
Would you like help setting up entry/exit levels or risk-reward ratios?

SILVER: Short Signal with Entry/SL/TP
SILVER
- Classic bearish setup
- Our team expects bearish continuation
SUGGESTED TRADE:
Swing Trade
Short SILVER
Entry Point - 36.935
Stop Loss - 37.204
Take Profit - 36.369
Our Risk - 1%
Start protection of your profits from lower levels
Disclosure: I am part of Trade Nation's Influencer program and receive a monthly fee for using their TradingView charts in my analysis.
❤️ Please, support our work with like & comment! ❤️

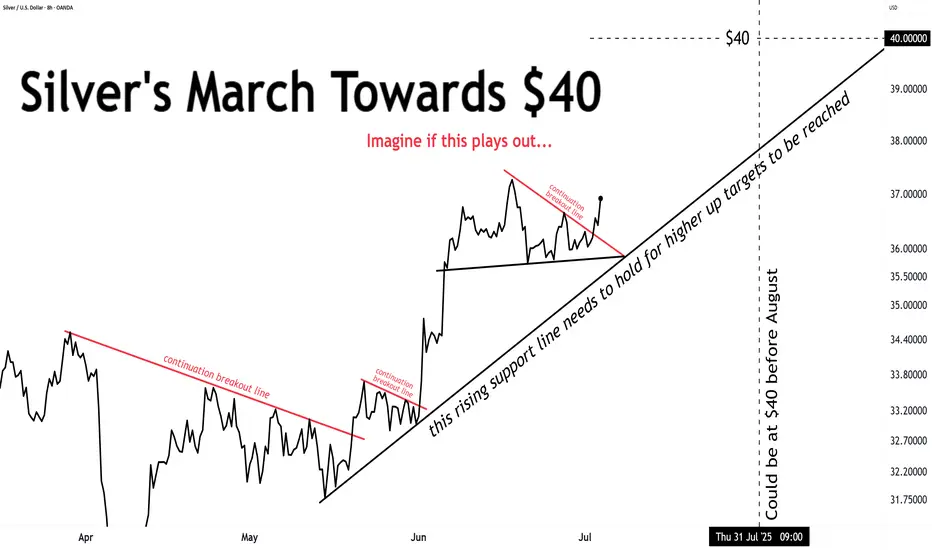
And silver's ride to $40 continues ...this rising support line needs to hold for higher up targets to be reached
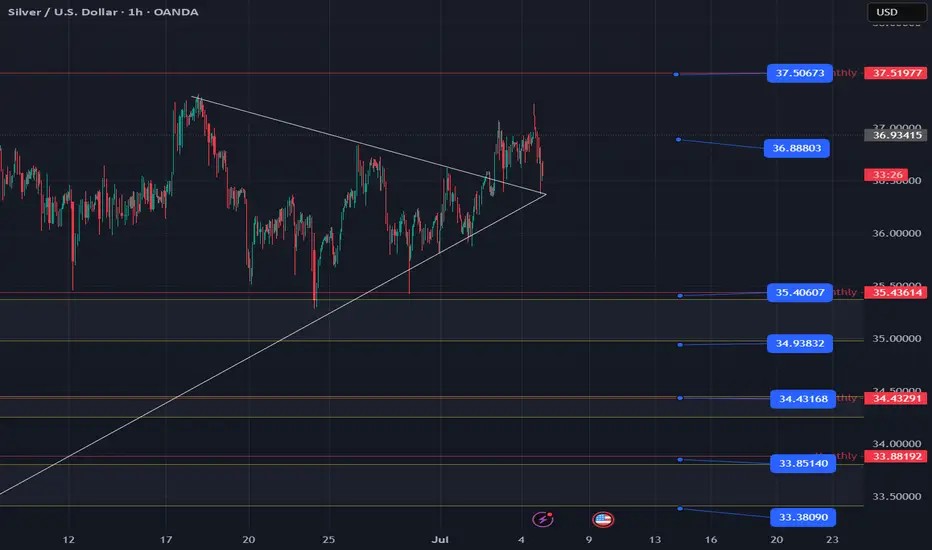
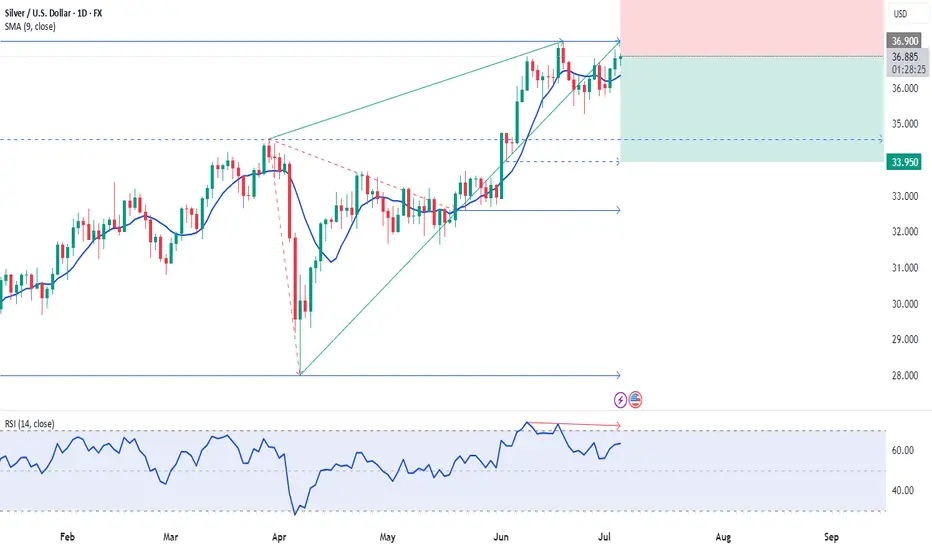
04.07.2025 #XAGUSDSELL 36.9000 | STOP 38.5000 | TAKE 34.7000 - 33.9500 | Medium-term investment forecast on silver deal for the next 2-3 months. On the D1 chart we observe the technical structure of the completion of the ascending wedge. Formation of double top of highs. We also consider a probable potential for the output of volumes in this instrument and a gradual decline to a pronounced support range on the background of growing interest and the potential of the US dollar until the end of summer.
XAGUSD Strong accumulation waiting for a break-out. Silver (XAGUSD) has been trading within a 3-month Channel Up pattern and since the June 18 Higher High, it has entered a Descending Triangle.
This has previous been an Accumulation pattern, which after broken to the upside, it led to June's High. Similarly, we expect a bullish break-out once the 4H RSI breaks above its MA, and as long as the 4H MA200 (orange trend-line) holds, we expect a +15.50% minimum rise (like the first Bullish Leg of the Channel Up), with our Target se at 40.500.
-------------------------------------------------------------------------------
** Please LIKE 👍, FOLLOW ✅, SHARE 🙌 and COMMENT ✍ if you enjoy this idea! Also share your ideas and charts in the comments section below! This is best way to keep it relevant, support us, keep the content here free and allow the idea to reach as many people as possible. **
-------------------------------------------------------------------------------
💸💸💸💸💸💸
👇 👇 👇 👇 👇 👇

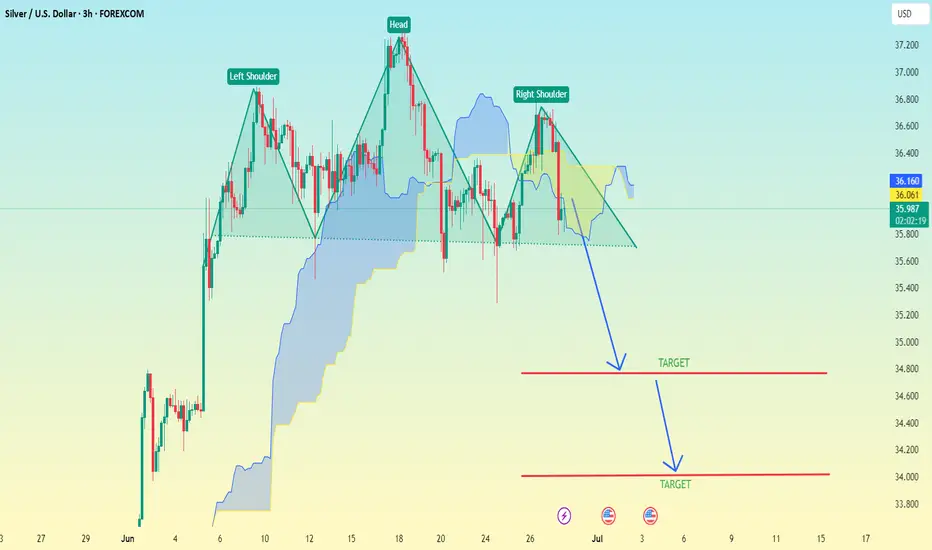
(XAG/USD – Silver vs USD–3h timeframe) Head and Shoulder Pattern(XAG/USD – Silver vs USD – 3h timeframe), a Head and Shoulders pattern is clearly marked, which is a bearish reversal signal.
Key Details:
Pattern: Head and Shoulders
Neckline: Approximately at the 35.90–36.00 level
Breakout Direction: Down
Measured Move Target Method: To estimate the target, subtract the height from the head to the neckline from the neckline level.
---
Target Estimation:
Head High: ~36.95
Neckline Level: ~35.90
→ Difference: 36.95 - 35.90 = 1.05
Target 1 (conservative): 35.90 - 1.05 = 34.85
Target 2 (aggressive): Based on the secondary arrow and extended support, it's pointing toward ~34.00–34.20
---
📉 Final Targets:
✅ First Target: 34.85
✅ Second Target: 34.00–34.20 (if bearish momentum continues)
Let me know if you want stop-loss or risk management levels included.
This will tell you if silver can get to $40 before August.This will tell you if silver can get to $40 before August.
The price chart is ALL that matters.
The rest is noise.

Final Stretch for SilverSilver OANDA:XAGUSD COMEX:SI1! AMEX:SLV continues to follow the plan
At this stage, price has either:
already completed wave ④ and is now entering wave ⑤,
or wave ④ is still in progress, currently in its final stages.
In either case, the wave structure suggests a final impulsive move upward into the $38–40 range — the climactic fifth wave of the sequence.
Volume Profile Analysis:
Price is currently trading between σ1 and σ2, with room to expand toward σ3 (~$40) if momentum continues.
The accumulation phase is behind us — we are now in the distribution zone.
Price action also supports the bullish outlook:
Last month closed with a strong bullish candle, showing no signs of reversal.
Keeping an eye on the move — the $38–40 zone remains the key target for the completion of this impulse.
#Silver #XAGUSD #ElliottWave #VolumeProfile #PriceAction #WaveAnalysis

Nasdaq, BTCUSD, ETHUSD, EURUSD & XAGUSD Daily Trade SetupsIn this update we review the recent price action in the Nasdaq, Bitcoin, Ethereum, Euro & Silver and identify the next high probability trade setups and price objectives to target. To review today's video analysis click here!

Bearish drop off pullback resistance?XAG/USD is rising towards the resistance level which is a pullback resistance and could drop from this level to our take proft.
Entry: 36.70
Why we like it:
There is a pullback resitance.
Stop loss: 37.24
Why we like it:
There is a pullback resistance level.
Take profit: 34.78
Why we like it:
There is a pullback support level that lines up with the 127.2% Fibonacci extension.
Enjoying your TradingView experience? Review us!
Please be advised that the information presented on TradingView is provided to Vantage (‘Vantage Global Limited’, ‘we’) by a third-party provider (‘Everest Fortune Group’). Please be reminded that you are solely responsible for the trading decisions on your account. There is a very high degree of risk involved in trading. Any information and/or content is intended entirely for research, educational and informational purposes only and does not constitute investment or consultation advice or investment strategy. The information is not tailored to the investment needs of any specific person and therefore does not involve a consideration of any of the investment objectives, financial situation or needs of any viewer that may receive it. Kindly also note that past performance is not a reliable indicator of future results. Actual results may differ materially from those anticipated in forward-looking or past performance statements. We assume no liability as to the accuracy or completeness of any of the information and/or content provided herein and the Company cannot be held responsible for any omission, mistake nor for any loss or damage including without limitation to any loss of profit which may arise from reliance on any information supplied by Everest Fortune Group.

Possible Movement of Silver: Watch the Golden Zone RetestSilver has broken above a two-top downtrend with a strong bullish impulse, marked by a long white candle. Currently, it appears to be forming a Head and Shoulders pattern. A break below the neckline and the supporting uptrend could lead price back to the golden zone—around the base of the breakout candle—before resuming its upward move toward the main target near $39.

Silver Dip Offers a Long OpportunityThis is a good opportunity to go long on silver.
Nothing has changed fundamentally — I still expect the asset to move higher.
The recent drop following the economic data release is giving me a chance to add to my silver position.

Rotation from over valued equities in silver about to happen...I hear many people are selling their silver, thinking $36 is a high. But this is still the stealth accumulation phase. We will see a rotation of trillions into silver, that has a market cap of a few hundred billion, including miners.
In my book, "Silver is Money" we see stocks, bonds and government debt has kept a lid on inflation.
This coming rotation will bring about the biggest monetary change seen in generations.

“Can This XAG/USD Setup Make You the Next Market Thief?”🏴☠️ Operation Silver Swipe — Thief Trading Heist Plan for XAG/USD
🚨 Target Locked: The Silver Vault 🧳🎯
🌟Hi! Hola! Ola! Bonjour! Hallo! Marhaba!🌟
Dear Market Hustlers & Chart Whisperers, 🕵️♂️💼📉💰
Step into the shadows with our stealth plan based on our signature Thief Trading Style—a mix of smart technicals and crafty fundamentals. Today, we’re eyeing XAG/USD (Silver) for a clean sweep. Here's how to gear up for the breakout job:
🎯 Entry Zone — “The Heist Is On!” 💥
📍Key Level: Break & Retest above 37.000 – that's your cue to act.
🔑Strategy:
Buy Stop Orders: Set above the breakout level
Buy Limit Orders: Use recent 15/30M swings for a sneaky pullback entry 🎯
🛑 Stop Loss — “Every Thief Has a Backup Plan” 🎭
Place your SL like a pro, not a panic button!
📌Recommended: Around 35.660 using the 4H nearest candle wick swing low place after the breakout entry.
⚠️Tip: Adjust based on your risk appetite, lot size, and number of entries. You’re the mastermind, not a minion.
🎯 Target — “Escape Route” 🏃♂️💸
📌 First checkpoint: 38.800
📌 Or take your loot early if the heat rises! (Overbought zones, trend traps, or reversal zones)
💡 Scalper's Shortcut 💡
Go only long for safety. If you’ve got the cash stack, jump in fast. If you’re more of a sneaky swing trader, follow the roadmap and trail your SL to secure that bag 🧳📈
🔍 Market Status
Silver’s in a Neutral Phase – but signs point to an upward getaway 🚀
Fueling this momentum:
Macro & Fundamental trends
COT Positioning
Intermarket Clues
Sentimental Signals
🔗 Read the full breakdown check there 👉🔗🔗🌏🌎!
📢 Trading Alert — News Release Caution ⚠️
Don’t get caught mid-escape during news bombs! 💣
✅ Avoid fresh entries during high-impact events
✅ Use trailing SL to lock in your gains and cover your tracks
💖 Smash the Boost Button if you vibe with this plan 💥
Support the crew and help keep the charts hot and the loot flowing. Your boost powers up our next big heist 🚁🔥
📡 Stay tuned for more street-smart setups... we rob the charts, not the rules! 🐱👤💸📊💎

XAG/USD Daily AnalysisPrice is moving within a bullish channel, which is itself situated inside a bigger bullish structure.
The most recent price action appears to be a consolidation within the uptrend.
Price may possibly be setting up for another impulsive move towards the top of structure for a 3rd test.
If you agree with this analysis, look for a trade that meets your strategy rules.

SLIVER Weekly patternJust another view from the weekly chart. To give confirmation of the daily bias

Watching Silver Prices After Recent HighsI see 3 main scenarios for silver's next few moves. I don't expect its lower support levels to be tested if the pattern represents the yellow path. I expect the green scenario to be the most likely outcome. Blue wouldn't surprise me either ($$) especially as the dollar's performance has a downward momentum.
DYOR
Trade Slick

Long XAGUSDXAGUSD has been holding the breakout of this wedge as well as the 8MA and 21MA. I like longs here using a break/hold below the 21MA as a stop. I would target 37, 37.5 initially and if we can see a break/hold of 37.5 I would target 39, 40.