Silver - Short Term Buy IdeaM15 - Strong bullish move.
No opposite signs.
Currently it looks like a pullback is happening.
Expecting further continuation higher until the two Fibonacci support zones hold.
If you enjoy this idea, don’t forget to LIKE 👍, FOLLOW ✅, SHARE 🙌, and COMMENT ✍! Drop your thoughts and charts below to keep the discussion going. Your support helps keep this content free and reach more people! 🚀
--------------------------------------------------------------------------------------------------------------------
Disclosure: I am part of Trade Nation's Influencer program and receive a monthly fee for using their TradingView charts in my analysis.
XAGUSD trade ideas

XAGUSD buy analysis, but it will require lots of patience.Currently, the bears are dominating silver. on this post, i shared my view concerning what im suggesting on silver, sharing my PEPPERSTONE:XAGUSD analysis from dailytf till h4.

SILVER BEARS ARE STRONG HERE|SHORT
SILVER SIGNAL
Trade Direction: short
Entry Level: 3,425.8
Target Level: 3,337.2
Stop Loss: 3,484.9
RISK PROFILE
Risk level: medium
Suggested risk: 1%
Timeframe: 3h
Disclosure: I am part of Trade Nation's Influencer program and receive a monthly fee for using their TradingView charts in my analysis.
✅LIKE AND COMMENT MY IDEAS✅

US30, NVDA, EURUSD & XAGUSD Daily Trade SetupsIn this update we review the recent price action in the Dow Jones, Nvidia, Euro and Silver and identify the next high-probability trade set ups and price objectives to target. To review today's video analysis click here!

Why Silver Must Go Down — And Why It's No Safe HavenOANDA:XAGUSD TVC:SILVER Silver is often misunderstood. Investors treat it like a hedge against uncertainty—a supposed "safe haven" asset. But in reality, silver is not a store of value. It’s an industrial metal, one that quietly fuels inflation and raises the cost of everyday life.
📈 High Silver Prices = Hidden Inflation
Silver plays a key role in the modern economy. It’s a vital component in the electronics we use, the vehicles we drive, and even the medical products we depend on.
When silver prices rise, manufacturing costs increase. That leads to higher prices for consumers. Unlike gold, which sits in vaults, silver is used up. It goes into your phone, your TV, your car, your solar panel—then it's gone. Rising silver prices ripple through the global supply chain.
⚠️ The effects:
Smartphones and laptops become more expensive.
Solar panels cost more, slowing clean energy adoption.
Medical tools and antibacterial products go up in price.
EVs become harder to produce at scale.
Inflation quietly worsens for the average person.
❌ Silver Is NOT a Safe Haven
The idea that silver is a safe-haven asset is a dangerous myth.
Unlike gold, silver is tied closely to industrial demand. When economies slow down, silver usually underperforms. It’s volatile, reactive, and far from stable. While gold often rises in a crisis, silver behaves like a commodity—not a financial refuge.
Quick facts:
Silver is more volatile than gold.
It follows manufacturing trends, not market fear.
Its price is highly speculative and sentiment-driven.
📉 Why Silver Needs to Correct
Today’s silver prices are being driven more by emotion and narrative than fundamentals. Industrial demand is steady—not surging. Yet prices are inflated as if silver is scarce or irreplaceable. A correction in silver would:
Lower production costs for key industries
Ease global inflation pressure
Help consumers avoid price hikes on essential goods
Reduce over-speculation and volatility in the metals market
📋 Real-Life Items That Contain Silver
Understanding silver’s true role means looking at the real-world items that use it every day:
🔌 Electronics:
Smartphones (iPhones, Androids)
Laptops, tablets, TVs
Game consoles, remotes
Smartwatches, fitness trackers
🏠 Home:
Refrigerators, ovens, washers, dryers
LED light bulbs
Smart home devices (Alexa, Nest)
Air conditioners, thermostats
🚗 Vehicles:
Electric vehicles and battery systems
Infotainment systems
Defoggers, sensors, GPS units
⚡ Energy:
Solar panels (photovoltaic cells)
Electrical wiring, circuit breakers, fuses
🧬 Healthcare:
Wound dressings, surgical tools
Dental fillings, medical tubing
Antibacterial creams, hospital gear
👚 Clothing:
Antimicrobial athletic wear
Silver-infused socks, uniforms
🔄 Other:
Water purifiers
Air purifiers
Jewelry and coins
Musical instruments
Photography (traditional film)
🧠 Final Thoughts
Silver is not a safe haven—it’s a cost driver. Every dollar it rises adds pressure to the real economy. If you're serious about inflation, energy access, and technological progress, you should hope silver goes down, not up.
A lower silver price doesn’t hurt progress—it fuels it.

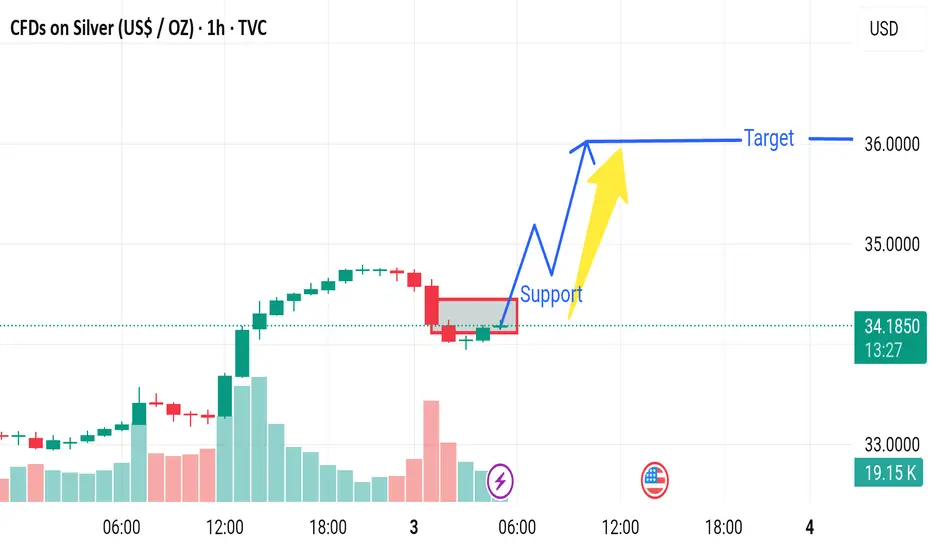
XAGUSD Analysis – Market Mapping Concept (MMC) + Target🧭 Overview:
Today's Silver price action presents a textbook example of how MMC can guide traders through:
Identifying the smart money accumulation phase.
Anticipating breakout momentum .
Locating key reversal areas based on previous liquidity maps and structural shifts.
We are currently observing Silver in the early stages of a structural retest after a breakout from consolidation. This gives rise to two powerful scenarios: either a bullish continuation after structure confirmation or a deeper retracement if the structure fails.
🔍 Detailed Chart Explanation:
🔷 1. Volume Contraction Phase
The market spent multiple sessions forming a symmetrical wedge, visible by narrowing price movement and consistent lower highs and higher lows.
This was accompanied by declining volume, signaling accumulation/distribution by institutional players.
The wedge served as a liquidity trap, drawing in both early shorts and longs before the true direction was revealed.
✅ MMC Principle: Volume contraction often precedes major breakouts as market makers build positions quietly.
🔷 2. SR Interchange – Breakout Confirmation
Price finally broke above the upper trendline, triggering a bullish impulse and confirming SR interchange (resistance turned support).
This move was backed by a strong bullish candle, showing aggressive participation and institutional involvement.
📌 This breakout candle set the tone for a structural shift—transforming from sideways to upward momentum.
🔷 3. Rapid Expansion Toward Previous Target Zone
After the breakout, price accelerated directly into a previous high (target) zone marked in blue.
According to MMC, this zone often acts as a liquidity magnet, where late buyers enter and professional traders take profits.
A rejection wick formed right after touching this zone—classic smart money behavior, catching retail traders chasing the move.
✅ MMC Principle: Prior highs/lows are not just resistance—they're engineered targets for liquidity collection.
🔷 4. Target + Reversal Area
After the rejection, price declined back into the Target + Reversal Zone. This area aligns with MMC’s ideal structure for potential buy-side re-accumulation.
This zone is where previous volume imbalances occurred, meaning it is likely to act as support if the bullish trend is to continue.
📊 Current price is consolidating within this zone, suggesting a possible bullish continuation if structure holds.
🔷 5. Structure Mapping – The Key to MMC
The most recent price reaction highlights the importance of structure mapping: identifying areas where market logic aligns with trader behavior.
The bearish pullback into the structure zone may complete a retest, and traders are watching closely for bullish confirmation.
⚙️ Technical Summary:
Key Zone Description
Volume Contraction Signals accumulation before breakout.
SR Interchange Breakout level where resistance turned to support.
Previous Target Zone Liquidity pool, ideal for institutional exits or reversal.
Target + Reversal Zone Demand zone where the trend may resume if confirmed.
Structure Mapping Current phase; price is aligning into new bullish structure or preparing for drop.
🧭 What to Watch Next:
🔹 Scenario A – Bullish Case:
Price holds within the Target + Reversal Zone.
Confirmation via bullish engulfing candle or breakout of lower high.
Target: retest of 34.80+, then potential extension to 35.20.
🔹 Scenario B – Bearish Case:
Breakdown below structure base at 33.85–34.00.
Could lead to a deeper correction toward 33.40 or 32.80 (previous volume node).
📌 Volume + Structure = Decision Point. Next few candles are crucial for validating direction.
🛠 Strategy & Execution:
Approach: Wait for confirmation candles before entering. Avoid reacting impulsively within the structure zone.
Entry Idea:
Buy on bullish confirmation in the reversal zone.
Place stop below structure invalidation.
Target the top of the previous target zone or higher.
Risk Management: Use tight SLs below 33.85 and scale in only on confirmation.
📅 Timeframe: 1H
🔭 Sentiment: Cautiously Bullish
🎯 Technique: MMC Structure Mapping + Volume-Based Targeting
🧠 Final Thoughts:
This XAGUSD chart showcases the predictive power of MMC when applied correctly. By understanding where smart money operates, traders can improve accuracy, timing, and risk control.
📌 If you found this analysis helpful, like and follow for daily insights. Drop your thoughts in the comments—do you trade MMC-style setups?

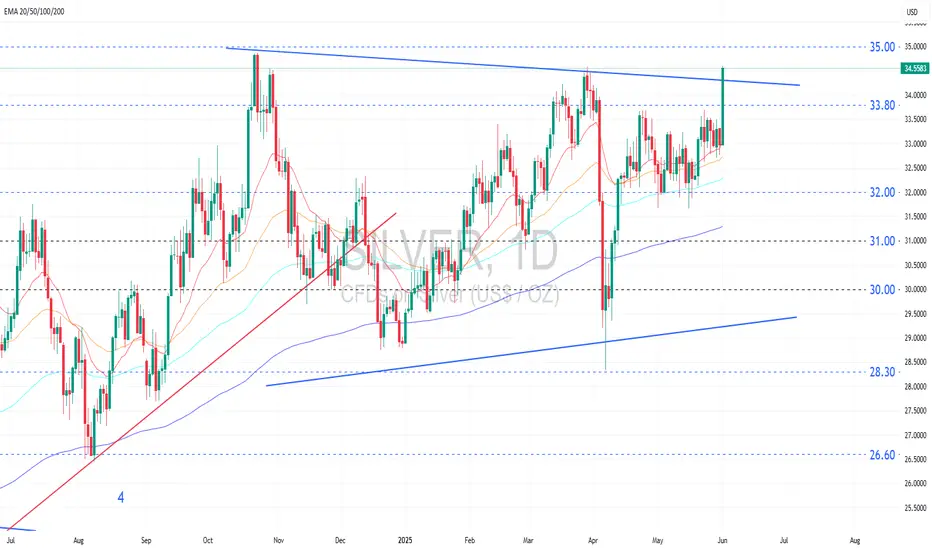
Silver Price Hits Year-to-Date HighSilver Price Hits Year-to-Date High
As shown on the XAG/USD chart, silver prices rose on Monday, surpassing the previous high of the year, which was set on 28th March at around $33.50 per ounce.
Why Is Silver Rising?
A bullish driver came from statements made by the White House. According to media reports:
→ US President Donald Trump announced on Friday evening plans to double tariffs on steel and aluminium imports to 50%, starting 4th June. This intervention in the global metals market may have also impacted silver prices, given silver’s significant industrial value.
→ Trump's claims that China violated the trade agreement reached in Geneva last month further cast doubt on the prospects of a phone call between Trump and Chinese President Xi Jinping.
Technical Analysis of the XAG/USD Chart
Today’s bearish candlestick (marked with a red arrow) indicates that sellers are becoming active, willing to open short positions near the 2025 high. From a technical analysis perspective, there are signs of:
→ a bearish engulfing candlestick pattern forming;
→ a false breakout above the March high (trapping bullish traders).
However, the bulls may attempt to keep the price in the upper half of the emerging ascending channel (shown in blue), relying on support from the former resistance level at $33.67.
This article represents the opinion of the Companies operating under the FXOpen brand only. It is not to be construed as an offer, solicitation, or recommendation with respect to products and services provided by the Companies operating under the FXOpen brand, nor is it to be considered financial advice.

XAGUUSD BUY 34.70On the daily chart, XAGUUSD broke through strongly yesterday, and the short-term bullish trend is obvious. At present, we can pay attention to the support near 33.70. If it falls back and stabilizes, we can consider continuing to buy. The upward target is around 35.00.

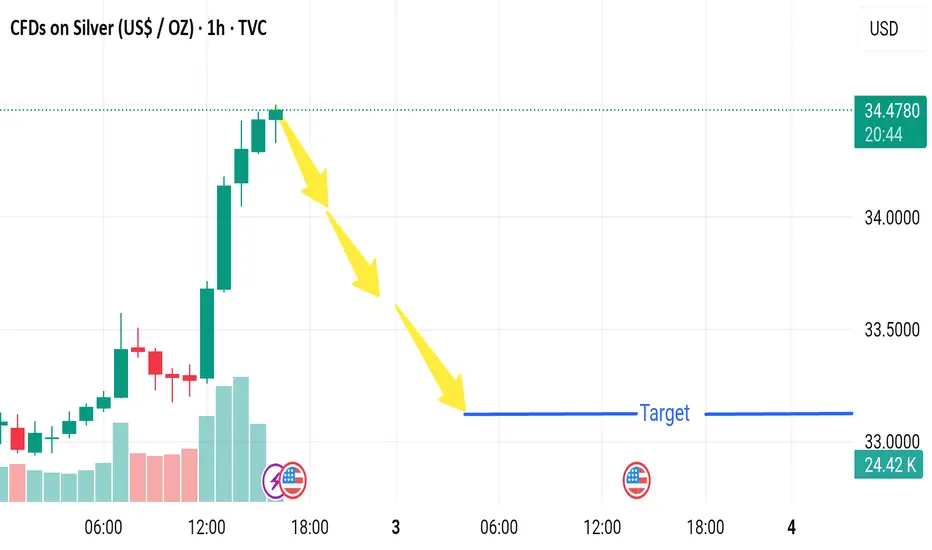
Market next move ⚠️ Disruption of the Bullish Analysis:
1. Weak Support Zone
The highlighted support area is not strongly tested (only a couple of candles touch it).
Low volume around support may indicate lack of buying interest at that level.
If price breaks below this support, the bullish setup becomes invalid.
2. Bearish Volume Spike
There's a noticeable high volume red candle during the recent drop.
This could imply strong selling pressure, not just profit-taking.
Rising volume on red candles often precedes further downside.
3. Lower High Formation
The price may create a lower high near the projected bounce zone.
If that happens, the market structure would shift to bearish.
A lower high and a break below support confirms a downtrend.
Silver 12 months consolidation box completedSilver 12 months consolidation box completed. On the way to $40, then $50, then blue sky...... get ready. Position position.

SILVER TO 40$ HELLO TRADERS
As i can see Silver is still trading inside a upward channel and did not created any big moves like Gold and its under value i am expected a boost from this zone to 40 $ incoming days if it did notr break the channel friends its just a trade idea share ur thoughts with us we love ur comments and support Stay Tuned for more updates

Silver - How long have you waited?Silver 30 year Cup & handle break out.
Is the silver squeeze finally happening?
Credit to @EdTheLorax calling it

Silver(XAG) Long Set-UPTVC:SILVER MCX:SILVER1!
📈 𝐏𝐫𝐨𝐟𝐞𝐬𝐬𝐢𝐨𝐧𝐚𝐥 𝐓𝐚𝐤𝐞𝐚𝐰𝐚𝐲:
𝐁𝐮𝐥𝐥𝐢𝐬𝐡 𝐁𝐢𝐚𝐬 🚀
The technical setup points toward a potential breakout after a 13-year consolidation.
If silver breaks above ~$35 convincingly on a monthly close, the next key target would be $48–$50 (2011 highs).
⚠️ 𝐂𝐚𝐮𝐭𝐢𝐨𝐧
This is a major resistance; failure to break above it may result in a pullback or consolidation.
A rejection here would keep silver in the range-bound regime, especially if the trendline support (~$30) breaks.
🧠 𝐒𝐭𝐫𝐚𝐭𝐞𝐠𝐢𝐜 𝐕𝐢𝐞𝐰
Position traders/investors might look to accumulate on dips near the trendline or on a confirmed breakout retest.
𝐑𝐢𝐬𝐤 𝐦𝐚𝐧𝐚𝐠𝐞𝐦𝐞𝐧𝐭 𝐢𝐬 𝐜𝐫𝐮𝐜𝐢𝐚𝐥 𝐡𝐞𝐫𝐞: set stops below the trendline or prior swing lows.
Macro tailwinds (inflation, rate cuts, weakening USD, geopolitical stress) will play a pivotal role in confirming this breakout technically and fundamentally

Silver got a healthy breakout and appears reasonably trend folloSilver got a healthy breakout and appears reasonably attractive as a buy following the signal.
1. After an extended consolidation, silver has broken out of its upper range to retest the previous swing high.
This breakout from its sideways range is technically significant, reinforced by a strong bullish candlestick that indicates robust upward momentum. Another $0.50 move would mark the highest level in over 12 years, which could attract a surge of speculative buying which may ignite the following surge.
2. Fundamentally, silver prices are rising in tandem with gold, as silver serves as an alternative investment in the precious metals group and acts as a reliable safe-haven asset, making this rally justifiable.
3. Especially in the current situation, where economic fragility, unresolved trade issues, and escalating geopolitical tensions are all pushing investors toward precious metals.
4. In addition, the unusually large amount of US debt maturing during this month has contributed to a weaker US dollar, which in turn provides further support for precious metal prices.
Analysis by: Krisada Yoonaisil, Financial Markets Strategist at Exness
Market next target 🟢 Disruptive Bullish Scenario:
🔁 1. Healthy Bull Flag or Consolidation
The steep rally (+4.5%) may not lead to a breakdown.
The current pause near $34.50 could be a bull flag or tight range consolidation, common in continuation patterns.
🔼 2. Volume Supports the Move
Notice the strong rising volume on the breakout candles.
This shows genuine buyer interest, not a pump-and-dump move.
🧲 3. Breakout Holding Above Previous Highs
Price is holding above previous resistance, which now acts as support around $34.00–$34.20.
Holding this zone can lead to a retest and breakout to new highs.
📈 4. Strong Macro Bullish Catalyst
The U.S. event icon suggests important data is near.
If the data (like weaker dollar or inflation concerns) supports metals, Silver could surge further rather than drop.
SILVER: The Market Is Looking Down! Short!
My dear friends,
Today we will analyse SILVER together☺️
The market is at an inflection zone and price has now reached an area around 34.374 where previous reversals or breakouts have occurred.And a price reaction that we are seeing on multiple timeframes here could signal the next move down so we can enter on confirmation, and target the next key level of 33.902..Stop-loss is recommended beyond the inflection zone.
❤️Sending you lots of Love and Hugs❤️

SilverCurrent Price: $32.33
Mid-point: $32.07
Upside: $33.21, $33.77, $34.40 and $35.03
Downside: $30.94, $30.38, $29.75 and $29.11
Stoploss: $31.49
Resistance: $32.66

SILVER Massive Long! BUY!
My dear friends,
My technical analysis for SILVER is below:
The market is trading on 32.985 pivot level.
Bias - Bullish
Technical Indicators: Both Super Trend & Pivot HL indicate a highly probable Bullish continuation.
Target - 33.258
About Used Indicators:
A pivot point is a technical analysis indicator, or calculations, used to determine the overall trend of the market over different time frames.
Disclosure: I am part of Trade Nation's Influencer program and receive a monthly fee for using their TradingView charts in my analysis.
———————————
WISH YOU ALL LUCK

#336025 | XAGUSD Supply Zone 1:4XAGUSD Supply Zone Appears in H4 Time Frame Looking Price Action for Long Term Sell Risk and Reward Ratio is 1:4
After 50 pips Profit Set SL Entry Level
"DISCLAIMER" Trading & investing business is "Very Profitable" as well as risky, so any trading or investment decision should be made after Consultation with Certified & Regulated Investment Advisors, by Carefully Considering your Financial Situation.

Market next target 🔍 Original Analysis Summary:
Bullish Continuation is expected.
Price is projected to rise with a series of higher highs (yellow arrows).
Target area is marked above 34.000 USD.
---
⚠️ Disruption (Bearish/Neutral Counter-View):
1. Flat Consolidation Zone = Distribution Risk
Price has been moving sideways in a tight range (approx. 32.90–33.15), indicating indecision.
This could be a distribution phase, where smart money sells into retail bullishness.
---
2. Weak Volume Profile
Volume is relatively low and not increasing with attempted bullish moves.
A strong breakout should be backed by volume, but current price action lacks conviction.
---
3. False Breakout Trap Risk
Price is testing the upper boundary of a range.
A small push higher could be a bull trap, especially if it reverses back inside the range — a common fake-out setup.

XAG/USD H4 AnalysisWith 3 previous rejections of $32.80 over the back end of May, we saw a glimpse of a 4th at the close of play last Friday.
There is a potential for buys if you agree with this analysis and it meets your strategy rules.

Silver is in the Bearish trend after testing ResistanceHello Traders
In This Chart XAGUSD HOURLY Forex Forecast By FOREX PLANET
today XAGUSD analysis 👆
🟢This Chart includes_ (XAGUSD market update)
🟢What is The Next Opportunity on XAGUSD Market
🟢how to Enter to the Valid Entry With Assurance Profit
This CHART is For Trader's that Want to Improve Their Technical Analysis Skills and Their Trading By Understanding How To Analyze The Market Using Multiple Timeframes and Understanding The Bigger Picture on the Charts

Small Clues In A Big Breakout PatternSilver has been consolidating as of late and if there's one thing we no about contraction is that it eventually leads to expansion aka a breakout.
The issue with this particular setup is that based on location of the pattern, there's no predetermined directional bias for the breakout.
Therefor, what we're doing today is looking for small clues that the market has provided to give us any type of edge in predicting a breakout one way or another and guess what. WE FOUND SOME!
If you have any questions or comments, please leave them below!
Akil
