SILVER (XAGUSD): Time for Pullback📈SILVER appears to be oversold following yesterday's decline.
After testing a significant daily / intraday support level, there's a noticeable bullish reversal.
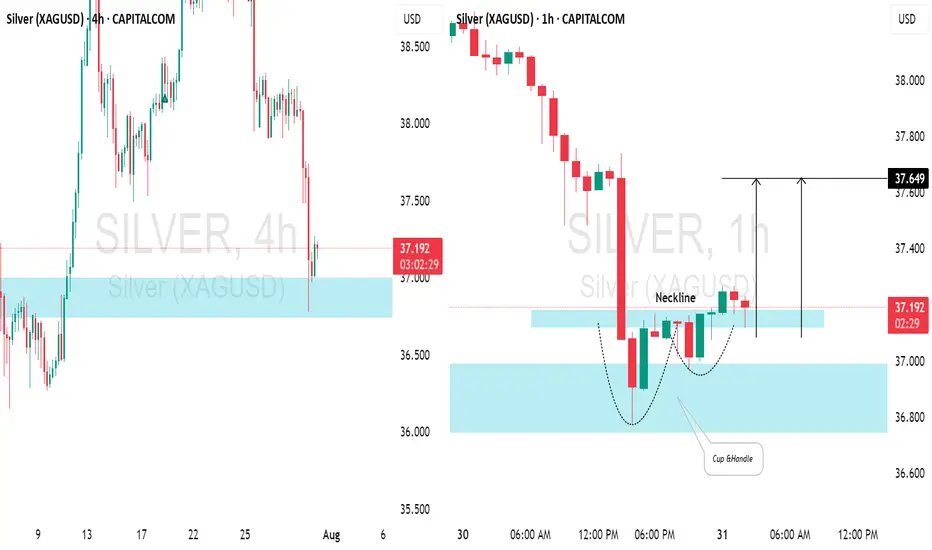
The price formed a cup & handle pattern on the hourly chart and has broken above its neckline. We can expect a pullback to at least 37.
XAGUSD: Correction May Be Over – Watch $37.60 BreakoutAfter reaching a local top around the $39.50 zone on July 24, Silver entered a normal corrective phase, with price dropping over 3,000 pips from top to bottom — roughly an 8% retracement.
📉 Despite the strength of the drop, the structure was clearly corrective, not impulsive. Even more, the move fo

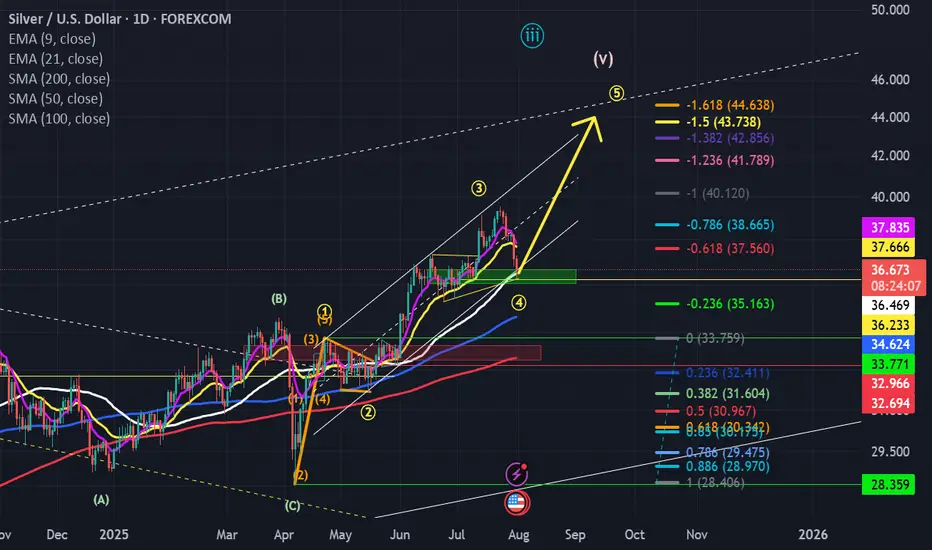
#XAGUSD: A Strong Bullish Move, Possible Target at $45?Silver is currently experiencing a correction, but the overall price remains bullish. Analysing the data, we can see a potential price reversal in our area of interest. Following the recent higher high, price is poised to create another record high. We should closely monitor volume and price behavio

One more move up and then we should sell for now....This pb has allowed the shorts to cash in...we are at signficant support (middle of prior funnel) and the bottom of the channel...in my opinion, we resume the move up...but I think $42-$44 zone is the likely pivot pt for a significan move back down...back to mid to low $30's...This current pb is wil
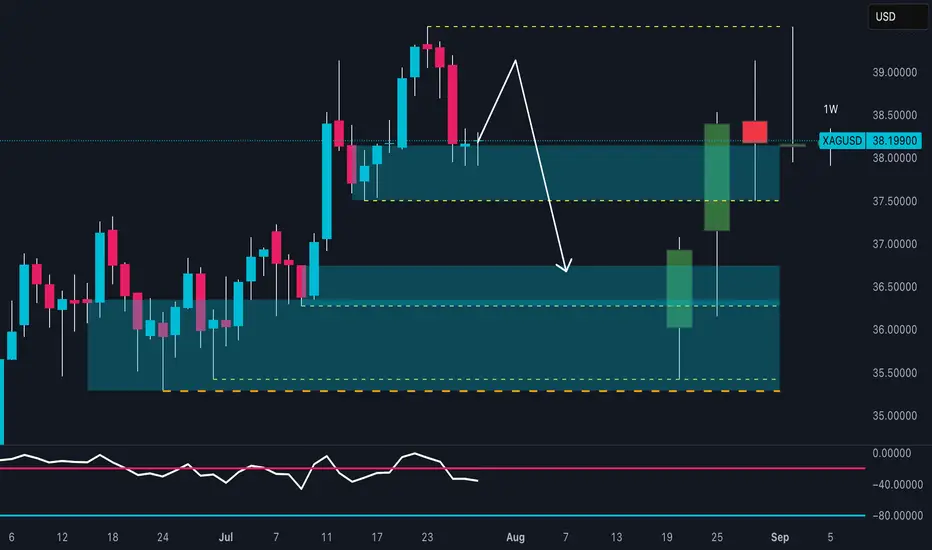
SILVER Is About to Collapse? Watch This Critical Supply Zone!Price recently tapped a high near 39.20 before sharply rejecting from the 38.80–39.20 supply zone, confirming strong selling pressure. The current structure shows:
- Supply zone tested and rejected
- Likely return to the previous demand zone (36.50–36.00)
- RSI is turning down, confirming loss of m
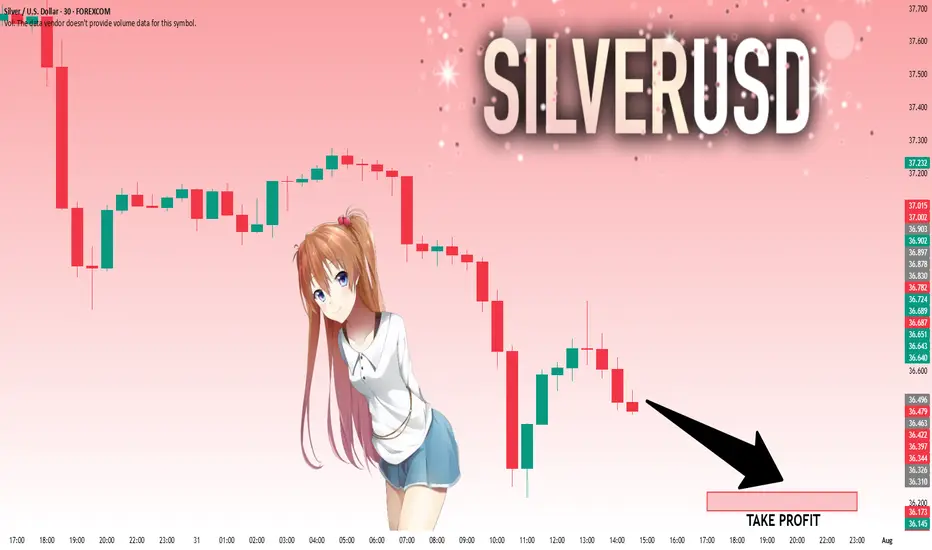
SILVER: Will Go Down! Short!
My dear friends,
Today we will analyse SILVER together☺️
The market is at an inflection zone and price has now reached an area around 36.490 where previous reversals or breakouts have occurred.And a price reaction that we are seeing on multiple timeframes here could signal the next move down s
SILVER (XAGUSD): Bullish Reversal from Support Silver reacted significantly to the highlighted intraday resistance level during Friday's New York session.
I noticed a small double bottom pattern and the emergence of a bullish engulfing candle. I anticipate a pullback to the 37.72 level.

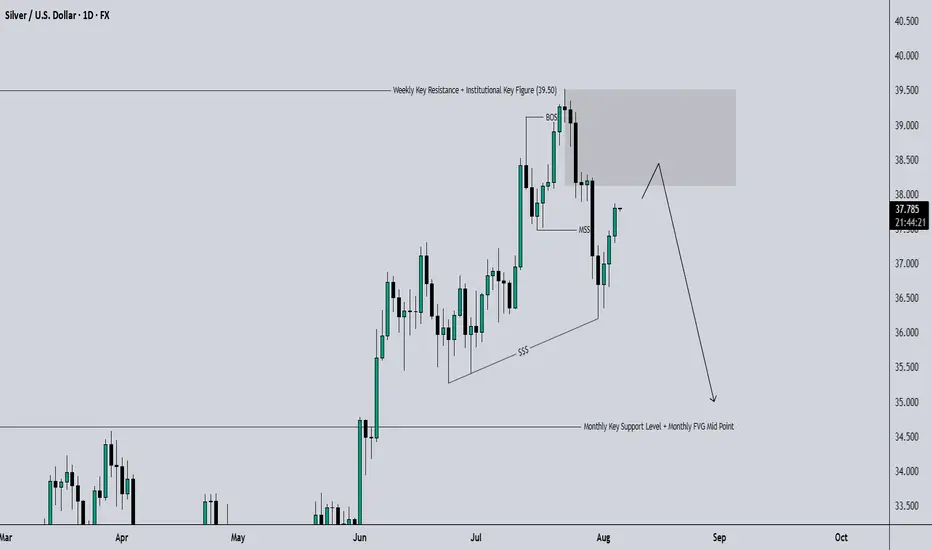
XAGUSD SWING: SHORT-TERM BEARISH OPPORTUNITY Hi there,
For Silver, I am long term bullish but we have a set up for some short opportunity.
As annotated, we are primed to see lower prices... between 34 - 34.5
If this happens, I'd resume looking for massive long opportunities.
You might want to keep this on your radar.
Cheers,
Jabari
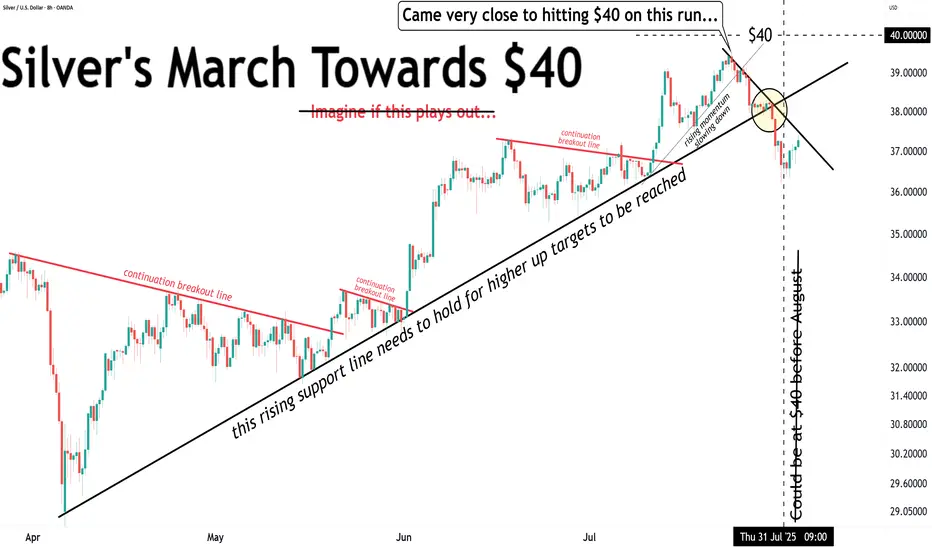
SILVER Bullish SetupSilver has been in a clear Bullish Trend Recently, and we are looking Silver to continue bullish.

Silver came very close to the $40 target ($39.52).Silver came very close to the $40 target ($39.52).
Currently in correction mode.
Nothing to see here... for now.
See all ideas
Displays a symbol's price movements over previous years to identify recurring trends.