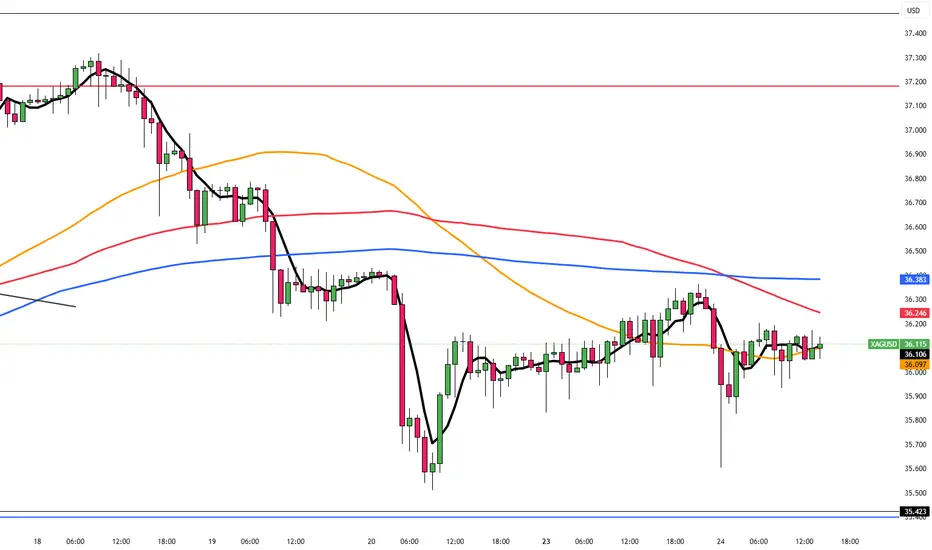
Bearish reversal off pullback resistance?The Silver (XAG/USD) is re4acting off the pivot which has been identified as a pullback resistance and could drop to the 1st suport.
Pivot: 36.76
1st Support: 35.73
1st Resistance: 37.29
Risk Warning:
Trading Forex and CFDs carries a high level of risk to your capital and you should only trade with money you can afford to lose. Trading Forex and CFDs may not be suitable for all investors, so please ensure that you fully understand the risks involved and seek independent advice if necessary.
Disclaimer:
The above opinions given constitute general market commentary, and do not constitute the opinion or advice of IC Markets or any form of personal or investment advice.
Any opinions, news, research, analyses, prices, other information, or links to third-party sites contained on this website are provided on an "as-is" basis, are intended only to be informative, is not an advice nor a recommendation, nor research, or a record of our trading prices, or an offer of, or solicitation for a transaction in any financial instrument and thus should not be treated as such. The information provided does not involve any specific investment objectives, financial situation and needs of any specific person who may receive it. Please be aware, that past performance is not a reliable indicator of future performance and/or results. Past Performance or Forward-looking scenarios based upon the reasonable beliefs of the third-party provider are not a guarantee of future performance. Actual results may differ materially from those anticipated in forward-looking or past performance statements. IC Markets makes no representation or warranty and assumes no liability as to the accuracy or completeness of the information provided, nor any loss arising from any investment based on a recommendation, forecast or any information supplied by any third-party.
XAGUSD01 trade ideas

Silver Wave Analysis – 26 June 2025- Silver reversed from key support level 35.50
- Likely to rise to resistance level 37.20
Silver recently reversed up from the key support level 35.50 (which stopped the previous minor correction iv at the start of June, as can be seen from the daily Silver chart below).
The support zone near the support level 35.50 was strengthened by the 20-day moving average and by the 38.2% Fibonacci correction of the sharp upward impulse from May.
Silver can be expected to rise to the next resistance level 37.20, which stopped the previous sharp impulse wave 3.

SILVER: Bulls Are Winning! Long!
My dear friends,
Today we will analyse SILVER together☺️
The recent price action suggests a shift in mid-term momentum. A break above the current local range around 36.463 will confirm the new direction upwards with the target being the next key level of 36.640 and a reconvened placement of a stop-loss beyond the range.
❤️Sending you lots of Love and Hugs❤️

Silver - Daily - LongXAGUSD D1 Continuation play with these confluence factors:
- Trending: Silver (Gold and other precious metals) trending up
- Support level: Consolidating around the $35 level
- Signal: Two bullish pin bars

SILVER Will Go Up! Buy!
Take a look at our analysis for SILVER.
Time Frame: 9h
Current Trend: Bullish
Sentiment: Oversold (based on 7-period RSI)
Forecast: Bullish
The market is on a crucial zone of demand 3,655.5.
The oversold market condition in a combination with key structure gives us a relatively strong bullish signal with goal 3,780.6 level.
P.S
We determine oversold/overbought condition with RSI indicator.
When it drops below 30 - the market is considered to be oversold.
When it bounces above 70 - the market is considered to be overbought.
Disclosure: I am part of Trade Nation's Influencer program and receive a monthly fee for using their TradingView charts in my analysis.
Like and subscribe and comment my ideas if you enjoy them!

Silver - M30What a breath-taking EDGE...
Wait for confirmation then enter...
Please Manage Your Risk.
#Silver #XAGUSD #Forex #chart #Edge #MJTrading

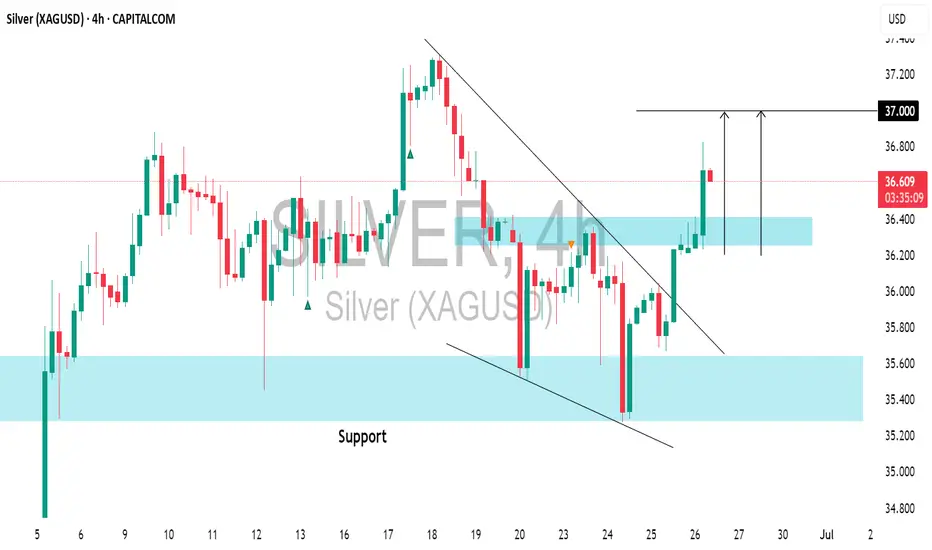
SILVER (XAGUSD): Intraday Bullish Confirmation?!📈SILVER appears to be on a bullish trend following a bounce off crucial daily/intraday horizontal support.
The price broke through a resistance line of a descending channel and created a local Change of Character (CHoCH).
There is a strong likelihood that the price will keep rising, with a target of 37.00.
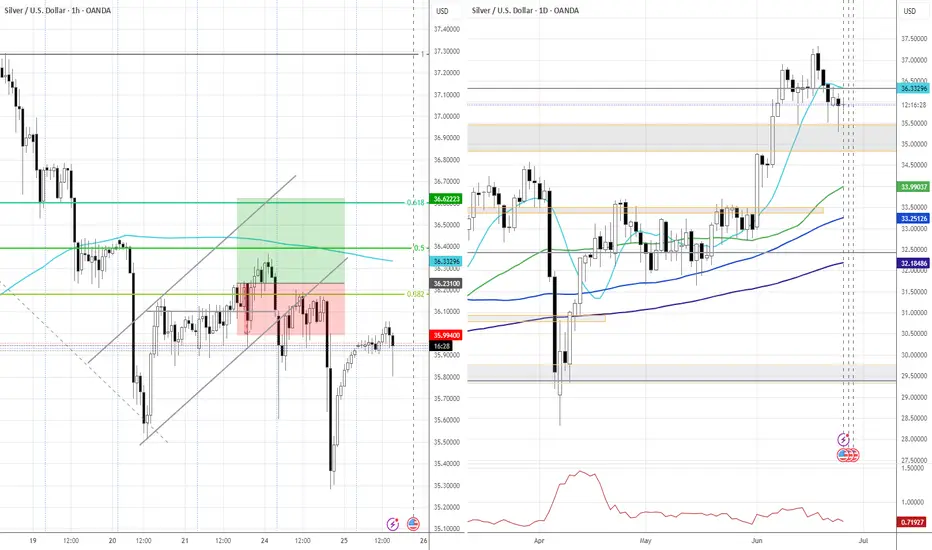
SILVER (XAGUSD): Buyers Show Strength
Silver is going to rise more, following a strong bullish sentiment this morning.
The price violated a strong falling trend line and an intraday horizontal resistance.
These 2 breakouts indicate a strong buying pressure.
The price may grow more today and reach 37.14 level.
❤️Please, support my work with like, thank you!❤️
I am part of Trade Nation's Influencer program and receive a monthly fee for using their TradingView charts in my analysis.

XAUGUSDModerately Bullish — supported by strong COT positioning and (presumed) favorable price action. Non-commercial (speculators):
Net long +66,700 contracts (up from previous week)
Indicates increased speculative confidence in rising silver prices. Growing net longs = strong buying interest


Silver - overview with Initiative AnalysisHey traders and investors!
Hourly Timeframe
📍 Context
The hourly chart is in a sideways range.
Currently, the buyer has the initiative, potential target 36.55.
📊 Key Actions
The 35.30 level on the hourly timeframe has worked well. This level marks the correction extreme within the dominant buyer initiative (i.e., an initiative where the correction is less than 50%).
A seller attack bar (IKC) targeting the lower boundary of the sideways range was absorbed by the buyer, and this absorption led to a renewed buyer. Targets visible on the chart - Hourly and daily timeframe: 36.55 and 36.89
Daily Timeframe
📍 Context
Currently, the buyer has the initiative, potential target 36.89.
📊 Key Actions
On the daily timeframe, there was also a seller IKC bar attacking the lower boundary of the buyer's initiative, which was bought back by the buyer.
🎯 Trade Idea
Potential buying patterns can now be monitored at: 36.20, 36.05, 35.67, 35.458
With targets set at: 36.55, 36.89, 37.32.
This analysis is based on the Initiative Analysis concept (IA).
Wishing you profitable trades!

This is the thing about silver & recessions...This is the thing about silver & recessions...
You can STILL have price rocket upwards heading into it.

Market next target 🚀 Bullish Disruption Analysis
1. Support Holds Above 35.80
The market may dip slightly but find strong support around the 35.90–36.00 zone.
Instead of continuing lower, buyers absorb the selling pressure, leading to a sharp bullish reversal.
2. Bullish Continuation After Consolidation
The current pullback could just be a healthy retracement following the strong recovery move from the previous dip.
This could form a bullish flag or ascending triangle, eventually breaking above 36.20 and pushing higher.
3. Volume Clue
If the pullback happens with declining red volume, while previous green candles had strong volume, it signals a temporary correction rather than a trend reversal.
Watch for a bullish engulfing candle backed by strong volume to confirm.
4. Macro Trigger / Fundamental Support
Any dovish signal from the Fed, rising inflation, or weakening USD could increase investor demand for silver, pushing prices back up.
A news-driven reversal could invalidate the bearish path quickly.
5. Bullish Price Target
If buyers take control, silver could retest and break above 36.30–36.40, aiming toward 36.60 or even 36.80.

Silver Long Setup–Breakout Retest After Clearing Key ResistanceSilver TVC:SILVER has broken above the $34.50 resistance level, as it looks to catch up to the gold/silver ratio. We’re now watching for a retest of this breakout zone at $34.00–$34.50 for a potential long spot entry.
📌 Trade Setup:
• Entry Zone: $34.00 – $34.50
• Take Profit Targets:
o 🥇 $37.50 – $40.00
o 🥈 $44.00 – $48.00
• Stop Loss: Daily close below $33.00

SILVER: Will Go Down! Short!
My dear friends,
Today we will analyse SILVER together☺️
The market is at an inflection zone and price has now reached an area around 35.768 where previous reversals or breakouts have occurred.And a price reaction that we are seeing on multiple timeframes here could signal the next move down so we can enter on confirmation, and target the next key level of 35.645..Stop-loss is recommended beyond the inflection zone.
❤️Sending you lots of Love and Hugs❤️

Silver Looking For A Support Of wave 4 at 36.37Silver retested the lows of the week and even broke slightly below the spike from June 12, where the market previously found support at 35.46. We highlighted that as a key area for potential stabilization, especially since there were likely a lot of stops, just below it. So it's no surprise that the market turned around from there and is now trying to stabilize. I’m starting to think the a-b-c drop could already be finished in wave 4.
A daily close above 36.37 would confirm a continuation higher.
We can also see some RSI divergence between waves A and C, which further suggests that silver may be coming down into strong support.

XAGUSD 23.06.2025 ~+ Airstrikes in Iran -> Supposed Risk-off flows
*Wasn't really at the desk monitoring the developments on the news.
SILVER BEARSFUSIONMARKETS:XAGUSD team bearish are starting to show one or two strength, Hopefully the bears will hold their grounds. Sell Silver.

Silver Outperforms Gold, Eyes $36Silver climbed back toward $36, bouncing from over two-week lows on falling Treasury yields and a softer dollar. While the Israel-Iran ceasefire remains shaky, Fed Chair Powell said “many paths are possible,” hinting at a flexible rate stance depending on job market data.
Strong industrial demand and tight supply continue to support silver, which is up nearly 9% in June, far outpacing gold’s modest gains.
Resistance is seen at 37.50, while support holds at 35.40.

Silver bearish IdeaHi all! This is my first post and I'm pretty new to this. But I think the best way to learn is to just go for it. So this idea might be super stupid, but at least I'm trying :)
Happy trades!

Market next move 🔁 Disrupted Analysis (Bullish Scenario Instead of Bearish)
1. Support Holding Firm:
The analysis assumes the price will drop after failing resistance, but the current price action is showing higher lows, suggesting accumulation.
The support area has been tested multiple times, showing strength.
2. Volume Analysis Contradiction:
Recent green volume bars indicate buying interest at lower levels.
No significant volume spike on the last downward leg, suggesting lack of strong selling pressure.
3. Potential Inverted Head and Shoulders:
The current formation could be the right shoulder of an inverted head and shoulders pattern, a classic bullish reversal setup.
If confirmed, this could lead to a breakout above the resistance area, not a drop.
4. Trendline Breakout Watch:
There's a potential bullish breakout of the descending trendline.
A break above 3,320 USD could invalidate the bearish thesis and suggest a target near 3,340–3,350 USD.

SILVER: Strong Bullish Sentiment! Long!
My dear friends,
Today we will analyse SILVER together☺️
The recent price action suggests a shift in mid-term momentum. A break above the current local range around 35.758 will confirm the new direction upwards with the target being the next key level of 36.094 and a reconvened placement of a stop-loss beyond the range.
❤️Sending you lots of Love and Hugs❤️

Silver Steady at $36 as Rate Cut Bets RiseSilver steadied around $36.10 during the Asian session, paring earlier losses after the geopolitical jolt. While the ceasefire cooled nerves, markets remain alert after Iran’s limited strike on a US base. Fed commentary also weighed in: Bowman and Waller leaned dovish, though Powell’s tone remains cautious ahead of his testimony.
The first resistance is seen at 37.50, while the support starts at 35.40.