XAGUSD01 trade ideas
XAG/USD Climbs on FOMC WorriesSilver prices climbed above $31 per ounce on Thursday, extending gains for a second straight session as commodities rebounded following President Trump’s rollback of his reciprocal tariff policy. The new measure lowers tariffs on most trade partners to 10% for 90 days to support negotiations. However, China, a key silver consumer, still faces a steep 125% tariff, keeping geopolitical tensions elevated and sustaining safe-haven demand. Meanwhile, FOMC minutes revealed growing concerns about stagflation and the impact of Trump’s trade agenda on the Fed’s dual mandate of price stability and full employment.
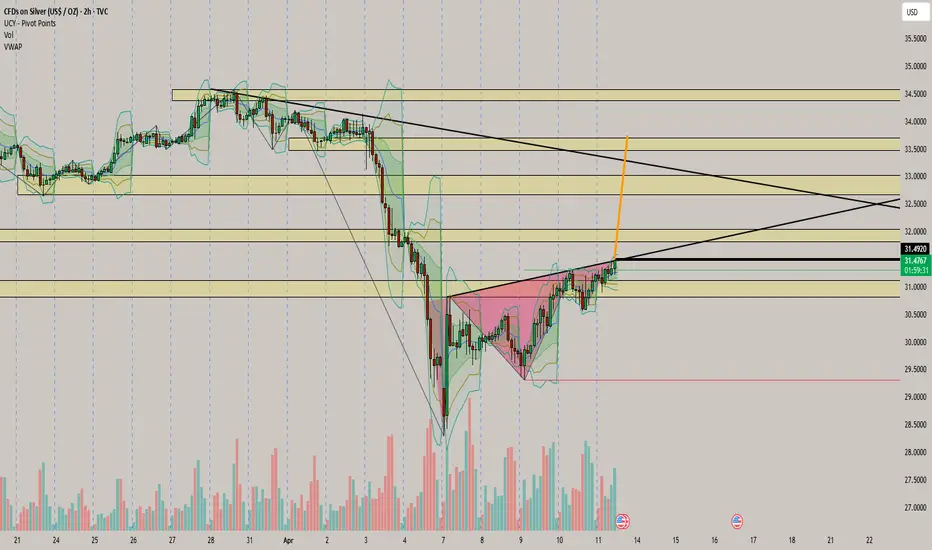
Resistance starts at 31.50; if breached, the next levels are 32.15 and 33.30. Support sits at 30.20, with 29.50 and 29.20 below if that level gives way.

Silver at a Crossroads: More Pain or a Rally Above 34?Silver is undergoing a potential trend change. The previous yellow uptrend channel has been broken, and a new, nearly flat-slightly downward channel (marked by blue lines) appears to be forming. While it may be too early to confirm this as an established trend, the structure is developing with increasing clarity.
Silver is now at a crossroads. The former trendline is being retested, and just above it lies a confluence of resistance: a previous demand zone and the 200-day moving average. These former support levels have now merged into a strong resistance area.
Unless this resistance zone is broken, downward pressure is likely to persist. However, a breakout could open the door for a medium-term move toward the 34 level.
Please check gold/silver chart for longer term understanding:

XAGUSD: Silver, and the latest on tariffs!Silver is trading in its ascending channel on the 4-hour timeframe, between the EMA200 and EMA50. If silver reaches the supply zone, it can be sold. A downward correction will also provide us with a buying opportunity with a good risk-reward ratio.
U.S. President Donald Trump has implemented tariff policies with the aim of revitalizing domestic manufacturing. During the 1980s, a significant portion of American manufacturing jobs either moved overseas or were replaced by automation technologies.
The shift in production was largely driven by wage disparities across countries. Nevertheless, the United States remains a leading global manufacturer, although it now focuses on producing higher-value goods. Experts argue that imposing import taxes is unlikely to achieve one of its stated goals: restoring manufacturing as a central pillar of the U.S. economy.
According to many economists, Trump’s campaign to impose tariffs on a wide range of goods from trade partners is unlikely to bring back the manufacturing jobs that once formed the backbone of the blue-collar middle class.
In the mid-20th century, the U.S. was the manufacturing capital of the world, employing more workers in this sector than any other. At its peak in the 1950s, one-fourth of the civilian workforce was engaged in manufacturing.
However, starting in the 1980s, free trade agreements facilitated the relocation of many industries abroad, while automation reduced the need for human labor in the remaining factories. Today, only about 7% of the workforce is employed in manufacturing—a figure that has remained largely unchanged since the Great Recession.
The goal of tariffs is to incentivize businesses to relocate their factories to the U.S. to avoid paying import taxes—costs that are typically passed on to consumers.
While some economists believe this approach could work for select industries, it is unlikely to recreate an era in which most household items carried the “Made in America” label.
According to a report by The Wall Street Journal, while it’s unlikely that the Chinese President will initiate a call himself, the odds of Xi Jinping responding to a call from Trump are reportedly high.
This comes amid heightened tensions between the two nations due to new tariffs and escalating trade disputes, where both sides appear to be locked in a power struggle—neither willing to be the first to back down.
Although this news may seem minor on the surface, it carries a deeper signal for the markets: despite ongoing tensions, the possibility for communication and negotiation remains. This prospect, especially in a highly volatile environment, could be seen as a positive sign by investors.
Earlier in the week, Trump had stated he was waiting for a call from Xi. Now, the Wall Street Journal suggests that if Trump initiates the conversation, a response from China is likely. While this may be an unofficial message from within the Chinese leadership, it still indicates that the door to dialogue and de-escalation is not entirely closed.

SilverXAGUSD
- Rising Wedge as an corrective pattern in short time frame
- Break of Structure
- Demand Zone
- Fibonacci Level - 50.00% / 61.80%
- Completed " 1234 " Impulsive Waves

A Fibonacci 50% Retracement on Silver.A Fibonacci 50% Retracement on Silver, provides another shot at goal for those looking for lower
values!

Potential bullish rise?XAG/USD has bounce off the support level which is a pullback support that aligns with the 38.2% and the 23.6% Fibonacci retracement and could rise from this level to our take profit.
Entry: 30.52
Why we like it:
There is a pullback support level that lines up with the 38.2% and the 23.6% Fibonacci retracement.
Stop loss: 29.57
Why we like it:
There is a pullback support level which lines up with the 61.8% Fibonacci retracement.
Take profit: 31.93
Why we like it:
There is a pullback resistance level which aligns with the 61.8% Fibonacci retracement.
Enjoying your TradingView experience? Review us!
Please be advised that the information presented on TradingView is provided to Vantage (‘Vantage Global Limited’, ‘we’) by a third-party provider (‘Everest Fortune Group’). Please be reminded that you are solely responsible for the trading decisions on your account. There is a very high degree of risk involved in trading. Any information and/or content is intended entirely for research, educational and informational purposes only and does not constitute investment or consultation advice or investment strategy. The information is not tailored to the investment needs of any specific person and therefore does not involve a consideration of any of the investment objectives, financial situation or needs of any viewer that may receive it. Kindly also note that past performance is not a reliable indicator of future results. Actual results may differ materially from those anticipated in forward-looking or past performance statements. We assume no liability as to the accuracy or completeness of any of the information and/or content provided herein and the Company cannot be held responsible for any omission, mistake nor for any loss or damage including without limitation to any loss of profit which may arise from reliance on any information supplied by Everest Fortune Group.

Silver bullish direction
expectation for strong bullish move on silver based on daily charts despite bullish sentiments on 2 H and 4 H and strong support and considering gold move upwards.

SILVER: Local Bullish Bias! Long!
My dear friends,
Today we will analyse SILVER together☺️
The market is at an inflection zone and price has now reached an area around 30.949 where previous reversals or breakouts have occurred.And a price reaction that we are seeing on multiple timeframes here could signal the next move up so we can enter on confirmation, and target the next key level of 31.206.Stop-loss is recommended beyond the inflection zone.
❤️Sending you lots of Love and Hugs❤️

Silver Potential Bearish MoveHi Traders.
We saw a clear breakout from the structure and right now we are forming
a continuation correction with a smaller HnS in the
making.

XAG getting ready for another run down.I believe XAG has finished the blue ((c)) of green (iv) with an ending diagonal, and now doing the first 1-2 of the green (v) wave of gray ((c)).
The price might do a very small retrace to 31.12 before starting a 3rd wave down.
I believe the green (v) is going to the green box area at 28.15 - 27.40 area.
But I actually have a weekly trendline lower down, which the price might want to go won and test, which also fits with the idea that the (v) wave could go all the way to the 100% Fiblevel of (i)+(iii) level.
This would mean the price would probably test the 25.0 level.

Silver Remains Volatile Amid Trade War and Recession FearsSilver stayed above $30.50 per ounce on strong safe-haven demand amid U.S.-China trade tensions. Prices held a 3.5% gain after President Trump announced a 90-day tariff pause and a 10% rate for all but China, which now faces a 125% tariff. China raised tariffs on U.S. goods to 84%, and the EU approved duties on €21 billion of American exports. Fed minutes showed concerns about stagflation and the impact of Trump’s trade policies. Markets now await March U.S. inflation data on Thursday for clues on the Fed’s next move.
Technically, the first resistance level is located at 31.50. In case of its breach 32.15 and 33.30 could be monitored respectively. On the downside, the first support is at 30.20. 29.50 and 29.20 would become the next support levels if this level is passed.

SILVER (#XAGUSD): Bullish Reversal Confirmed?!📈SILVER turned bullish after the yesterday's FOMC Minutes.
After testing a key daily support level, the market is showing a clear intraday reversal.
The formation of an ascending triangle pattern with a broken neckline confirms this bullish reversal.
I expect the market to continue its upward trajectory, potentially reaching the 31.82 level in the near future.

Silver H4 | Pullback resistance at 61.8% Fibonacci retracementSilver (XAG/USD) is rising towards a pullback resistance and could potentially reverse off this level to drop lower.
Sell entry is at 31.98 which is a pullback resistance that aligns with the 61.8% Fibonacci retracement.
Stop loss is at 33.30 which is a level that sits above the 78.6% Fibonacci retracement and a pullback resistance.
Take profit is at 30.49 which is a pullback support.
High Risk Investment Warning
Trading Forex/CFDs on margin carries a high level of risk and may not be suitable for all investors. Leverage can work against you.
Stratos Markets Limited (tradu.com):
CFDs are complex instruments and come with a high risk of losing money rapidly due to leverage. 63% of retail investor accounts lose money when trading CFDs with this provider. You should consider whether you understand how CFDs work and whether you can afford to take the high risk of losing your money.
Stratos Europe Ltd (tradu.com):
CFDs are complex instruments and come with a high risk of losing money rapidly due to leverage. 63% of retail investor accounts lose money when trading CFDs with this provider. You should consider whether you understand how CFDs work and whether you can afford to take the high risk of losing your money.
Stratos Global LLC (tradu.com):
Losses can exceed deposits.
Please be advised that the information presented on TradingView is provided to Tradu (‘Company’, ‘we’) by a third-party provider (‘TFA Global Pte Ltd’). Please be reminded that you are solely responsible for the trading decisions on your account. There is a very high degree of risk involved in trading. Any information and/or content is intended entirely for research, educational and informational purposes only and does not constitute investment or consultation advice or investment strategy. The information is not tailored to the investment needs of any specific person and therefore does not involve a consideration of any of the investment objectives, financial situation or needs of any viewer that may receive it. Kindly also note that past performance is not a reliable indicator of future results. Actual results may differ materially from those anticipated in forward-looking or past performance statements. We assume no liability as to the accuracy or completeness of any of the information and/or content provided herein and the Company cannot be held responsible for any omission, mistake nor for any loss or damage including without limitation to any loss of profit which may arise from reliance on any information supplied by TFA Global Pte Ltd.
The speaker(s) is neither an employee, agent nor representative of Tradu and is therefore acting independently. The opinions given are their own, constitute general market commentary, and do not constitute the opinion or advice of Tradu or any form of personal or investment advice. Tradu neither endorses nor guarantees offerings of third-party speakers, nor is Tradu responsible for the content, veracity or opinions of third-party speakers, presenters or participants.

Sell Idea!Hello all. market will react on the very important Node and collapse. the New Low will be made.

Silver (XAGUSD) might have launched into the next leg higherSilver (XAGUSD) has hit a key turning point after dropping from its October 23, 2024 peak. This decline unfolded in three distinct swings, following a zigzag pattern known as an Elliott Wave structure. Starting from that high, the first drop (wave A) landed at 29.68, followed by a bounce (wave B) to 34.58. Then, the final slide (wave C) bottomed out at 28.328, as seen on the hourly chart. This marked the end of a larger correction phase, called wave (4). Silver found its footing in a critical support zone between 24.86 and 28.56—a range calculated using Fibonacci tools, stretching 100% to 161.8% of the drop from the October high.
Now, silver is climbing again in what’s labeled wave (5). To confirm this upward trend, it needs to break past the prior peak of 34.86 from wave (3); otherwise, it might face another dip. Since bottoming out on April 7, 2025, at 28.328, silver rose to 30.81 (wave (i)), then eased back to 29.31 (wave (ii)). For now, as long as the 28.32 level holds firm, silver seems set to keep rising in the short term, offering hope for bullish traders.

SILVER Risky Short! Sell!
Hello,Traders!
SILVER is surging up again
But is about to enter a wide
Supply area around 31.40$
From where a local bearish
Correction is likely to take place
Sell!
Comment and subscribe to help us grow!
Check out other forecasts below too!
Disclosure: I am part of Trade Nation's Influencer program and receive a monthly fee for using their TradingView charts in my analysis.

XAGUSD - SilverExpecting a bullish breakout from the local low of Silver.
Orange lines being the decision confirmation prices.
There are 2 fake structure zones, which I believe will act as local demand zones.

Get Ready for the Silver Surge!🚀 Get Ready for the Silver Surge! 🚀
Hey there, silver enthusiasts! 🌟
We're diving into an exciting trend that’s shaping up right at the golden crab level—yes, we’re talking about that sweet spot of **$28.5!**
This is your chance to capitalize on the impending rise in silver prices! With all indicators pointing upwards, now's the perfect time to consider adding some silver to your portfolio.

SILVER: The Market Is Looking Down! Short!
My dear friends,
Today we will analyse SILVER together☺️
The in-trend continuation seems likely as the current long-term trend appears to be strong, and price is holding below a key level of 30.436 So a bearish continuation seems plausible, targeting the next low. We should enter on confirmation, and place a stop-loss beyond the recent swing level.
❤️Sending you lots of Love and Hugs❤️

XAG/USD For Bullishyou can go long now
or
wait for pull-back near entry point and then go long
general trend is up trend
have fun :)

Yields and Trade Wars Induce Silver InstabilitySilver dropped below $30 per ounce, hitting $29.57 on April 4, its lowest since mid-January, as rising U.S. Treasury yields made non-yielding assets less attractive. The U.S. announced a 104% tariff on Chinese imports starting at midnight, intensifying trade war concerns. Although over 70 countries have reportedly requested tariff relief, market sentiment remains cautious. The EU’s retaliatory tariff plans further fueled risk aversion, pressuring industrial metals. Still, expectations of Fed rate cuts and safe-haven demand offer some support.
Technically, the first resistance level is located at 30.90. In case of its breach, 31.40 and 32.50 could be monitored respectively. On the downside, first support is at 29.00. 28.40 and 27.50 would become the next support levels if this level is passed.

XAGUSD Trade Plan: 1D Support, Liquidity Grab, & Bullish Setup!Silver (XAGUSD) is currently exhibiting signs of being overextended, as evidenced by its recent price action on the daily and 4-hour timeframes. The metal has traded into a critical support zone, marked by previous lows on the daily chart. This zone represents a significant area of interest, as it has historically acted as a key level for buyers to step in. However, the current price action has dipped below these lows, eating into sell-side liquidity in the form of stop-loss orders placed beneath this level. This liquidity grab is a classic move often seen in markets before a potential reversal.
On the 15-minute timeframe, the price is consolidating within a range, suggesting a possible accumulation. A break above this range, accompanied by a bullish market structure shift, could signal the beginning of a reversal and provide a compelling buy opportunity. This aligns with the idea of a "spring" in Wyckoff theory, where price manipulates liquidity before reversing direction.
Traders should remain patient and wait for confirmation of a bullish breakout on the lower timeframe before entering long positions. Key factors to monitor include strong bullish momentum, a clear break of the range, and the formation of higher highs and higher lows. Until these conditions are met, caution is advised, as the current downtrend could persist. 📉➡️📈
Key Levels to Watch:
Support Zone: Previous daily lows (now acting as a liquidity zone).
Resistance Zone: The upper boundary of the current 15-minute range.
Trading Plan:
Wait for a break of the 15-minute range to the upside. 🚀
Look for a bullish market structure shift (higher highs and higher lows). 📊
Enter long positions with a tight stop-loss below the range low. 🛡️
Target key resistance levels on the 4-hour and daily timeframes for potential take-profit zones. 🎯
This analysis highlights the importance of patience and discipline in trading. While the current setup is promising, confirmation is key to avoid premature entries. As always, this is not financial advice, and traders should conduct their own due diligence before making any decisions. ⚠️
