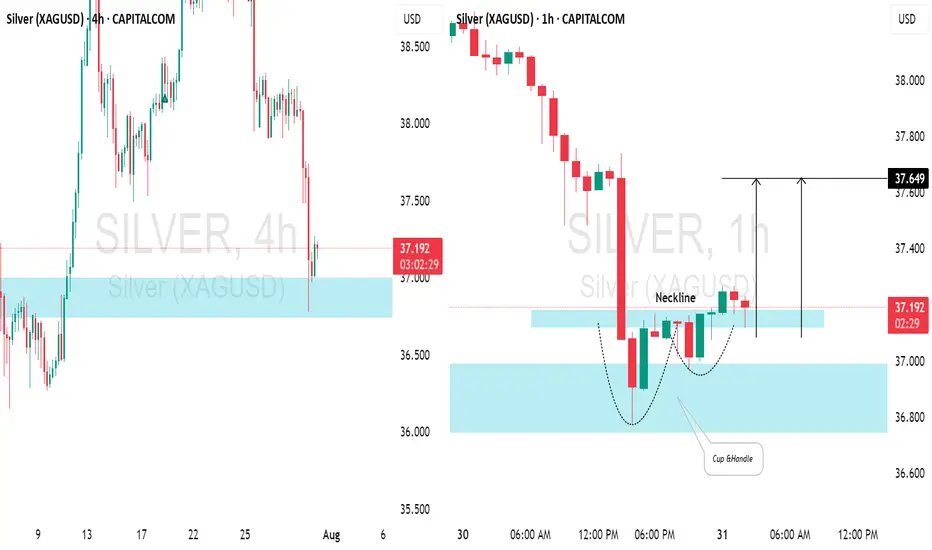
SILVER (XAGUSD): Time for Pullback📈SILVER appears to be oversold following yesterday's decline.
After testing a significant daily / intraday support level, there's a noticeable bullish reversal.
The price formed a cup & handle pattern on the hourly chart and has broken above its neckline. We can expect a pullback to at least 37.
#XAGUSD: A Strong Bullish Move, Possible Target at $45?Silver is currently experiencing a correction, but the overall price remains bullish. Analysing the data, we can see a potential price reversal in our area of interest. Following the recent higher high, price is poised to create another record high. We should closely monitor volume and price behavio

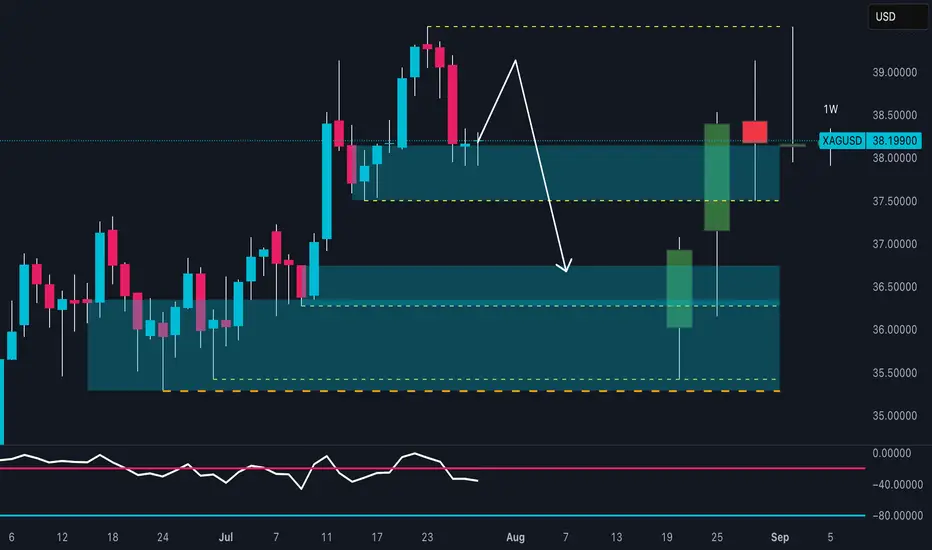
SILVER Is About to Collapse? Watch This Critical Supply Zone!Price recently tapped a high near 39.20 before sharply rejecting from the 38.80–39.20 supply zone, confirming strong selling pressure. The current structure shows:
- Supply zone tested and rejected
- Likely return to the previous demand zone (36.50–36.00)
- RSI is turning down, confirming loss of m
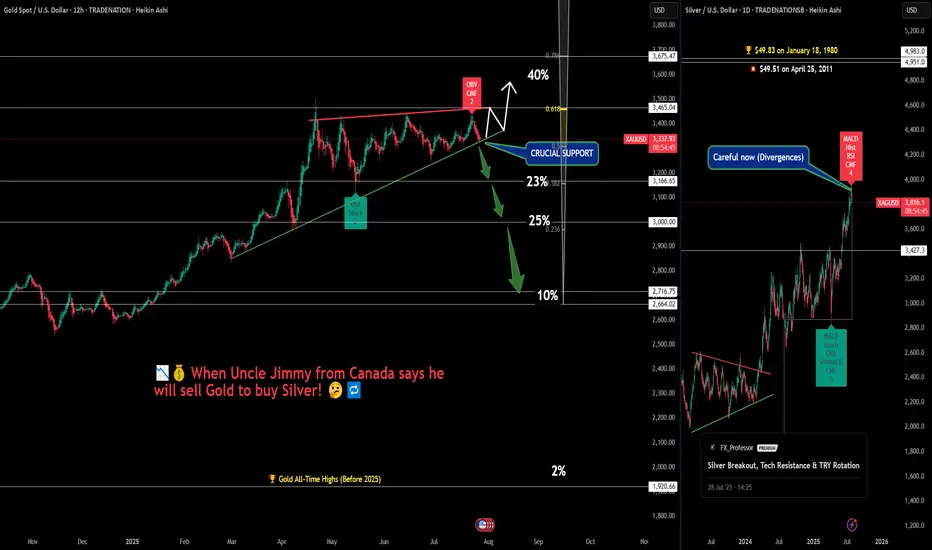
When Gold Believers Flip – Uncle Jimmy, Silver & New Safe Havens💰📉 When Gold Believers Flip – Uncle Jimmy, Silver, and the New Safe Havens 🧠🔄
Let me tell you a story that says more than any chart ever could.
📜 Meet Uncle Jimmy (from Canada) . He’s not really my uncle, but out of respect, that’s what I call him.
A true OG — early stockbroker, big mustache ,
XAGUSD – Reversal Signs After the Run Toward $40Lately, I’ve been a strong advocate for a Silver rally toward $40, and indeed, we got a solid move, with price reaching as high as $39.50, not touching 40 though...
Just like with Gold, the last 3 days of last week turned bearish, and now it looks like we may be entering the early stage of a correc
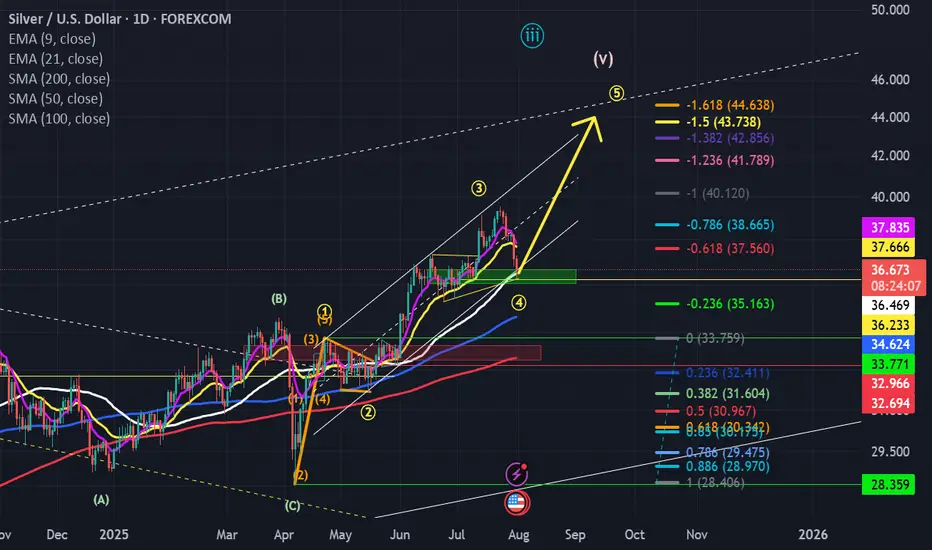
One more move up and then we should sell for now....This pb has allowed the shorts to cash in...we are at signficant support (middle of prior funnel) and the bottom of the channel...in my opinion, we resume the move up...but I think $42-$44 zone is the likely pivot pt for a significan move back down...back to mid to low $30's...This current pb is wil
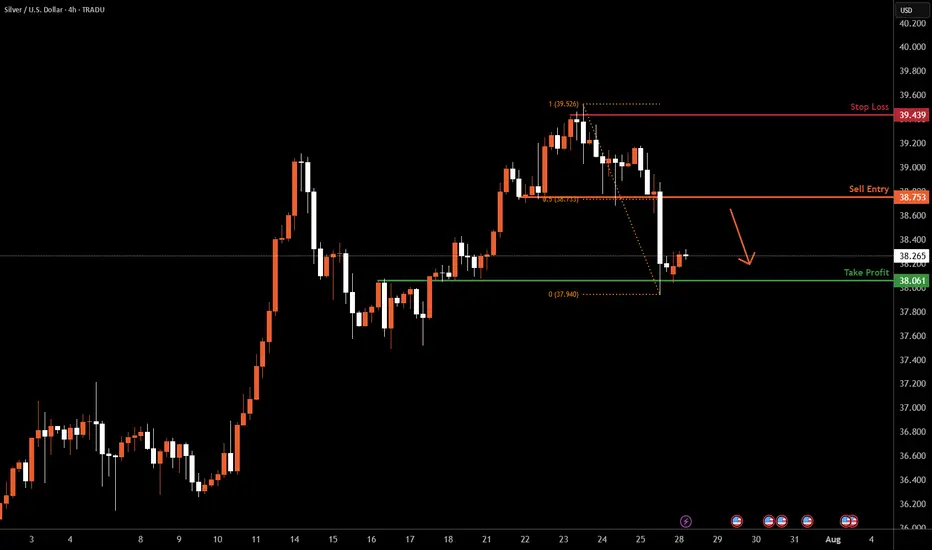
XAGUSD H4 I Bearish Reversal Based on the H4 chart analysis, we can see that the price is rising toward our sell entry at 38.75, which is a pullback resistance aligning with a 50% Fibo retracement.
Our take profit will be at 38.06, an overlap support level.
The stop loss will be placed at 39.43, a swing-high resistance level
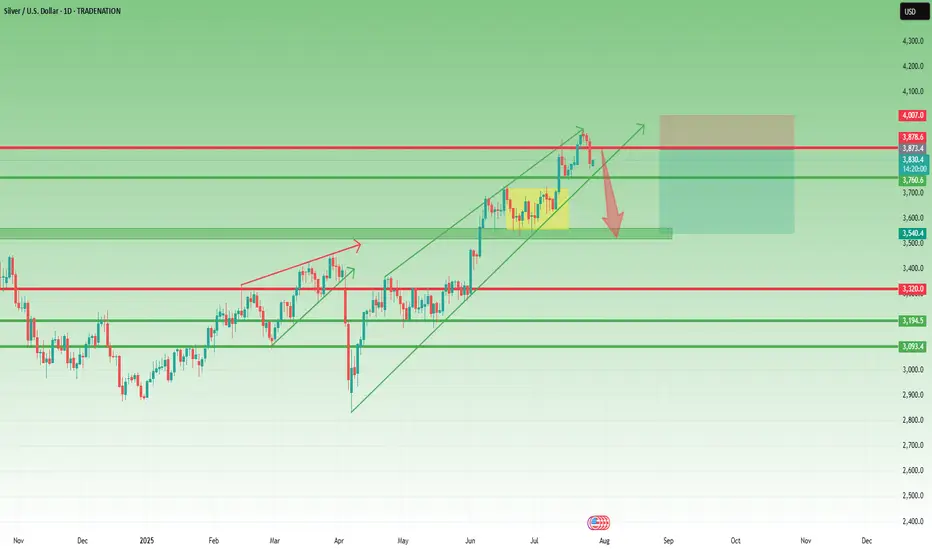
SILVER Analysis - Can buyers push toward 4,100$?TRADENATION:XAGUSD is trading within a clear ascending channel, with price action consistently respecting both the upper and lower boundaries. The recent bullish momentum indicates that buyers are in control, suggesting there's chances for potential continuation on the upside.
The price has recen

SILVER: Will Go Down! Short!
My dear friends,
Today we will analyse SILVER together☺️
The market is at an inflection zone and price has now reached an area around 36.490 where previous reversals or breakouts have occurred.And a price reaction that we are seeing on multiple timeframes here could signal the next move down s
SILVER Bullish SetupSilver has been in a clear Bullish Trend Recently, and we are looking Silver to continue bullish.

See all ideas
Displays a symbol's price movements over previous years to identify recurring trends.