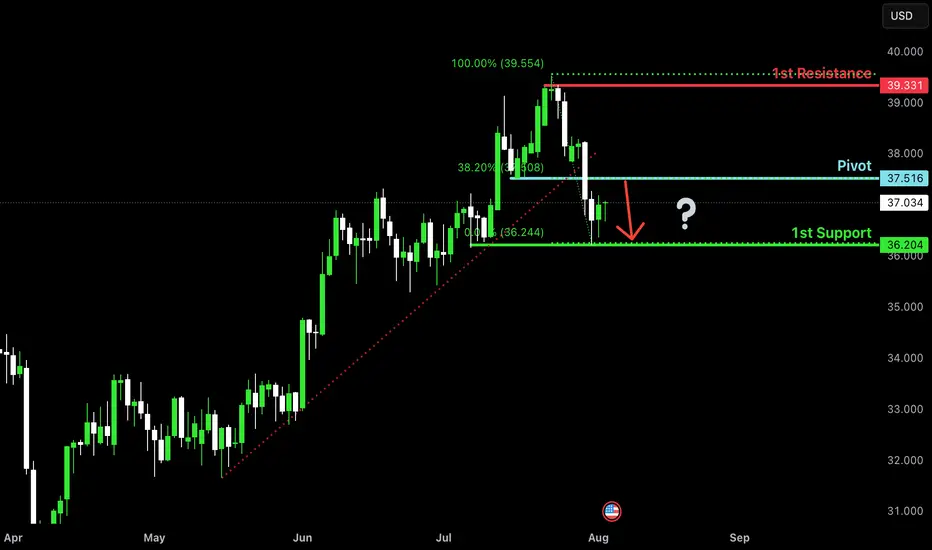
Bearish reversal for the Silver?The price is rising towards the pivot and could reverse to the pullback support.
Pivot: 37.51
1st Support: 36.20
1st Resistance: 39.33
Risk Warning:
Trading Forex and CFDs carries a high level of risk to your capital and you should only trade with money you can afford to lose. Trading Forex and CFDs may not be suitable for all investors, so please ensure that you fully understand the risks involved and seek independent advice if necessary.
Disclaimer:
The above opinions given constitute general market commentary, and do not constitute the opinion or advice of IC Markets or any form of personal or investment advice.
Any opinions, news, research, analyses, prices, other information, or links to third-party sites contained on this website are provided on an "as-is" basis, are intended only to be informative, is not an advice nor a recommendation, nor research, or a record of our trading prices, or an offer of, or solicitation for a transaction in any financial instrument and thus should not be treated as such. The information provided does not involve any specific investment objectives, financial situation and needs of any specific person who may receive it. Please be aware, that past performance is not a reliable indicator of future performance and/or results. Past Performance or Forward-looking scenarios based upon the reasonable beliefs of the third-party provider are not a guarantee of future performance. Actual results may differ materially from those anticipated in forward-looking or past performance statements. IC Markets makes no representation or warranty and assumes no liability as to the accuracy or completeness of the information provided, nor any loss arising from any investment based on a recommendation, forecast or any information supplied by any third-party.
XAGUSDG trade ideas
SILVER My Opinion! SELL!
My dear friends,
Please, find my technical outlook for SILVER below:
The price is coiling around a solid key level - 37.026
Bias - Bearish
Technical Indicators: Pivot Points Low anticipates a potential price reversal.
Super trend shows a clear sell, giving a perfect indicators' convergence.
Goal - 36.725
Safe Stop Loss - 37.189
About Used Indicators:
The pivot point itself is simply the average of the high, low and closing prices from the previous trading day.
Disclosure: I am part of Trade Nation's Influencer program and receive a monthly fee for using their TradingView charts in my analysis.
———————————
WISH YOU ALL LUCK
Silver seems Bearish here...Lookinf at the fact that the asending flag has been broken... I think is BEarish...

XAG/USD Long Setup | H1 TimeframeA classic setup based on #SmartMoneyConcepts:
✅ Change of Character (CHOCH) after a liquidity sweep.
✅ Price returned to the Order Block & filled the FVG.
✅ Entry at the Point of Interest (POI) with a high R/R.
Waiting for it to reach the buy-side liquidity targets. Do you agree?

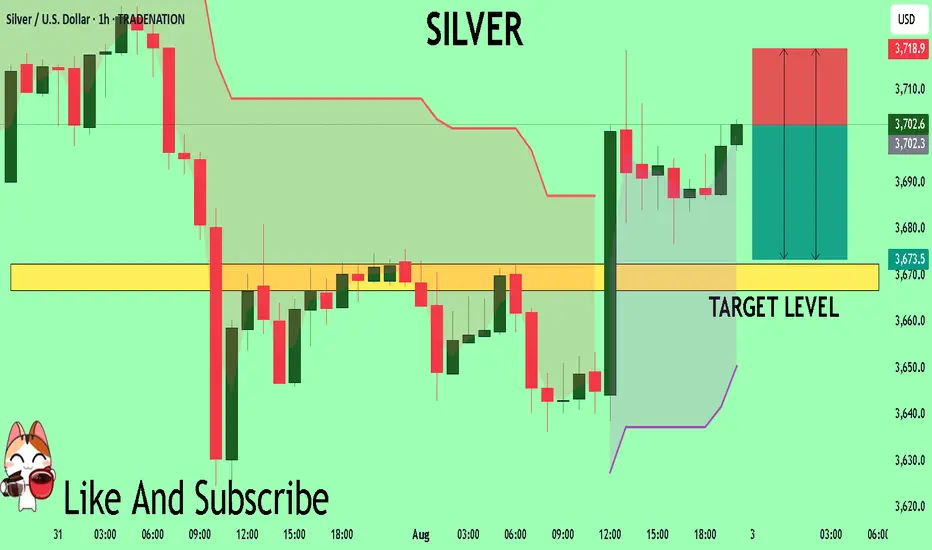
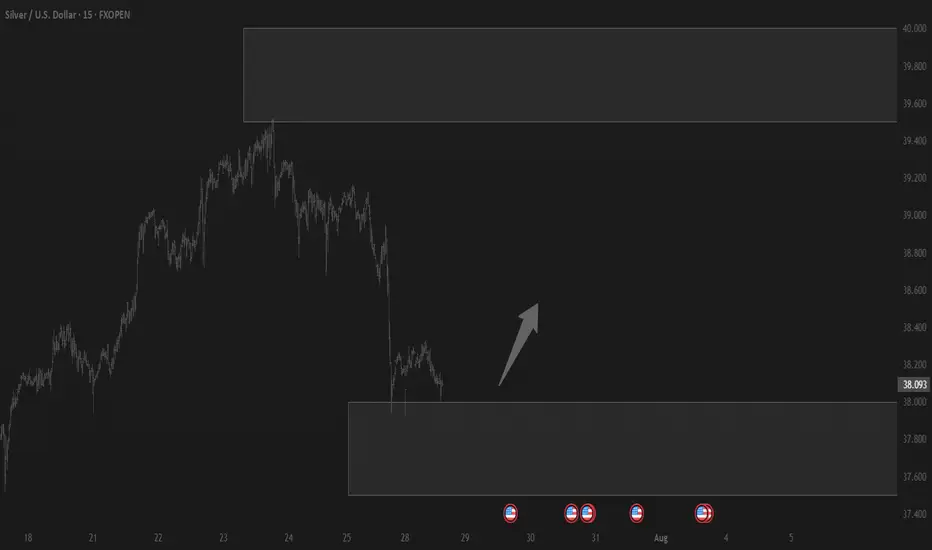
SILVER Going Upas you have might or might not seen i have posted this Buying opportunity of Silver few days ago, and now the market have creatd a new demand + Flip zone where we are looking for a new opportunity.

Silver The Week AheadKey Support and Resistance Levels
Resistance Level 1: 3756
Resistance Level 2: 3855
Resistance Level 3: 3915
Support Level 1: 3600
Support Level 2: 3544
Support Level 3: 3480
This communication is for informational purposes only and should not be viewed as any form of recommendation as to a particular course of action or as investment advice. It is not intended as an offer or solicitation for the purchase or sale of any financial instrument or as an official confirmation of any transaction. Opinions, estimates and assumptions expressed herein are made as of the date of this communication and are subject to change without notice. This communication has been prepared based upon information, including market prices, data and other information, believed to be reliable; however, Trade Nation does not warrant its completeness or accuracy. All market prices and market data contained in or attached to this communication are indicative and subject to change without notice.

XAG USD LONG RESULT Silver price consolidated in the symmetrical triangle and on the major Support Trendline until it broke down and dumped hitting our sl.

Trading balanceTrading balance The price of the asset has rebounded from the balance zone. With the prospect of growth into the resistance zone.
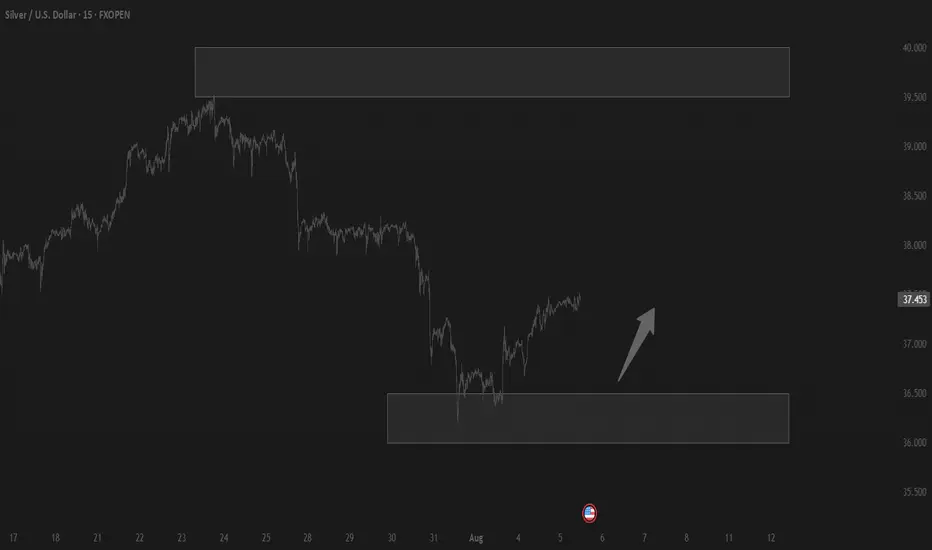
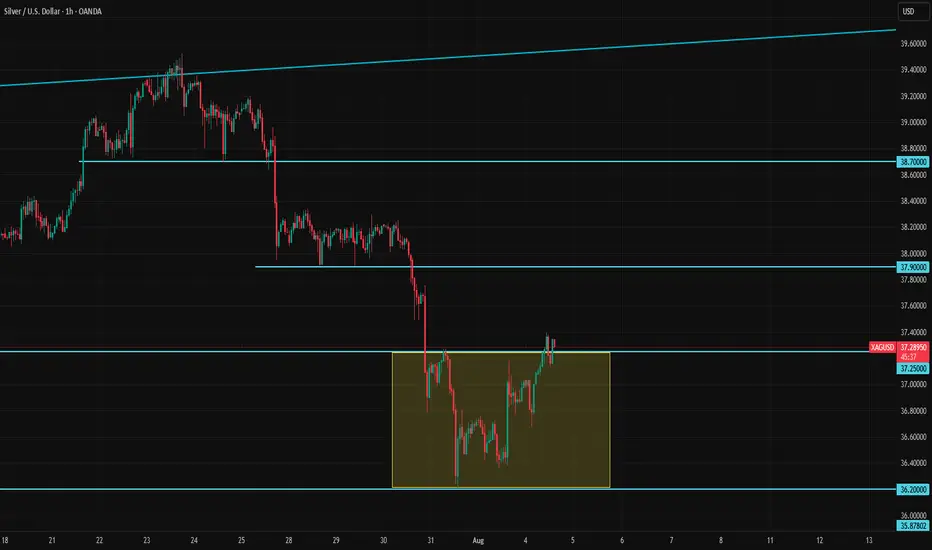
Silver Tries to Regain Lost Ground After the DipSilver has formed a solid bottom between 37.25 and 36.20 and is now attempting to break higher and recover some of its recent losses. There is some support from gold helping to push the price upward, but it remains unclear whether silver can hold above the 37.25 level long enough to take another step higher.
If it does, the price may return to the 37.90–38.30 zone, where it could stabilize and decide whether to move further up.
Below 37, however, the outlook becomes more cautious. A drop below this level could trigger additional selling pressure, so traders should be alert to downside risks if that support fails.
Silver against many world M2 supplies.Here we see silver divided by many global m2 supplies...
We can see silver is JUST STARTING ITS MOVE to catch up to gold.
We corrected for the 1.4 quadrillion in M2, and see silver's targets all over $100!
This confirms silver is ready to move again, after gold's run, and perhaps make an explosive move higher!

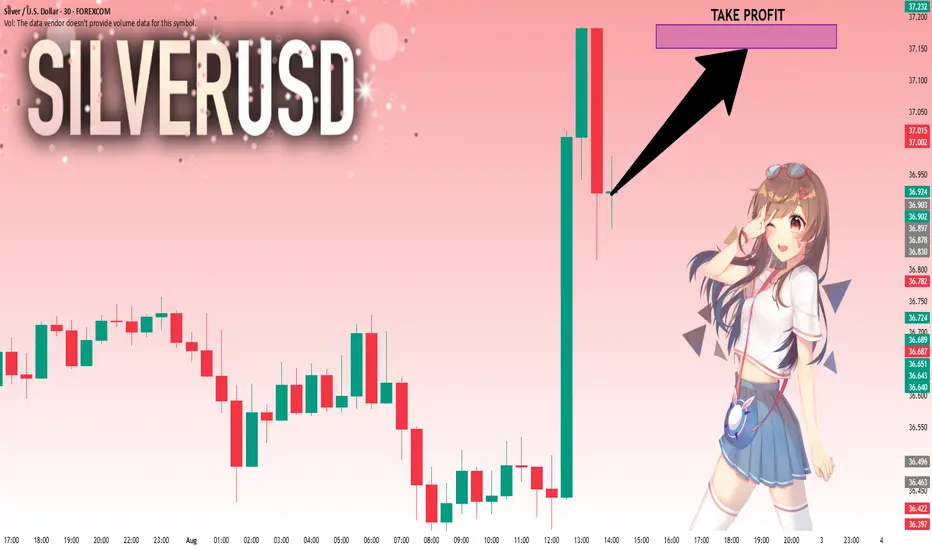
SILVER: Local Bullish Bias! Long!
My dear friends,
Today we will analyse SILVER together☺️
The recent price action suggests a shift in mid-term momentum. A break above the current local range around 36.920 will confirm the new direction upwards with the target being the next key level of 37.150 and a reconvened placement of a stop-loss beyond the range.
❤️Sending you lots of Love and Hugs❤️
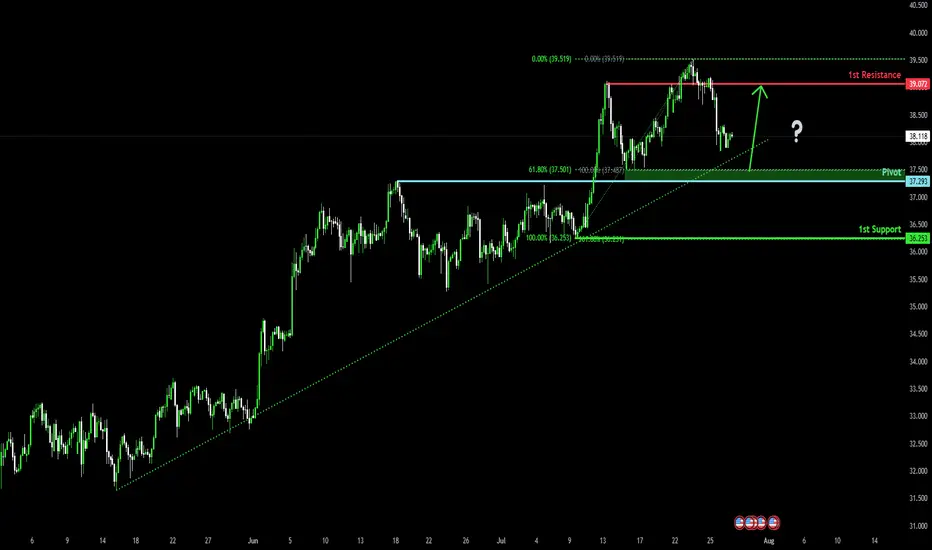
Falling towards pullback support?The Silver (XAG/USD) is falling towards the pivot, which is a pullback support and could rise to the 1st resistance.
Pivot: 37.29
1st Support: 36.25
1st Resistance: 39.07
Risk Warning:
Trading Forex and CFDs carries a high level of risk to your capital and you should only trade with money you can afford to lose. Trading Forex and CFDs may not be suitable for all investors, so please ensure that you fully understand the risks involved and seek independent advice if necessary.
Disclaimer:
The above opinions given constitute general market commentary, and do not constitute the opinion or advice of IC Markets or any form of personal or investment advice.
Any opinions, news, research, analyses, prices, other information, or links to third-party sites contained on this website are provided on an "as-is" basis, are intended only to be informative, is not an advice nor a recommendation, nor research, or a record of our trading prices, or an offer of, or solicitation for a transaction in any financial instrument and thus should not be treated as such. The information provided does not involve any specific investment objectives, financial situation and needs of any specific person who may receive it. Please be aware, that past performance is not a reliable indicator of future performance and/or results. Past Performance or Forward-looking scenarios based upon the reasonable beliefs of the third-party provider are not a guarantee of future performance. Actual results may differ materially from those anticipated in forward-looking or past performance statements. IC Markets makes no representation or warranty and assumes no liability as to the accuracy or completeness of the information provided, nor any loss arising from any investment based on a recommendation, forecast or any information supplied by any third-party.
Do you agree with me for XAGUSD?
Hi my friends
Do you think silver is still bullish?
I think it is bullish for now. Shall we go buy together?

Silver Reload: Short-Term Pop or Just Noise?Our last Silver idea played out perfectly
Price wicked into support near 37.93 and bounced.
Short-term bias shifts bullish if we can reclaim 38.30, with next upside target around 38.51.
Still below the 200 MA, so we treat this as a corrective move, not a full trend shift (yet).

Trading balanceTrading balance The price of the asset has rebounded from the balance zone. With the prospect of growth into the resistance zone.
XAGUSD SILVER ON 3OTH we are expecting a strong fundamental data .
ADP Non-Farm Employment Change forecast 82K previous -33K
Advance GDP q/q forecast 2.4% previous -0.5% Advance GDP Price Index q/q forecast 2.3% previous 3.8%
Pending Home Sales m/m0.3% 1.8%
7:00pm
USD
Federal Funds Rate
4.50% 4.50%
USD
FOMC Statement
7:30pm
USD
FOMC Press Conference.
we will be watching the data outlook for clear directional bias.

SILVER XAGUSD ON 3OTH we are expecting a strong fundamental data .
ADP Non-Farm Employment Change forecast 82K previous -33K
Advance GDP q/q forecast 2.4% previous -0.5% Advance GDP Price Index q/q forecast 2.3% previous 3.8%
Pending Home Sales m/m0.3% 1.8%
7:00pm
USD
Federal Funds Rate
4.50% 4.50%
USD
FOMC Statement
7:30pm
USD
FOMC Press Conference.
we will be watching the data outlook for clear directional bias.

SILVER Analysis - Can buyers push toward 4,100$?TRADENATION:XAGUSD is trading within a clear ascending channel, with price action consistently respecting both the upper and lower boundaries. The recent bullish momentum indicates that buyers are in control, suggesting there's chances for potential continuation on the upside.
The price has recently broken above a key resistance zone and now came back for a retest. If this level holds as support, it would reinforce the bullish structure and increase the likelihood of a move toward the 4,100 target, which aligns with the channel’s upper boundary.
As long as the price remains above this support zone, the bullish outlook stays intact. However, a failure to hold above this level could invalidate the bullish scenario and increase the likelihood of a deeper pullback.
Remember, always confirm your setups and use proper risk management.
Disclosure: I am part of Trade Nation's Influencer program and receive a monthly fee for using their TradingView charts in my analysis.

#SILVER - $3 Swing? 42 or 34.87?Date: 28-07-2205
#silver
Current Price: 38.15
Pivot Point: 38.440 Support: 37.740 Resistance: 39.145
Upside Targets:
Target 1: 39.812
Target 2: 40.480
Target 3: 41.245
Target 4: 42.010
Downside Targets:
Target 1: 37.070
Target 2: 36.400
Target 3: 35.635
Target 4: 34.870
#TradingView #Stocks #Equities #StockMarket #Investing #Trading #silver
#TechnicalAnalysis #StockCharts #Finance
#Gold #Bitcoin #Silver #TradingView #PivotPoints #SupportResistance

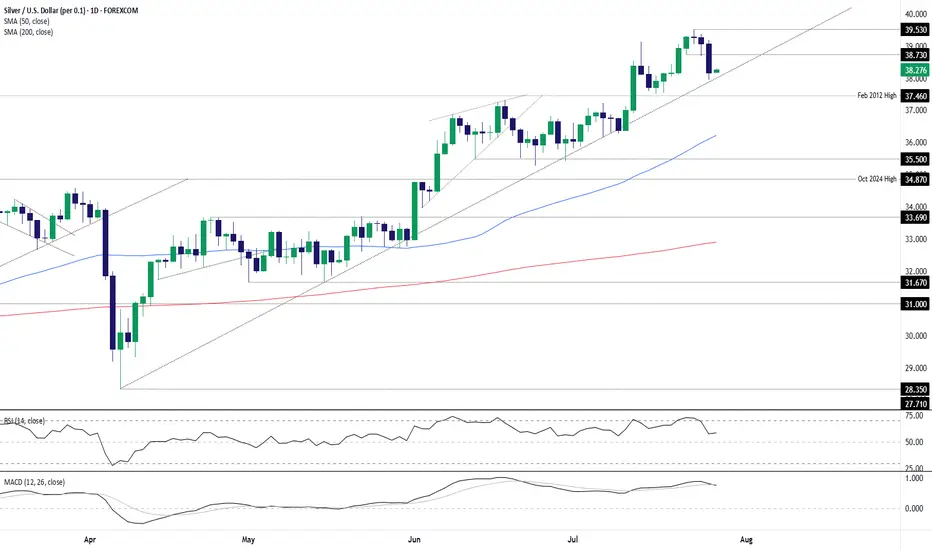
Silver dips to trendline, bulls eye bounceSilver’s latest pullback has seen it move back towards long-running uptrend support, creating a decent entry level for longs with price momentum favouring buying dips over selling rips.
Longs could be established above the trendline with a stop beneath for protection, targeting minor resistance at $38.73 initially and, if broken, the July 23 swing high of $39.53. If the latter were to be achieved, price and momentum signals at the time should dictate whether to hold for a potential test of the psychologically important $40 level.
The price has already bounced off the uptrend on numerous occasions since being established, enhancing the appeal of the setup. While RSI (14) and MACD are not screaming buy when it comes to market momentum, they’re tilted bullish rather than bearish, favouring upside.
If silver were to break and close beneath the uptrend, the bullish bias would be invalidated.
Good luck!
DS
XAGUSD--SHORT--strong rejection from upper side of green channel
--for second wave of downward movement, expecting first pullback upward to 38.42 level
--entry point is cross-section of,orange channel, black channel!s upper side.
--movement will be down to lower side of green channel.

SILVER H9 IdeaWhen you look at silver market has actually been in an uptrend for about three years. It was sideways a couple of times, and it’s very possible that we go sideways or correctionn for the short term. But over the longer term, it goes from the lower left to the upper right, and there’s really no way to dispute that.

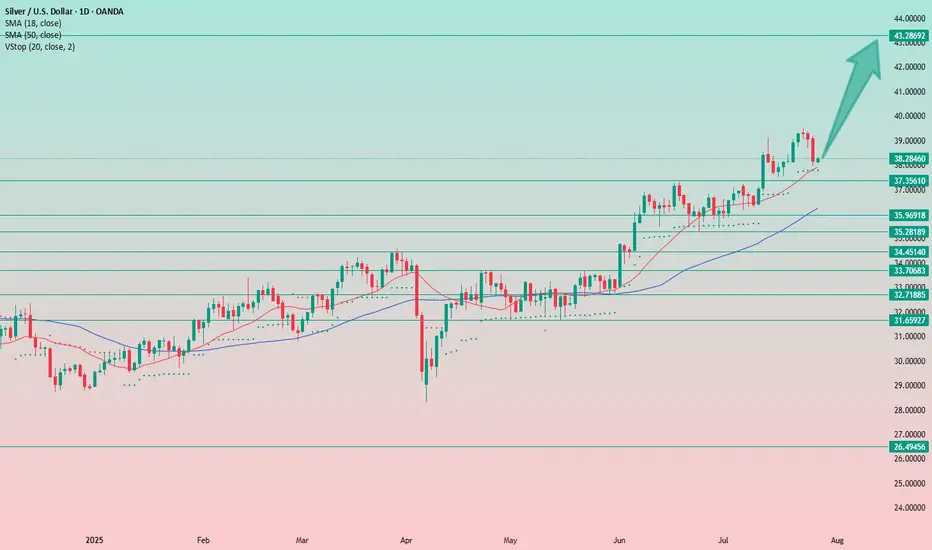
Uptrend Intact: Price Pullback Offers New Long Entry OpportunityThe upward structure of the chart remains intact, and I believe the growth will likely continue in the near future.
At the moment, we’re seeing a price pullback, which provides new opportunities to enter a long position.
I will place a wide stop at the 37.35 level.