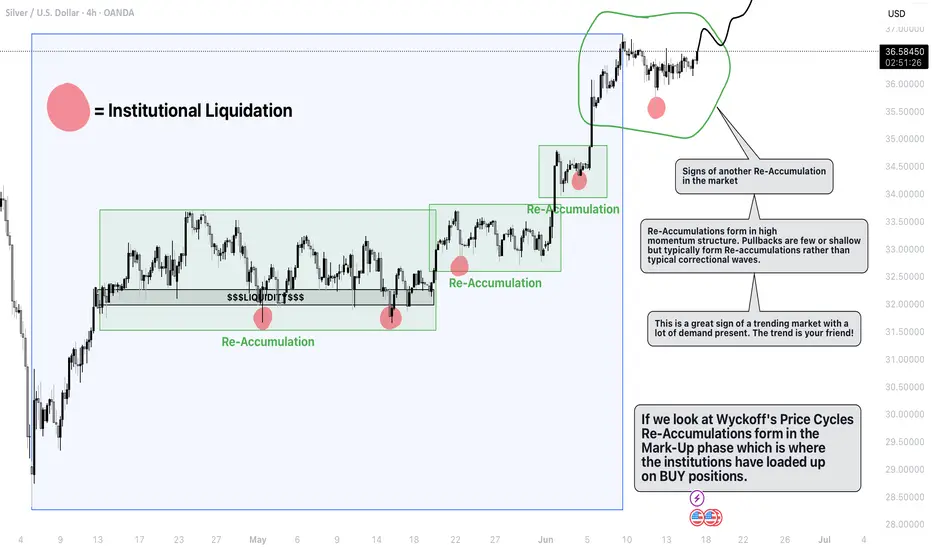
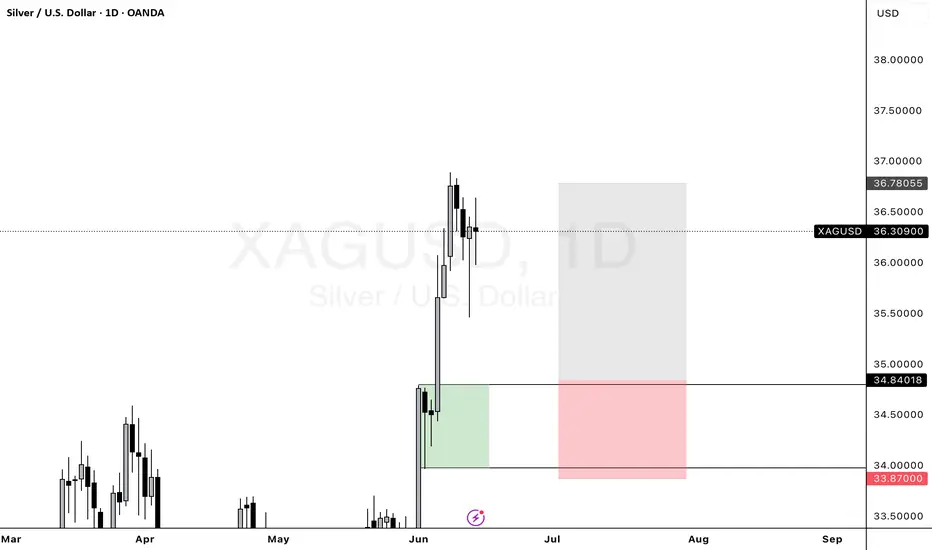
Silver (XAGUSD) Analysis - Market looking strong!Why?
I have been pro-actively trading this market over the last few weeks and months due to its strong bullish nature that it is showcasing. This market is trending very nicely and has delivered the perfect market conditions for me to go LONG. I know this because the impulsive waves are strong and are created with high volume. Rather than seeing typical corrections, we are seeing the formation of Re-Accumulations (stepping stones) to take price higher.
My Predictions
Price is showing no signs of wanting to slow down or stop. Therefore my bias remains Bullish. As of currently, we can see price has began to consolidate and enter the creation of another Re-Accumulation. Clearly with the red highlight, we can see price has liquidated the recent lows which is a sign that the institutions are getting involved. I am expecting price to continue bullish from here, to break the current market high and continue its next leg higher.
I will be looking to get involved once price reaches and breaks the 36.900 level
CONFLUENCES
- Sentiment is above 80% Bullish ( MentFX Sentiment Source )
- Swing lows are being protected
- The effect being created by the cause is strong (Wyckoff Theory)
- Demand is clearly in control
- We are in a mark-up phase of the Wyckoff price cycles (The best phase to go long)
- Given the political uncertainty around the dollar right now, more investors are looking to pump money into alternative assets e.g Gold and Silver.
XAGUSDK trade ideas
Sliver OTW to $40, $50 & blue skySliver OTW to $40, $50 & blue sky. Consolidation breakout imminent. You'll never see sub $40 in your lifetime ever gain.
Silver H1 | Rising into a swing-high resistanceSilver (XAG/USD) is rising towards a swing-high resistance and could potentially reverse off this level to drop lower.
Sell entry is at 36.50 which is a swing-high resistance.
Stop loss is at 36.70 which is a level that sits above the 78.6% Fibonacci retracement and a swing-high resistance.
Take profit is at 36.06 which is a multi-swing-low support that aligns closely with the 50% Fibonacci retracement.
High Risk Investment Warning
Trading Forex/CFDs on margin carries a high level of risk and may not be suitable for all investors. Leverage can work against you.
Stratos Markets Limited (tradu.com ):
CFDs are complex instruments and come with a high risk of losing money rapidly due to leverage. 63% of retail investor accounts lose money when trading CFDs with this provider. You should consider whether you understand how CFDs work and whether you can afford to take the high risk of losing your money.
Stratos Europe Ltd (tradu.com ):
CFDs are complex instruments and come with a high risk of losing money rapidly due to leverage. 63% of retail investor accounts lose money when trading CFDs with this provider. You should consider whether you understand how CFDs work and whether you can afford to take the high risk of losing your money.
Stratos Global LLC (tradu.com ):
Losses can exceed deposits.
Please be advised that the information presented on TradingView is provided to Tradu (‘Company’, ‘we’) by a third-party provider (‘TFA Global Pte Ltd’). Please be reminded that you are solely responsible for the trading decisions on your account. There is a very high degree of risk involved in trading. Any information and/or content is intended entirely for research, educational and informational purposes only and does not constitute investment or consultation advice or investment strategy. The information is not tailored to the investment needs of any specific person and therefore does not involve a consideration of any of the investment objectives, financial situation or needs of any viewer that may receive it. Kindly also note that past performance is not a reliable indicator of future results. Actual results may differ materially from those anticipated in forward-looking or past performance statements. We assume no liability as to the accuracy or completeness of any of the information and/or content provided herein and the Company cannot be held responsible for any omission, mistake nor for any loss or damage including without limitation to any loss of profit which may arise from reliance on any information supplied by TFA Global Pte Ltd.
The speaker(s) is neither an employee, agent nor representative of Tradu and is therefore acting independently. The opinions given are their own, constitute general market commentary, and do not constitute the opinion or advice of Tradu or any form of personal or investment advice. Tradu neither endorses nor guarantees offerings of third-party speakers, nor is Tradu responsible for the content, veracity or opinions of third-party speakers, presenters or participants.

Silver expectation 1HSilver has been developing for a while now, and its funneling into a bullish flag. Its had the change to break out, but couldnt, also, it could have gone into a sell, but didnt. The main uptrend is still being supported, so the chance of a bullish movement is good. The US news later will help price move well...lets hope its for the buy.

Silver Swing plan trade .???if price come to this level then you can plan trade by 15 min candlestick confirm like( Engulfing, evening star, etc) or buy after 5min Coch

SILVER: Will Go Down! Short!
My dear friends,
Today we will analyse SILVER together☺️
The in-trend continuation seems likely as the current long-term trend appears to be strong, and price is holding below a key level of 36.344 So a bearish continuation seems plausible, targeting the next low. We should enter on confirmation, and place a stop-loss beyond the recent swing level.
❤️Sending you lots of Love and Hugs❤️

Silver Gains on Tensions, Eyes on FedFriday’s strong U.S. data may support the dollar, as the University of Michigan’s Consumer Sentiment Index rose to 60.5 in June from 52.2, beating forecasts of 53.5 and marking the first gain in six months.
Geopolitical tensions continue to drive safe-haven demand, especially for silver. Israel struck Iranian nuclear and missile sites Friday, killing military officials. On Sunday, Iran began its fourth phase of response, warning of firm retaliation to further Israeli actions.
Markets now turn to Wednesday’s Fed meeting. While rates are expected to stay unchanged, futures still price in two cuts this year, possibly starting in September, supported by last week’s soft inflation data.
Resistance is set at 36.90, while support stands at 35.40.

Silver Setup: Ready for the Next Leg HigherSilver is consolidating, and I expect an upward breakout.
At the very least, I believe the price will reach the $37.35 level — and there’s a strong chance we’ll go even higher, potentially up to $44 per ounce.
Long from current levels.
Stop-loss at $35.10.

Oil Extends Rally as Israel-Iran Conflict Stokes Supply FearsBrent jumps 5.5 %, bullion hits fresh records, but analysts still see $65 crude by Q4 if key shipping lanes stay open
The crude-oil market loves nothing more than a geopolitical headline, and the one that flashed across terminals this past weekend was a whopper: escalating hostilities between Israel and Iran. Within minutes of the first wire stories, Brent crude vaulted 5.5 % to an intraday high of $76.02 a barrel—its largest single-session pop since Russia invaded Ukraine in early 2022—before giving back part of the gain to settle just under $76. West Texas Intermediate (WTI) traced a similar arc, peaking at $74.11 and closing fractionally lower.
At the same time, investors stampeded into traditional havens. COMEX gold pierced $2,450 an ounce for the first time, while silver sprinted above $33—blowing past the decade-old high set during the meme-metal frenzy of 2021. The twin moves in energy and precious metals underscore how fragile risk sentiment has become even as global demand growth, OPEC discipline, and U.S. shale resilience point to a more balanced physical market later this year.
Below we dissect the drivers of crude’s latest surge, explore the scenarios that could push prices back toward—or away from—the $65 handle by the fourth quarter, and explain why bullion refuses to loosen its grip on record territory.
________________________________________
1. What Sparked the Spike?
1. Tit-for-tat escalation. Reports of Israel striking Iran-linked assets in Syria and Iran responding with drone attacks near the Golan Heights raised fears of a direct Israel-Iran confrontation—a worst-case scenario that could spill into the Strait of Hormuz and threaten 20 % of global seaborne oil.
2. Thin pre-holiday liquidity. Monday volume was 30 % below the 20-day average with several Asian markets closed, exaggerating price swings and triggering momentum-chasing algos.
3. Options market gamma squeeze. Dealers short upside calls scrambled to hedge as spot pierced $75, accelerating the melt-up. Open interest in $80 Brent calls expiring in June ballooned to 45,000 contracts—four times the 3-month norm.
________________________________________
2. How Real Is the Supply Risk?
While the headlines are chilling, physical flows remain intact for now:
• Strait of Hormuz: No tankers have been impeded, insurance premia have widened only 25 ¢ per barrel—well below the $3 spike seen after the 2019 Abqaiq attack in Saudi Arabia.
• Iraqi-Turkish Pipeline: Still shuttered for unrelated legal reasons; volumes have been offline since March 2023 and are therefore “priced in.”
• Suez Canal / SUMED: Egyptian authorities report normal operations.
In short, the rally is risk premia, not actual barrels lost. That distinction matters because premia tend to deflate quickly once tension plateaus, as the market witnessed in October 2023 after Hamas’s initial assault on Israel.
________________________________________
3. Fundamentals Point to Softer Prices by Autumn
Four forces could push Brent back into the $65–68 corridor by Q4 2025 if the geopolitical situation stabilizes:
Force Current Status Q3–Q4 Outlook
OPEC+ Spare Capacity ~5.5 mbpd, most in Saudi/UAE
Ability to add 1–2 mbpd if prices spike
U.S. Shale Growth 13.3 mbpd, record high +0.6 mbpd y/y, breakeven $47–55
Refinery Maintenance Peak spring turnarounds remove 1.5 mbpd demand Units restart by July, easing crude tightness
Global Demand +1.2 mbpd y/y (IEA) Slows to +0.8 mbpd on OECD weakness
Add seasonal gasoline demand ebbing after August, and the supply-demand balance tilts looser just as futures curves roll into Q1 2026 deliveries—a period typically beset by refinery slowdowns and holiday travel lulls.
________________________________________
4. Scenario Analysis: Three Paths for Brent
1. Escalation (20 % probability)
• Direct Israeli strike on Iranian territory → Tehran targets Hormuz traffic
• 3 mbpd disrupted for one month
• Brent overshoots to $100+, backwardation widens above $10
• Biden releases 90 mb from the SPR; OPEC signals emergency meeting
2. Containment (60 % probability)
• Hostilities remain proxy-based in Syria/Lebanon; shipping unscathed
• Risk premium bleeds off; Brent drifts to $70–72 by July
• By Q4 oversupply emerges; prices test $65
3. Detente (20 % probability)
• U.S.-mediated cease-fire; hostages exchanged
• Iran de-escalates to focus on reviving JCPOA talks
• Risk premium collapses; Brent revisits mid-$60s by August and low-$60s into winter
________________________________________
5. Why Gold and Silver Are On Fire
The precious-metals rally is less about oil and more about real yields and central-bank buying:
• Real 10-year U.S. yield sits at 1.05 %, down from 1.55 % in February, boosting gold’s carry cost competitiveness.
• PBoC & EM central banks added a net 23 tonnes in April—the 17th straight month of net purchases.
• ETF inflows turned positive for the first time in nine months, adding 14 tonnes last week.
Silver benefits from the same macro tailwinds plus industrial demand (solar panel capacity is growing 45 % y/y). A tight COMEX inventory cover ratio—registered stocks equal to just 1.4 months of offtake—amplifies price sensitivity.
________________________________________
6. Cross-Asset Implications
1. Equities: Energy stocks (XLE) outperformed the S&P 500 by 3 % intraday but could retrace if crude fizzles. Miners (GDX, SILJ) may enjoy more durable momentum given new-high psychology.
2. FX: Petro-currencies CAD and NOK rallied 0.4 % vs. USD; safe-haven CHF gained 0.3 %. JPY failed to catch a bid, reflecting carry-trade dominance.
3. Rates: U.S. 2-year yields slipped 6 bp as Fed cut odds edged up on stagflation fears, but the move lacked conviction.
________________________________________
7. What Could Invalidate the Bearish Q4 Call?
• OPEC+ Discipline Frays: If Saudi Arabia tires of single-handedly absorbing cuts and opens the taps, prices could undershoot $60—but Riyadh’s fiscal breakeven (~$82) makes this unlikely.
• U.S. Election Politics: A new White House may re-impose harsher sanctions on Iran or ease drilling restrictions, tilting balances either way.
• Extreme Weather: An intense Atlantic hurricane season could knock Gulf of Mexico output offline, squeezing physical supply just as refineries demand more feedstock.
________________________________________
8. Trading and Hedging Playbook
Asset Bias Vehicles Key Levels
Brent Crude Fade rallies toward $80; target $68 by Oct ICE futures, Jul $70 puts Resistance $78.80 / Support $71.30
WTI Similar to Brent NYMEX CL, calendar-spread (long Dec 24, short Dec 25) Resistance $75.20
Gold Buy dips if real yields fall below 0.9 % Futures, GLD ETF, 25-delta call spreads Support $2,390
Silver Momentum long until $35; tighten stops Futures, SLV ETF, 2-month $34 calls Resistance $36.20
Energy Equities Pair trade: long refiners vs. short E&Ps ETFs: CRAK vs. XOP Watch crack spreads
Risk managers should recall that correlation spikes under stress: a portfolio long gold and short crude looks diversified—until a Middle-East cease-fire nukes both legs.
________________________________________
9. Macro Backdrop: Demand Still Fragile
Even before the flare-up, oil demand forecasts were slipping:
• OECD: Eurozone PMIs languish below 50; German diesel demand –7 % y/y.
• China: Q2 refinery runs flatlining; teapot margins < $2/bbl.
• India: Bright spot with gasoline demand +9 %, but monsoon season will clip growth.
On the supply side, non-OPEC production is rising 1.8 mbpd this year, led by Brazil’s pre-salt, Guyana’s Stabroek block, and U.S. Permian efficiency gains. Unless Middle-East barrels exit the market, the call on OPEC crude will shrink from 28 mbpd in Q2 to 26.7 mbpd in Q4, forcing the cartel to decide between market share and price.
________________________________________
10. Historical Perspective: Geopolitical Risk Premiums Fade Fast
Event Initial Brent Jump Days to Round-Trip Barrels Lost?
2019 Abqaiq Attack +15 % 38 < 0.2 mbpd for 30 days
2020 U.S.–Iran (Soleimani) +5 % 10 None
2022 Russia-Ukraine +35 % Still elevated > 1 mbpd rerouted
Based on precedent, a 5–7 % surge without real supply disruption typically unwinds within six weeks.
________________________________________
11. Outlook Summary
• Base Case: Containment; Brent averages $70–72 through summer, melts to $65–68 Q4. Gold consolidates above $2,350; silver churns $30–34.
• Bull Case (Oil): Hormuz threatened; Brent $100+, gas prices soar, Fed forced to juggle inflation vs. growth.
• Bear Case (Oil): Cease-fire + soft demand; Brent breaks $60, OPEC+ grapples with fresh round of cuts.
•
________________________________________
12. Conclusion
The Israel-Iran flashpoint has injected a fresh geopolitical premium into oil and turbo-charged safe-haven metals, but history suggests emotion-driven rallies fade quickly when physical barrels keep flowing. Unless missiles land near Hormuz or an errant drone strikes a Saudi export terminal, the structural forces of rising non-OPEC supply and cooling demand should reassert themselves, dragging Brent back toward the mid-$60s by year-end.
For traders, that means respecting the tape today but planning for mean reversion tomorrow—selling gamma-rich call structures in crude, rolling stop-losses higher on bullion longs, and watching like hawks for any hint that shipping lanes are no longer merely a headline risk but a tangible bottleneck. Until that line is crossed, the smart money will treat each price spike not as the dawn of $100 crude, but as an opportunity to hedge, fade, and position for a calmer, cheaper barrel in the months ahead.
Silver Breaks Above Resistance and has a $50 Price ObjectiveSilver has been in an up-trend since March 2020. There is also a well defined resistance line since August 2020. Price just broke above this resistance and stayed above for 5 days. The support and resistance lines nearly form an up-sloping channel with a width of $18 to $10 ($14 average). The price objective is now $50 ($36 current + $14). This coincides with the prior high from 2011 which is the next major resistance level (orange flat line). A stop loss can be placed at the recently broken resistance line which is now support.

SILVER Buyers In Panic! SELL!
My dear friends,
My technical analysis for SILVER is below:
The market is trading on 36.320 pivot level.
Bias - Bearish
Technical Indicators: Both Super Trend & Pivot HL indicate a highly probable Bearish continuation.
Target - 35.168
Recommended Stop Loss - 36.830
About Used Indicators:
A pivot point is a technical analysis indicator, or calculations, used to determine the overall trend of the market over different time frames.
Disclosure: I am part of Trade Nation's Influencer program and receive a monthly fee for using their TradingView charts in my analysis.
———————————
WISH YOU ALL LUCK

Silver As global tensions and war intensify, silver becomes more than just a safe-haven asset it’s a strategic resource.
💥 Silver plays a key role in military tech, from drones to advanced weapons systems.
📈 Holding silver isn’t just smart… it’s a hedge against geopolitical instability.
#Silver #Geopolitics #DefenseStocks #SafeHavenAssets #MilitaryTech #Commodities

SILVERThe price of silver is trading around $36.308 per ounce (approximately $1,203 per kilogram), showing modest gains with a slight intraday rise into a new high of 36.770
Year-to-Date Performance: Silver has gained over 14% in 2025 and about 23.6% since the start of the year in kilogram terms, reflecting strong industrial demand and safe-haven buying.
Industrial Demand: Growth in renewable energy sectors, especially solar power and electric vehicles, continues to drive robust demand for silver, which is a key component in photovoltaic cells and electronics.
Geopolitical and Market Factors: Recent geopolitical tensions, such as the Iran-Israel conflict, have supported silver as a safe-haven asset alongside gold, contributing to price strength.
Volatility: While silver has seen strong gains, short-term fluctuations remain, influenced by dollar strength, interest rate expectations, and profit-taking by investors.
silver as undervalued relative to its industrial demand and inflation hedge qualities,so expect continued upward pressure over the medium term .Supply-side risks, including mining disruptions and environmental regulations, may tighten availability and support prices.
Investors should be mindful of potential short-term pullbacks amid profit-taking or shifts in macroeconomic sentiment.
Key Drivers for price rally ,Industrial demand, safe haven, geopolitical tensions Solar energy, EVs, Iran-Israel conflict
In summary: Silver prices are currently strong, supported by industrial demand, geopolitical uncertainty, and safe-haven buying. While short-term volatility persists, the medium-term outlook remains bullish due to supply constraints and growing demand from renewable energy and technology sectors.
#silver#gold

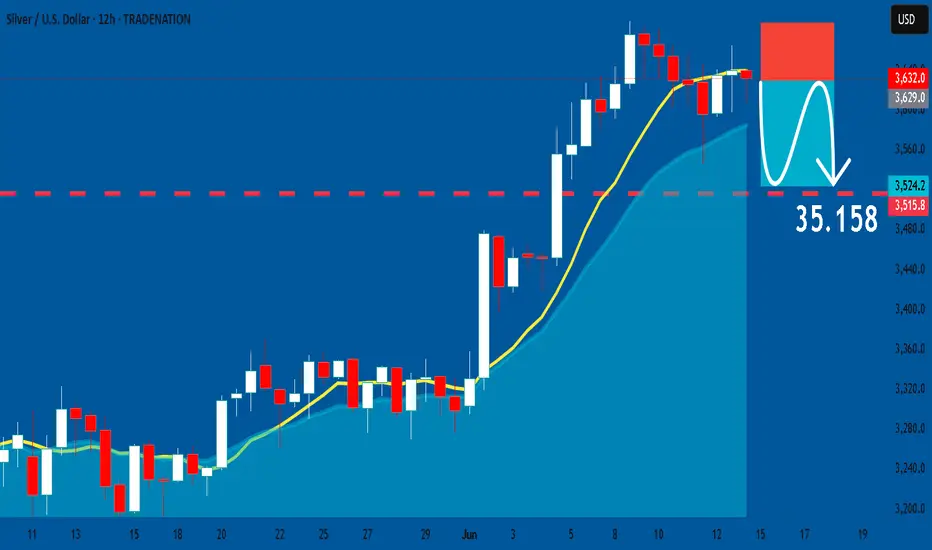
SILVER: Short Trade Explained
SILVER
- Classic bearish setup
- Our team expects bearish continuation
SUGGESTED TRADE:
Swing Trade
Short SILVER
Entry Point - 36.320
Stop Loss - 36.874
Take Profit - 35.158
Our Risk - 1%
Start protection of your profits from lower levels
Disclosure: I am part of Trade Nation's Influencer program and receive a monthly fee for using their TradingView charts in my analysis.
❤️ Please, support our work with like & comment! ❤️
XAGUSD Technical & Order Flow AnalysisOur analysis is based on a multi-timeframe top-down approach and fundamental analysis.
Based on our assessment, the price is expected to return to the monthly level.
DISCLAIMER: This analysis may change at any time without notice and is solely intended to assist traders in making independent investment decisions. Please note that this is a prediction, and I have no obligation to act on it, nor should you.
Please support our analysis with a boost or comment!

Sliver interesting spot I don't like to tell anyone what to trade or how to trade. I want to show them what I see. I hope this helps

XAGUSD | 09.06.2025SELL 35.1500 | STOP 37.1500 | TAKE 34.5500 | Expect a corrective downward price movement within an ascending channel with some dollar strength this week.

silver daily cp 📓 Updated Journal Entry – XAGUSD
Direction: Buy
Entry Zone: Daily CP demand
Trend: Monthly, Weekly, and Daily all bullish
Target: 2R reward from entry
Status: Pending
Chart: View Chart
Notes:
Watching for price to enter the daily CP demand and form a bullish entry signal
Will exit at 2x the distance of the stop loss once in
Setup aligns with trend-following strategy and continuation logic
SILVER: The Market Is Looking Down! Short!
My dear friends,
Today we will analyse SILVER together☺️
The in-trend continuation seems likely as the current long-term trend appears to be strong, and price is holding below a key level of 36.303 So a bearish continuation seems plausible, targeting the next low. We should enter on confirmation, and place a stop-loss beyond the recent swing level.
❤️Sending you lots of Love and Hugs❤️

Dollar Week Review and thoughtsMy General thoughts on dollar and keeping my bearish bias going forward into next week.
Still bullish silver gold cable fibre and looking to see what happens with aussie to get in again
Have a good weekend!!

Silver to Continue UpWhen a price goes to oversold/overbought levels as indicated by the Bollinger Band, one must them look at the Band Width. When this indicator is rising, it shows that price is stronger than the average. My rule of thumb is to stay positioned in the direction of the trend until this number reverses.

Rate Cut Bets Keep Silver in FocusSilver slipped toward $36 per ounce as investors locked in gains after hitting a 13-year high. The metal remains supported by strong industrial demand, supply deficits, and safe-haven interest during global uncertainty. Industrial uses, especially in solar and electronics, account for over half of the demand. A fifth consecutive annual supply deficit is expected, though the Silver Institute sees the gap narrowing by 21% in 2025. Softer U.S. inflation data for May also increased expectations of Fed rate cuts beginning in September, helping sustain interest in precious metals.
Resistance is set at 36.90, while support stands at 35.40.

Silver energy buildup, Bullish continuation pattern developing Key Support and Resistance Levels
Resistance Level 1: 3723
Resistance Level 2: 3787
Resistance Level 3: 3847
Support Level 1: 3507
Support Level 2: 3448
Support Level 3: 3386
This communication is for informational purposes only and should not be viewed as any form of recommendation as to a particular course of action or as investment advice. It is not intended as an offer or solicitation for the purchase or sale of any financial instrument or as an official confirmation of any transaction. Opinions, estimates and assumptions expressed herein are made as of the date of this communication and are subject to change without notice. This communication has been prepared based upon information, including market prices, data and other information, believed to be reliable; however, Trade Nation does not warrant its completeness or accuracy. All market prices and market data contained in or attached to this communication are indicative and subject to change without notice.
