See told you guys that this pair always follows XAUUSD 🤩Went exactly as I planned and went all the way down the same way as XAUUSD 📉
XAUAUD trade ideas

XAUAUD always follows XAUUSD footsteps!This pair always follows XAUUSD no matter so if XAUUSD goes down then this one goes down as well.
But on here it has two possible entries where price could go, we just have to wait and see what the final outcome is but I’m pretty sure it’s going to head down either way📉

BIG DOWNSIDE IN THE XAUAUDStoploss well above 2874 and take profit 2763. Use proper risk management.
Enjoy the pips.


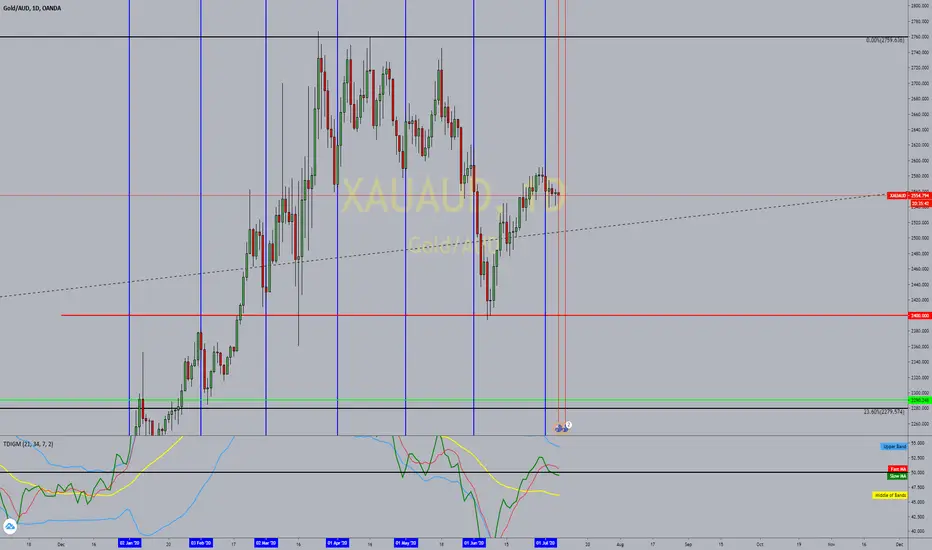
The big Gold consolidationGold is showing some weakness after a very strong performance in the last 2 weeks, matching ATH in (Australian dollar terms) recorded in April - May 2020.
Consolidation is expected next between the trendline and the resistance @ 2735 before the next run through ATH.

GOLD/ AUD - Time to BuyWell, the time has come to pick up some more of the yellow metal down under.
As you can see, the pullback i forecast has played out quite nicely and is now presenting us with a nice opportunity to participate in the potential subsequent move higher.
I would place a stop at a close below the Vol stops
Other than that, the price action and the macro environment is nothing but bullish for gold (and indeed silver).
- TradingEdge


XAUAUD sellsTechnicals:
D1 downside breakout of sideways movement and retracement
H4 bearish gartley, downside breakout of uptrend and retracement
Price at resistance level
Not a fundamentally backed trade as XAU may be bullish due to market uncertainty.
Nonetheless, an interesting technical analysis which we can watch to see if it plays out.
I will be staying out of this trade.

XAUAUD : longLooking to buy XAUAUD near support zone .
Staying bullish unless candles ( hourly) will close under zone A

XAUAUD POSSIBLE OLHC STRUCTURE JULYPlease support this idea with LIKE if you find it useful..
OLHC
JULY MONTHLY STRUCTURE & OHLC YEARLY STRUCTURE
MONTHLY STRUCTURE IN DAILY TIMEFRAME
Kindly wait for price to find a strong support. We will find confluence with other technical indicators for a VALID BUY ENTRY. Price appears to be dominated by sellers.
YEARLY STRUCTURE OHLC
Patiently waiting for the cross of Priceline below Bloodline to confirm full sells for the rest of year.
Short Term Buys for the month of July if price finds support & Long term sells if Priceline crosses below bloodline.
Trade with Caution. Wait for valid entries.
P A T I E N C E + D I S C I P L I N E
$XAUAUD Gold Aud MAs
price in the blue range bouncing off the yellow range.
Lower high set in showing a change of momentum.
Watch the strengthening AUD against the USD which is what is lowering gold prices atm.


Gold (AUD) daily- Uptrend from early still intact.Gold (AUD) daily- Uptrend from early still intact and recently confirmed.

Gold (AUD) since 2007- Secular bull market.Gold (AUD) has been in a secular bull market since the early 2000s
Four easily identified formations (last 3-4 years each). The current formation still has a way to go to be 3-4 years old.
Ascendening Broadening wedges, Falling wedge, Up channel, Slight ascendening broadening wedge or Up channel (current formation).

Aussie #GOLD $XAUAUD Respecting the Major Trend Line Aussie $GOLD $XAUAUD is respecting the major bull trend line to date. Expecting price to plot along for the rest of 2020 before making new highs in early 2021.

Gold (AUD) daily- Ascendin' Broadenin' Wedge(ABW) inside anotherGold (AUD) daily- Ascendin' Broadenin' Wedge(ABW) inside another ABW!


Gold (AUD) daily- Clear breakout from Ascendin' Broaden' WedgeGold (AUD) daily- Clear downward breakout from Ascending' Broadening Wedge (ABW). Price target is horizontal red line. Temporary relief at purple UpTrend line.
Regarding the 52% of ABW that break out downwards. 81% of those act as Reversals of the prevailing trend- Thomas Bulkowski.
thepatternsite.com
