XAUCHF trade ideas
xauchf elliott wavesThe count is very good. This Elliott wave structure has many good things going for it:
(Red = Intermediate) Waves (1) to (5) and (2) to (4) perfectly connect on a very precise parallel channel trendline(s).
The subwaves are all there.
Wave (5) seemingly ends in an ending diagonal triangle (EDT).
The “proof” of the ending triangle is that prices collapsed to beyond the starting point of the EDT. That occurred today.
Corrective waves (2) and (4) alternate in form. Flat vs. zigzag. This is a good EW structure trait.
Peak RSI on the medium and long-term charts is where we expect it to be; at the subwave 3 of 3 or wave 3 in general with declining RSI strength as the wave structure advances to peak.
Prices bounced perfectly at the long term lower trendline. This could be the wave 1 down low. We shall see if a significant bounce occurs. It would be the logical spot.
Additionally, prices reached a significant horizontal support line. A logical bounce spot.
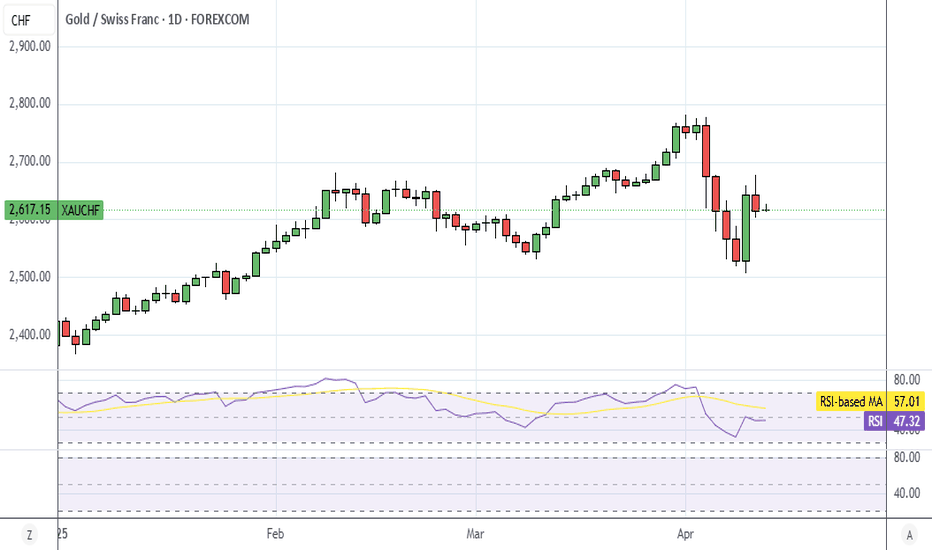
XAU/CHF | Down Retest High chance but continue Bullish channel?🔥 XAU/CHF Price Forecast – Bullish Channel Holding Strong!
The XAU/CHF pair remains in a bullish trend, with price action respecting the bullish channel after completing a key retest of support levels. This signals a potential continuation of the uptrend, offering a high-probability trading opportunity.
📌 Market Structure & Technical Setup:
✅ Pattern Formation: A Symmetrical Triangle was previously observed, but the market has now transitioned into a bullish channel.
✅ Retest Confirmed: Price successfully tested the 2,624 – 2,612 support zone, reinforcing bullish momentum.
✅ EMA 50 Support: The market remains above the 50 EMA, which is acting as a dynamic support level, strengthening the upside outlook.
🎯 Key Price Levels & Target Zones:
📈 Entry Zone: 2,624 – 2,612
1st Target : 2,642
2nd Target : 2,667
3rd Target : 2,700
⚠ Risk Management & Trading Plan:
🔹 Stop Loss Strategy: Always maintain a disciplined stop loss to manage risk effectively.
🔹 Breakout Confirmation: Watch for a strong candle close above 2,642 for further bullish confirmation.
🔹 Momentum Check: Increased buying volume and price action signals will be key to sustaining the uptrend.
📢 Stay Ahead of the Market!
💡 Like, Comment & Follow for real-time market insights, expert trade setups, and profitable trading strategies!
clear positionHi,
retracement come to 200sma and 0,618 fibo point. nice supply i think. can be some gartley or crab formation which i dont care.
4h rsi on bull side
daily macd works well. we have to see cross to enter trace.
1713 level is the key. when hits check the volume and candlestick forms.
cy.
INGCHF/BUY POSITIONHi guys
As you can see ,The price is in a descending channel, and in the third meeting with the ceiling of the channel , which we marked with a circle, it breaks the channel and is expected to rise firs to the middle and them to the ceiling of the next channel.
Be sure to comment your opinion.
good luck


