XAUEUR trade ideas


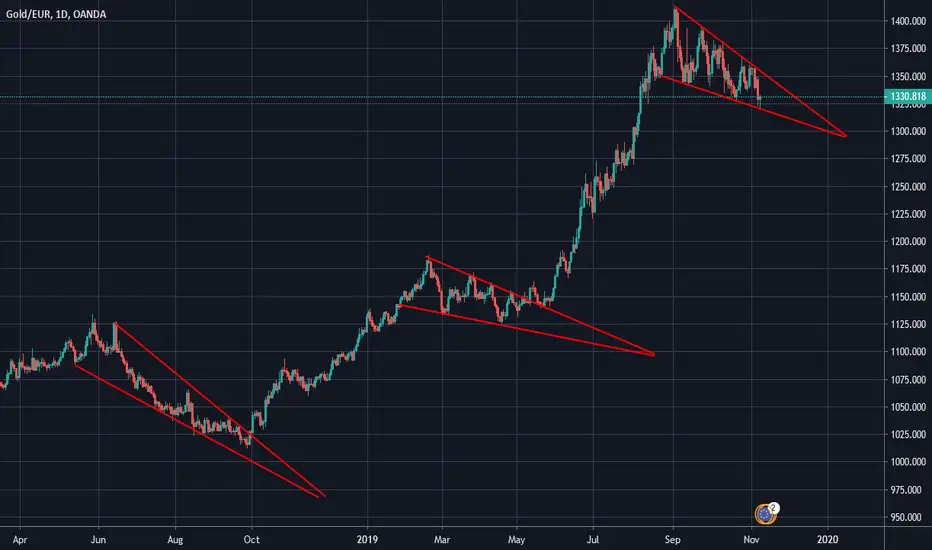
Falling Wedge FormingPrice is trading within a falling wedge pattern which has a 5 wave structure as illustrated. We can also see RSI divergence which may signal exhaustion of bears. We might see a correction wave to the triangle highs. Price might also find support/false break at the 100ema like it did back on April 17. A candlestick formation is vital to attempt a long position. Don't jump in front of the speeding train.

Whats next up for Gold?Is it another bullflag?
Worst case it can drop back to 1350 usd, but within 5 years gold most probably will be at least 5000 dollar because of all the debts and financial trouble in the world.
FOREX - GOLDEUR 4HGold-Euro; breakout looks will to the short run. H&S, 'Bearish' butterfly pattern's D leg's and waves are considerable. I think new bullish trend should begin. Break a leg!

Another flag for wave 5th on goldSeing the flag on the current wave, we could say bull trend is not finished on gold. A last wave 5th could break resistance shortly.


XAUEURGold / Euro has recently hitthe resistance for expanding triangle, which is also the supply zone. So My prediction is that of a drop headed down to the Quasimodo Level.


posible venta(sell)gbpusd me saco en BE Jaja bueno me gusto este trade porque es mas simple que el xauusd, si quieres analizar el xauusd, es mejor analizar este primero... tienen una correlacion bastante parecida.
bueno a lo que vamos, pienso que seguira su tendencia bajista. es un analisis de zonas nada complicado- y esperar haber como va...


Gold seeks a breakoutPrecious metal price in Euro is set to re-test the 23.60 retracement level again in a bid to break out of the triangle-shaped formation. If the price persists above that line, we will follow 1365. The second upward target in that case will be 1368 that corresponds with the 38.20 retracement.


Euro gold re-testing breakdown with head and shoulders topSomething is happening. Dollar gold is stronger than euro gold. Maybe a big euro reversal?

Euro gold has broken down and ready for a tumble to 1280But dollar gold held support and going higher.

