Gold’s back on track, paying attention to momentum and hintsXAUUSD is still climbing steadily within its upward parallel channel, respecting structure beautifully as we’re now seeing early signs of bullish interest returning, right after we got a nice rejection from the support zone.
Currently I’m watching this bounce to have a target near 3,380 , somewhere around the middle line of the ascending channel. If this bullish push continues with strong volume and momentum, I’ll be locking in that bias and planning my entry accordingly.
Patience first, I always wait for price to prove itself before getting involved.
This could be a beautiful continuation…
Or just one more fakeout before a deeper drop.
XAUUSD trade ideas

Gold bulls take control as geopolitical risk take center stage!Gold prices advanced during the Asian trading hours, touching a fresh daily high around the $3,317 mark. The move comes amid a combination of factors boosting demand for the yellow metal, notably dovish signals from the Federal Reserve and escalating geopolitical tensions.
The US Dollar weakened following Friday's softer-than-expected inflation data, which has strengthened market expectations for a potential Fed rate cut in the second half of 2025. Investors are now positioning for looser monetary policy, which typically enhances the appeal of non-yielding assets like gold.
In parallel, geopolitical risks continue to dominate market sentiment. Ongoing conflicts in Ukraine and the Middle East, coupled with renewed US-China trade tensions, have weighed on risk appetite and fueled safe-haven inflows into gold.
From a technical standpoint, XAU/USD faces immediate resistance in the $3,355–$3,375 supply zone. A sustained move above this area could open the door to further gains. Conversely, any near-term pullback might find initial support near the $3,300 psychological level, with stronger buying interest expected around the $3,280–$3,278 region.

GOLD NEXT MOVE (expecting a bearish move)(09-06-2025)Go through the analysis carefully and do trade accordingly.
Anup 'BIAS for the day (09-06-2025)
Current price- 3328
"if Price stays below 3336-38, then next target is 3318, 3308, 3290 and 3270 and above that 3348 and 3360 ".
-POSSIBILITY-1
Wait (as geopolitical situation are worsening )
-POSSIBILITY-2
Wait (as geopolitical situation are worsening)
Best of luck
Never risk more than 1% of principal to follow any position.
Support us by liking and sharing the post.

Lingrid | GOLD resistance Swap Zone Shorting OpportunityOANDA:XAUUSD is approaching a critical retest of the broken upward trendline and swap zone near 3342 after failing to maintain resistance above the 3400 area. The prior double top pattern and bearish divergence signal weakening momentum. If the price is rejected at the retest level, a move toward 3300 becomes likely.
📉 Key Levels
Sell trigger: rejection from 3340-3350 with lower high
Buy zone: 3295–3300
Target: 3300 and potentially 3245
Buy trigger: reclaim of 3342 with strong bullish candle
💡 Risks
Breakout above 3342 could reverse structure
Support at 3300 may hold firm on the first test
Weak volume could lead to fake moves in tight consolidation
Traders, if you liked this idea or if you have your own opinion about it, write in the comments. I will be glad 👩💻

GOLD → Strengthening and return to range. Focus on 3340FX:XAUUSD is forming a fairly strong support zone (a cascade within an upward line). The price is returning to the range, with bulls storming 3330-3340.
Markets are awaiting US inflation data (CPI), which may affect expectations for a Fed rate cut in September (chances are about 52%). Optimism following progress in US-China trade talks is supporting sentiment, but uncertainty remains due to a court ruling allowing Trump to maintain tariffs. This is holding back the dollar and helping gold. CPI forecast: 0.2% growth, core inflation 0.3%. Lower inflation, on the other hand, will support expectations of lower rates and strengthen demand for gold as a safe-haven asset.
Technically, gold is stuck between the boundaries of a symmetrical triangle. Overall, this situation is reflected in all markets. Consolidation is forming and the price could break out in either direction...
Support levels: 3301, 3330, 3340
Resistance levels: 3349, 3361, 3375
Focus on the boundaries of the previous range - 3330 - 3340. If the bulls, after the assault, manage to hold their ground above this zone, the market may take the initiative due to support and continue its growth towards areas of interest.
Best regards, R. Linda!

Lingrid | GOLD Weekly Market Analysis: Consolidation ContinuesTVC:GOLD has developed a double top pattern, marking a significant shift from the previous consolidation phase. The recent rejection from the $3,400 resistance zone has created a bearish reversal structure that's now testing critical support levels. 4H chart reveals a clear double top formation with peaks around $3,400, followed by a decisive breakout below the flag pattern that previously suggested continuation. This technical deterioration represents a major shift in market structure, with the upward trendline now serving as resistance rather than support.
Current price action at $3,309 sits dangerously close to the key support level at $3,245. A break below this zone would likely trigger accelerated selling toward the major support area around $3,120, representing the bottom of the recent consolidation range. Previous weekly highs (PWHs) around $3,354 now serve as immediate resistance, with the double top peaks at $3,400 representing the more significant barrier. Any recovery attempts will likely face selling pressure at these levels, creating a challenging environment for bullish momentum.
The upward trendline breach is another bearish development, as this line had provided support throughout the entire rally from the cycle lows. Its violation suggests a potential shift in the primary trend structure, though the major support at $3,120 remains intact. However, the major support confluence around $3,120 could provide a lifeline for bulls. This level represents multiple technical factors including previous significant lows and the bottom of the recent consolidation range, making it a natural area for buying interest to emerge.
The current setup suggests gold is entering a more challenging phase where rallies may be sold rather than bought. The shift from continuation to reversal patterns indicates a potential change in market sentiment that could persist until major support levels are tested and either hold or break decisively.
Traders, if you liked this idea or if you have your own opinion about it, write in the comments. I will be glad 👩💻

GOLD → Intra-range strategy. Waiting for NFPFX:XAUUSD remains consolidated in the 3340-3391 range. The price is stuck in the middle of the range due to the uncertainty created by upcoming unemployment news...
On Friday, gold rose slightly, remaining within the range ahead of important US employment data (NFP), which could set the direction for the market. Optimism over the US-China deal and profit-taking on the dollar are supporting the USD, holding back gold's rise. A weak NFP (less than 100,000) will reinforce expectations of a Fed rate cut and support gold. A strong report (above 200,000) will have the opposite effect. The probability of a rate cut in September is 54%.
Technically, on the daily timeframe, the market structure is bullish. After a sharp breakout of resistance and a new high, the price is consolidating above the upward trend line, forming a plateau in the 3300-3340 zone. Another shakeout from support is possible before the trend resumes
Resistance levels: 3375, 3391, 3414
Support levels: 3339, 3331
Forming a price forecast ahead of news, especially ahead of NFP, is a thankless task. Therefore, it is advisable to wait for the news and monitor the price reaction. A retest of the consolidation boundary and a rebound are possible. There is a chance that the price will remain in consolidation until next week, but again, it all depends on the fundamental background...
Best regards, R. Linda!

GOLD → Correction before a decline or continuation of the trend?FX:XAUUSD is testing the liquidity zone during the Asian session and forming a false breakout. The metal is recovering, but the fundamental background remains unstable...
On Monday, gold is holding steady at around $3,300 amid a weaker dollar and caution among traders ahead of US-China talks and the release of US inflation data (CPI) on Wednesday. Strong NFP data for May strengthened the dollar and lowered expectations for a Fed rate cut. However, domestic problems in the US are putting pressure on the currency... Markets are adjusting positions ahead of CPI. Geopolitics and domestic unrest in the US are holding back gold's decline, despite possible optimism about a trade deal.
Technically, the trend is bullish, with the price previously breaking the structure but rising in the Asian session after a false breakdown of the order block and the 3300 liquidity zone. Further movement depends on 3330 - 3340
Resistance levels: 33301, 3339, 3375
Support levels: 3301, 3275
The price is heading towards 3330-3340 for a retest. If the dollar continues to decline and gold manages to consolidate above 3340, the bullish trend may continue. BUT! A false breakout of the 3330-3340 zone could trigger a further decline after the bullish structure breaks down.
Best regards, R. Linda!

GOLD 1H CHART ROUTE MAP UPDATE & TRADING PLAN FOR THE WEEKHey Everyone,
Please see our updated 1h chart levels and targets for the coming week.
We are seeing price play between two weighted levels with a gap above at 3318 and a gap below at 3281. We will need to see ema5 cross and lock on either weighted level to determine the next range.
We will see levels tested side by side until one of the weighted levels break and lock to confirm direction for the next range.
We will keep the above in mind when taking buys from dips. Our updated levels and weighted levels will allow us to track the movement down and then catch bounces up.
We will continue to buy dips using our support levels taking 20 to 40 pips. As stated before each of our level structures give 20 to 40 pip bounces, which is enough for a nice entry and exit. If you back test the levels we shared every week for the past 24 months, you can see how effectively they were used to trade with or against short/mid term swings and trends.
The swing range give bigger bounces then our weighted levels that's the difference between weighted levels and swing ranges.
BULLISH TARGET
3318
EMA5 CROSS AND LOCK ABOVE 3318 WILL OPEN THE FOLLOWING BULLISH TARGETS
3352
EMA5 CROSS AND LOCK ABOVE 3352 WILL OPEN THE FOLLOWING BULLISH TARGET
3388
EMA5 CROSS AND LOCK ABOVE 3388 WILL OPEN THE FOLLOWING BULLISH TARGET
3428
EMA5 CROSS AND LOCK ABOVE 3428 WILL OPEN THE FOLLOWING BULLISH TARGET
3478
BEARISH TARGETS
3281
EMA5 CROSS AND LOCK BELOW 3281 WILL OPEN THE FOLLOWING BEARISH TARGET
3254
EMA5 CROSS AND LOCK BELOW 3254 WILL OPEN THE FOLLOWING BEARISH TARGET
3210
EMA5 CROSS AND LOCK BELOW 3210 WILL OPEN THE SWING RANGE
3179
3146
As always, we will keep you all updated with regular updates throughout the week and how we manage the active ideas and setups. Thank you all for your likes, comments and follows, we really appreciate it!
Mr Gold
GoldViewFX

GOLD → Correction to 3275FX:XAUUSD and medium-term outlook: Friday's strong unemployment data strengthened the dollar and triggered a sell-off in gold. Money is temporarily flowing out of the metal and into currencies and the stock market...
Technically, gold is still in a bullish phase on the global timeframe. Logically, the situation is more reminiscent of a countertrend correction of the zone of interest before continuing growth.
Despite the rise in the DXY after Friday's news, the dollar is still under pressure from Trump, who is pushing for an early interest rate cut. This move could significantly shake the market (dollar down, gold up)
Locally, on the hourly XAUUSD timeframe, we can clearly see how the price is breaking out of the uptrend, thereby triggering a downward impulse.
Resistance levels: 3325, 3343
Support levels: 3303, 3275
The liquidity level of 3300 could act as a magnet for the price, from which a correction to the resistance of the range of 3325 could form (liquidity hunt), but due to the change in the fundamental background, gold may continue its correction to 3275 (support zone) before a possible continuation of growth.
Best regards, R. Linda!

Lingrid | GOLD trend Continuation Targets April High RetestOANDA:XAUUSD has reclaimed the 3,350 level following a successful retest of the upward trendline, sustaining a bullish channel structure. After multiple breakouts and a clean consolidation above previous resistance, price is setting up for a potential move toward the 3,500 mark. A pullback and bounce near 3,330 would reinforce this bullish continuation scenario.
📈 Key Levels
Buy zone: 3,338–3,345
Buy trigger: strong bullish candle above 3,365
Target: 3,500
Sell trigger: break below 3,338 with volume
💡 Risks
Rejection near 3,365 could delay breakout
Breakdown below 3,338 weakens bullish trend
Consolidation flattening may reduce momentum burst potential
Traders, if you liked this idea or if you have your own opinion about it, write in the comments. I will be glad 👩💻

Gold will make impulse up from support line of triangle to 3430Hello traders, I want share with you my opinion about Gold. Some days ago, price entered to triangle, where it made an upward impulse at once to the resistance line, breaking the resistance level. But then price turned around and in a short time declined back, breaking the resistance level one more time. Next, Gold continued to fall and reached the support line of the triangle. After this, it made an impulse up again and exited from the triangle pattern with broke the 3280 level. Price rose to the resistance level and then started to trade inside another triangle pattern. In this pattern, Gold dropped from the 3430 resistance level, which coincided with the resistance line, and dropped to the support line, breaking the 3280 level. After this movement, Gold turned around and started to grow, and later reached the 3280 level and broke it again. Then the price continued to grow and reached the resistance line of the triangle pattern, where at the moment continues to trades near. In my opinion, Gold can rebound from the support line of the triangle and rise to the resistance level, exiting from triangle pattern. For this case, my TP is 3430 level. Please share this idea with your friends and click Boost 🚀
Disclaimer: As part of ThinkMarkets’ Influencer Program, I am sponsored to share and publish their charts in my analysis.

GOLD → Retesting resistance may lead to a breakoutFX:XAUUSD is still bullish. The price is consolidating in the range of 3390-3345, with an intermediate bottom forming inside the channel, which overall indicates positive signs.
On Thursday, gold is consolidating ahead of $3390. Consolidation after growth, within a bullish trend, is a good sign. But, on the one hand, the price is supported by growing tensions between Russia and Ukraine. On the other hand, optimism about US trade negotiations with Canada, the EU, and China is strengthening the dollar and holding back demand for gold.
Additional pressure on the dollar is coming from weak US macro statistics, especially ADP data and the decline in the ISM Services PMI, which have reinforced expectations of Fed policy easing. Traders are waiting for further signals from the regulator.
Resistance levels: 3391.4, 3414, 3435
Support levels: 3365, 3345
Technically, gold is rising and forming a retest of consolidation resistance. If the 3391 level is broken, the price may head towards 3435. Before breaking through resistance, a correction or retest of 3365 may form. However, consolidation near 3391 and a gradual squeeze towards the level will increase the chances of a breakout and growth.
Best regards, R. Linda!

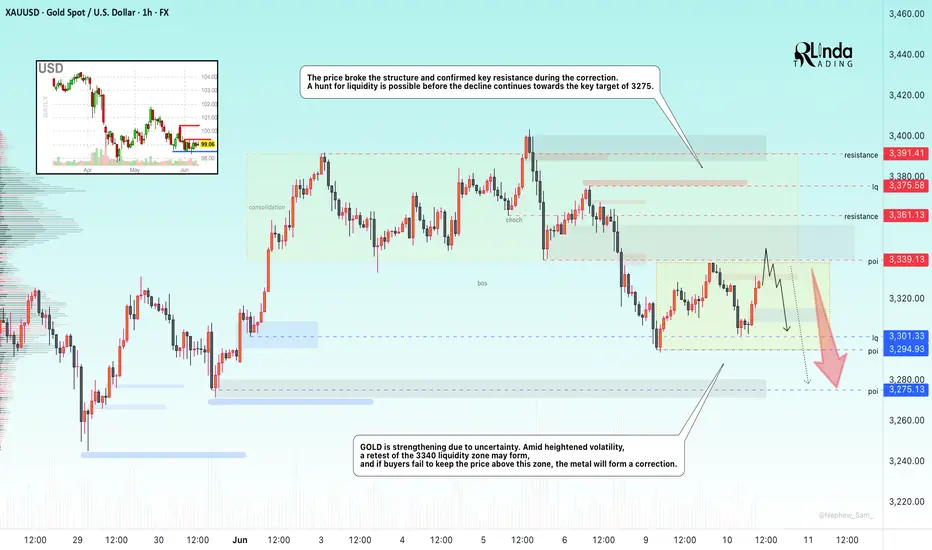
GOLD → Hunt for liquidity ahead of continued correctionFX:XAUUSD is strengthening due to uncertainty while the dollar consolidates. Amid heightened volatility, a retest of the 3340 liquidity zone may form, and if buyers fail to keep the price above this zone, gold may form a correction
Demand for the dollar is supported by the rise in USD/JPY after soft comments on interest rates by Bank of Japan Governor Ueda. Gold is responding with a correction. Traders remain cautious ahead of the outcome of the second day of trade talks between the US and China in London. Donald Trump confirmed that dialogue with Beijing is continuing, but key differences remain. Investors are also awaiting US inflation data (CPI), which could determine the further dynamics of the dollar and gold. Meanwhile, inflation expectations in the US fell from 3.6% to 3.2% in May.
Technically, gold broke the structure and confirmed key resistance during the correction. A hunt for liquidity is possible before the decline continues towards the key target of 3275.
Resistance levels: 3340, 3361
Support levels: 3301, 3275
The price is forming a new trading range of 3340 - 3301 (3294). Before declining, especially if the fundamental background changes to positive as negotiations progress, gold may test the liquidity zone of 3340 and form a false breakout, which will trigger a continuation of the correction to 3275.
Best regards, R. Linda!
GOLD 1H CHART ROUTE MAP UPDATEHey Everyone,
As anticipated, the market structure continues to respect our key levels and EMA5 dynamics to the letter.
After the clean bounce from 3334 into 3359, price did indeed push back toward 3389 for the retest, just as outlined. Once again ema5 failed to cross and lock above 3389, confirming rejection again. It’s important to highlight that price did retest 3389 exactly as projected, completing the range once again.
Crucially, no further EMA5 cross and lock above 3389 was seen, reconfirming the rejection and driving price back into the lower Goldturns, which we will now look for support and bounce off these levels.
The structure continues to unfold with precision, showing once again how effective our level based framework is when paired with EMA5 confirmations. This setup keeps us well aligned with market momentum.
As always, we remain focused and continue to buy dips using our support levels, capturing those 20 to 40 pip opportunities. As we’ve proven time and again, each level gives enough of a bounce for a quality entry and exit.
We encourage everyone to backtest our levels, we’ve shared them weekly for the past 3 years , and the data speaks for itself. These levels continue to work brilliantly with both short/mid term trends and countertrends.
BULLISH TARGET 3305 – ✅ DONE
EMA5 CROSS AND LOCK ABOVE 3305 WILL OPEN THE FOLLOWING BULLISH TARGETS
3334 – ✅ DONE
3359 – ✅ DONE
3389 – ✅ DONE (retested as forecasted)
EMA5 CROSS AND LOCK ABOVE 3389 WILL OPEN THE FOLLOWING BULLISH TARGET
3428
EMA5 CROSS AND LOCK ABOVE 3428 WILL OPEN THE FOLLOWING BULLISH TARGET
3478
BEARISH TARGETS 3271
EMA5 CROSS AND LOCK BELOW 3271 WILL OPEN THE FOLLOWING BEARISH TARGET
3227
EMA5 CROSS AND LOCK BELOW 3227 WILL OPEN THE SWING RANGE
3185
3146
Stay sharp, manage risk, and trust the levels. We’ll continue providing updates as the structure develops further.
Thank you again for all your likes, comments, and continued support.
Mr Gold
GoldViewFX

XAUUSD: Another Important Update On Gold Prices! We recently posted an idea analysis on Gold, but our first entry was invalidated due to the heavy sell-off. We expect a smooth move from the current price point. However, please remember that the market conditions will remain volatile and uncertain due to important economic data being published tomorrow.
Good luck, trade safely!
Team Setupsfx_

XAUUSDHello Traders! 👋
What are your thoughts on GOLD?
A rising wedge pattern has formed on the gold chart and has now been broken to the downside, signaling potential weakness and a likely shift in momentum.
We expect a pullback toward the broken trendline followed by a decline toward lower support levels.
Will gold continue lower after the pullback? Share your outlook below!
Don’t forget to like and share your thoughts in the comments! ❤️

THE KOG REPORT THE KOG REPORT:
In last weeks KOG Report we said we would wait for the market to open and look for a reaction on the Red box and based on that reaction we would decide where we wanted to go and how to trade it! We immediately opened with a bounce which gave us the opportunity to then get on with the move upside as you can see in last weeks chart completing the move we wanted and the red box targets apart from 3406 (we got as far as 3404). We then identified the red box region we were expecting another RIP from and to the point we got the move down to complete the short. Please look at the chart, you will see how we picked the top, the bottom, and then the range trades within the circled levels with point to point, level to level trades all the way through the week.
A fantastic week in Camelot on not only Gold but all the other pairs we trade.
So, what can we expect in the week ahead?
Looking at the economic calendar there isn’t much going on in the early part of the week so there is potential here for the move to terminate just below before giving a bounce upside into the levels of 3330-35 which is the level to watch for the break this week. A rejection at that level can cause further declines taking us into the 3350 level and possibly 3230-25 before we form a swing low.
There is a flip here as stated above, and that is that 3330-35 region, if we break above there then bulls have that opportunity to drive this upside to clear the NFP move and take us back to target the 3400 level. It all depends on the reactions we get at the levels so we’ll start the week with the plan of action, and of course, in these markets we’ll adapt If we have to.
KOG’s bias of the week:
Bearish below 3336 with targets below 3306, 3299, 3297, 3285 and 3275
Bullish on break of 3336 with targets above 3345, 3350, 3355, 3367 and 3376
Red boxes:
Break above 3310 for 3320, 3332, if held above 3335, 3347 and 3362 in extension of the move
Break below 3306 for 3299, 3295, 3285, 3280 and 3264 in extension of the move
Many of our followers and traders have seen the power of the red boxes, Imagine this on your own TV screen, 4H for swing trading, 1H for day trading and 15min for scalping. Any pair on any chart 23hrs a day. Add to that the Knights indicator giving you swing points, key levels and retracement levels and our custom volume indicator telling you when to long, when to short and when to stand back from your trades.
LEARN AND GENERATE YOUR OWN SIGNALS. You don't need any of us to guide you.
Please do support us by hitting the like button, leaving a comment, and giving us a follow. We’ve been doing this for a long time now providing traders with in-depth free analysis on Gold, so your likes and comments are very much appreciated.
As always, trade safe.
KOG

GOLD ROUTE MAP UPDATEHey Everyone,
Quick update following on from yesterday’s post.
As expected, we got the push up after the EMA5 cross and lock above 3318, but price just fell short of our bullish target at 3352, leaving it open. This level now acts as a magnet, with price currently playing between 3318 and 3352, creating a tight range.
We're watching closely for tests on both 3318 and 3352, with direction confirmed only by EMA5 cross and lock. The gap to 3352 still remains, so any bullish momentum should aim to fill this cleanly.
Until one of these levels breaks with confirmation, we’ll likely continue seeing choppy movement in this range. We’ll keep using dips into support for intraday buys, targeting our usual 20–40 pip bounce trades as structure allows.
Once again, thank you all for your ongoing support and engagement, we’ll continue to keep you updated throughout the week, as price unfolds and setups confirm.
Mr Gold
GoldViewFX

HelenP. I Gold may break support level and continue to move downHi folks today I'm prepared for you Gold analytics. Observing this chart, we can see how the price reached support 2, which coincided with the support zone and tried to break it, but failed and dropped below. Then Gold turned around and made an impulse up, broke firstly 3125 level first and then reached support 1 and broke it too. After this movement, Gold continued to grow and reached the trend line, after which it started to decline inside a triangle pattern, where it first fell below support 1, making a first gap. Next, Gold tried to back up, but failed and dropped to support 2, after which it started to grow. In a short time, XAU rose to support 1, broke it, and some time traded between this level. Not long time ago, it rose to the trend line, which is the resistance line of a triangle as well, and then fell to the resistance zone. So, I expect that XAUUSD will break the support level and then continue to fall, thereby exiting from triangle too. For this case, I set my goal at 3225 points. If you like my analytics you may support me with your like/comment ❤️
Disclaimer: As part of ThinkMarkets’ Influencer Program, I am sponsored to share and publish their charts in my analysis.

Gold H4 market update trading in well defined range📉 Gold Holds Steady: Prices are hovering around $3,310–$3,330/oz, restrained by mild USD strength and U.S.–China trade optimism.
🤝 Trade Talks Influence: Rising optimism ahead of U.S.–China discussions has reduced safe-haven demand, keeping gold subdued.
📊 Technical Watch: Gold is testing the $3,300 mark, with support around the 20‑day SMA—failure to hold could spark a dip toward $3,265.
🔮 Resistance Challenge: Bulls face a tough fight near $3,350–$3,377; a breakout above this could clear the path to $3,500.
💼 U.S. Labor Data: Recent strong jobs numbers (May +139k) have tempered expectations of early rate cuts, supporting the USD and pressuring gold.
💰 ETF & Investment Trends: ETF inflows remain firm; a recent Kitco survey shows mainstream and retail investors growing more bullish.
🌍 Safe‑Haven Sentiment: Geopolitical and economic uncertainties (e.g., trade, weak U.S. data) continue to lend underlying support to gold.
⚖ Range-Bound Near Term: Expect consolidation between $3,300–$3,350 as markets await U.S. CPI and further trade news.
📉 Bearish Short‑Term Bias: Syndicate notes a neutral-to-bearish setup—momentum indicators like RSI and stochastics remain soft.
🏠 Med-Term Outlook Bullish: Despite near-term volatility, fundamentals and technical trends favor a gradual climb toward $3,500+ this year.
📊 Technical Outlook Update
🏆 Bull Market Overview
▪️pullback in progress currently
▪️3500 USD heavy resistance
▪️Re-accumulation in progress now
▪️focus on buying low selling high
▪️Expect re-accumulation into June
▪️Downside capped by 3 200 USD
▪️short-term expecting range action
▪️Bulls still maintain strategic control
⭐️Recommended strategy
▪️Accumulate in range
▪️Closer to 3.2K S/R zone
▪️Bears focus on selling high

#XAUUSD[GOLD]:+2200 Pips Big Move! | Setupsfx_|Gold is currently accumulating in smaller timeframes, which suggests it’s in the early stages of a significant move. It’s possible that the price will reverse from either of the entry zones. There are three take-profit areas you can target, but only if they align with your view. This is an educational post, so please don’t blindly follow it – do your own analysis.
Like and comment for more!
Team Setupsfx_

$Gold Fills the Gap – Is a Bullish Bounce Toward $3350 Next?By examining the gold chart on the 4-hour timeframe, we can see that in last week’s analysis, the price successfully hit all four targets: $3338, $3332, $3326, and $3317, and finally closed on Friday at $3309. This move delivered over 390 pips of return, and I hope you made the most out of it!
Now, let’s move on to the latest gold analysis: As you can see, today gold dropped to the $3294 zone, finally filling the liquidity gap previously marked on the chart. Currently, gold is trading around $3315, and I expect further bullish movement toward the $3330 area as the first upside target.
After that, we should closely watch the $3332–$3352 zone for a potential corrective reaction.
There are more details in this analysis that I’ll share soon — with your support!
THE MAIN TA :
