XAU/USD - Channel Breakout (26.06.2025)The XAU/USD pair on the M30 timeframe presents a Potential Buying Opportunity due to a recent Formation of a Channel Breakout Pattern. This suggests a shift in momentum towards the upside and a higher likelihood of further advances in the coming hours.
Possible Long Trade:
Entry: Consider Entering A Long Position around Trendline Of The Pattern.
Target Levels:
1st Resistance – 3385
2nd Resistance – 3410
🎁 Please hit the like button and
🎁 Leave a comment to support for My Post !
Your likes and comments are incredibly motivating and will encourage me to share more analysis with you.
Best Regards, KABHI_TA_TRADING
Thank you.
Disclosure: I am part of Trade Nation's Influencer program and receive a monthly fee for using their TradingView charts in my analysis.
XAUUSD trade ideas

GOLD → Declining interest. Retest of supportFX:XAUUSD experienced significant volatility toward the end of the US trading session. This was due to developments in the Middle East. The de-escalation of the situation is leading to a decline in interest in the metal.
The announced ceasefire between Iran and Israel has reduced demand for gold as a safe-haven asset, while falling oil prices have reduced its appeal as a hedge against inflation. Gold is supported by expectations of a Fed rate cut in July. The focus is on Fed Chair Powell's testimony before Congress and further developments in the Middle East.
Technically, the price confirms the local bearish structure. A continued assault on the 3340 support level could trigger a further decline.
Support levels: 3343-3340, 3320
Resistance levels: 3360, 3366
Focus on the trading range (consolidation) 3340 - 3400. De-escalation of the conflict in the Middle East may lead to a decline in interest in gold as a hedge asset, which may cause the price to break down of consolidation. If the retest of 3340 continues, the price will begin to contract before the level, in which case the chances of a breakdown and decline will only increase. The target will be the liquidity zone of 3320 - 3306
Best regards, R. Linda!

GOLD → Within range. Retest resistance at 3347FX:XAUUSD continues to correct after a false breakdown of support at 3300. Due to uncertainty, the price may remain in the range of 3300-3340 for some time.
Gold is fluctuating amid a weak dollar and uncertainty over Fed rates. Gold is struggling to hold on after rebounding from weekly lows, despite the US dollar falling to multi-year lows. Pressure on the dollar has intensified due to Trump's criticism of the Fed and rumors of a possible replacement for Powell. However, gold is limited in its growth due to a pause in geopolitical tensions and hawkish signals from the Fed chair. Investors are awaiting key macro data from the US (e 12:30 GMT Durable goods orders, GDP, Initial Jobless Claims) and especially the PCE inflation report on Friday.
Technically, the focus is on key areas of interest: 3300, 3306, 3340, 3347. Until strong news emerges, an intraday trading strategy should be considered.
Resistance levels: 3347, 3357
Support levels: 3320, 3307, 3300
Technically, a false breakout of resistance at 3347 and a retest of the local liquidity zone at 3320-3307 are possible before growth continues for the reasons mentioned above. Targets could be 3347, 3364, 3372, and 3396.
Best regards, R. Linda!

GOLD drops sharply to 3300 and found important support areaThe recent bearish momentum on GOLD has met a good support zone and at present we started to see early signs of bullish interest returning, right after we got a beautiful rejection from the zone.
Currently I’m expecting for the price to bounce to the target near 3,390 . If this bullish push continues with strong volume and momentum, I’ll be locking in that bias and planning my entry accordingly. I could get involved right here for a more aggressive entry. It’s a bit riskier, but if the structure confirms, I’m more than happy to take the shot, as sometimes the best trades come when you trust your setup.
This is not financial advice.

Lingrid | GOLD Retracement Entry Opportunity from Support ZoneOANDA:XAUUSD is attempting to stabilize after breaking below the consolidation zone and forming a new lower low near the 3,313 support. Price action hints at a bullish rebound setup, potentially targeting the 3,375 resistance aligned with the descending red trendline. The structure may shift if price forms a higher low and retests broken support as a springboard.
📈 Key Levels
Buy zone: 3,313 – 3,320
Sell trigger: break below 3,313
Target: 3,375
Buy trigger: higher low and breakout above minor resistance
💡 Risks
Failure to reclaim 3,313 could trigger another sell-off
Resistance trendline near 3,375 remains a rejection risk
Lack of volume confirmation may weaken bullish scenario
If this idea resonates with you or you have your own opinion, traders, hit the comments. I’m excited to read your thoughts!

Lingrid | GOLD Potential Bullish Reversal TradeOANDA:XAUUSD is rebounding from key structure support after forming a double-leg corrective move inside an expanding triangle. Price has reclaimed the 3,324 zone, aligning with the trendline and support confluence, suggesting a short-term bullish bias. If this rebound sustains, gold could retest the 3,380 barrier before eyeing the 3,450 resistance ceiling. A rejection from mid-levels would reintroduce downside pressure toward the 3,246 zone.
📈 Key Levels
Buy zone: 3,320–3,330
Sell trigger: break below 3,324
Target: 3,450
Buy trigger: strong candle close above 3,380
💡 Risks
Weak volume could stall upside continuation
Failure to hold the trendline may drag price toward 3,246
Broader resistance zone between 3,380–3,450 could limit upside momentum
If this idea resonates with you or you have your own opinion, traders, hit the comments. I’m excited to read your thoughts!

GOLD 1H CHART ROUTE MAP UPDATE & TRADING PLAN FOR THE WEEKHey Everyone,
Please see our updated 1h chart levels and targets for the coming week.
We are seeing price play between two weighted levels with a gap above at 3300 and a gap below at 3271. We will need to see ema5 cross and lock on either weighted level to determine the next range.
We will see levels tested side by side until one of the weighted levels break and lock to confirm direction for the next range.
We will keep the above in mind when taking buys from dips. Our updated levels and weighted levels will allow us to track the movement down and then catch bounces up.
We will continue to buy dips using our support levels taking 20 to 40 pips. As stated before each of our level structures give 20 to 40 pip bounces, which is enough for a nice entry and exit. If you back test the levels we shared every week for the past 24 months, you can see how effectively they were used to trade with or against short/mid term swings and trends.
The swing range give bigger bounces then our weighted levels that's the difference between weighted levels and swing ranges.
BULLISH TARGET
3300
EMA5 CROSS AND LOCK ABOVE 3300 WILL OPEN THE FOLLOWING BULLISH TARGETS
3324
EMA5 CROSS AND LOCK ABOVE 3324 WILL OPEN THE FOLLOWING BULLISH TARGET
3354
EMA5 CROSS AND LOCK ABOVE 3354 WILL OPEN THE FOLLOWING BULLISH TARGET
3383
BEARISH TARGETS
3271
EMA5 CROSS AND LOCK BELOW 3354 WILL OPEN THE FOLLOWING BEARISH TARGET
3239
EMA5 CROSS AND LOCK BELOW 3239 WILL OPEN THE SWING RANGE
3213
3179
As always, we will keep you all updated with regular updates throughout the week and how we manage the active ideas and setups. Thank you all for your likes, comments and follows, we really appreciate it!
Mr Gold
GoldViewFX

GOLD → Local bearish trend. Retest of support.FX:XAUUSD is technically looking a little weak. Support is being retested amid de-escalation of geopolitical conflicts in the Middle East. Interest in the metal is waning.
On Friday, gold remains under pressure ahead of data on the core PCE index, a key inflation indicator for the Fed. If inflation turns out to be higher than expected, this could strengthen expectations of a rate cut as early as July, supporting gold. The probability of a July cut is currently estimated at 21%, and 75% for September. Amid dollar volatility caused by rumors of a possible Fed chair replacement and trade negotiations with the EU and China, traders remain cautious, awaiting clarity on inflation and monetary policy
Technically, before falling, gold may form a correction to 3320 (liquidity capture).
Resistance levels: 3320, 3336, 3347
Support levels: 3293, 3271
If the fundamental background remains unchanged and gold continues to decline towards support at 3293 and break through this level, the breakout could lead to a fall to 3271. However, I do not rule out the possibility that after a sharp decline, a correction to 3320 could form before the fall.
Best regards, R. Linda!

GOLD → Attempt to buy back the fall. Uncertainty factorFX:XAUUSD is falling within our expectations. After breaking through the trigger-level of 3340, the price fell to the liquidity zone of 3306. There is uncertainty in the market...
Gold is rising after a false break of support at 3300-3306, interrupting a three-day decline amid a weakening dollar and ongoing tensions in the Middle East. Investors are cautious due to the unstable truce between Iran and Israel, while the decline in USD/JPY after the Bank of Japan's statements and the rise in PPI in Japan are further supporting demand for gold. Powell's comments on the need for caution in monetary policy only temporarily strengthened the dollar. Now the market is focused on US housing data and the second day of Powell's speech
Technically, the price may consolidate at 3306-3347 for some time and only then show us (against the backdrop of the fundamental sentiment that has formed) which direction it will then take
Resistance levels: 3347, 3364, 3372
Support levels: 3319, 3307
The market is trying to buy back the decline. Tuesday's daily session closed with a long shadow, indicating interest in this price range. A pullback to 3320-3310 is possible before growth to 3340-3347.
Best regards, R. Linda!

XAU/USD 4h chart patternXAU/USD (Gold) 4H Chart, the price has clearly broken below the ascending trendline, indicating a bearish structure.
Visual Targets from My Chart:
1. First Target Zone: Around 3,210 - 3,215 USD
2. Second Target Zone: Around 3,130 - 3,135 USD
Price Action Breakdown:
Current Price: Around 3,310 - 3,335 USD
Trendline break confirmed with strong bearish candles
Momentum suggests price is heading towards the first support zone around 3,210
If bearish momentum continues, price may reach the second target around 3,130
Summary:
✅ First Target: 3,210 - 3,215 USD
✅ Second Target: 3,130 - 3,135 USD
If you want precise Fibonacci or support/resistance levels calculated, I can assist further—just let me know!

Lingrid | GOLD Bear Channel Break: Short OpportunityOANDA:XAUUSD has broken down from the upward channel and is now trading below the key 3,321 level, which previously served as support. The price is forming a bearish structure beneath the black and blue trendlines, with 3,250 emerging as the next potential target. A minor relief bounce could retest 3,320, but rejection here would reinforce downside continuation.
📈 Key Levels
Sell zone: 3,315–3,330
Sell trigger: rejection below 3,321
Target: 3,250
Sell confirmation: breakdown from 3,285 with momentum
💡 Risks
False breakout above 3,321 could trap sellers
Weak bearish momentum may result in sideways chop
Re-entry into channel could negate bearish outlook
If this idea resonates with you or you have your own opinion, traders, hit the comments. I’m excited to read your thoughts!

Why the Best Strategies Don’t Last — A Quant TruthOver the years, I’ve built strong connections with traders on the institutional side of the market.
One of the most interesting individuals I met was a former trader at Lehman Brothers. After the collapse, he transitioned into an independent quant. I flew to Boston to meet him, and the conversations we had were eye-opening, the kind of insights retail traders rarely get exposed to.
We didn’t talk about indicators or candlestick patterns.
We talked about how fast and aggressive algorithmic trading really is.
He told me something that stuck:
" People think hedge funds build one algorithm, run it for years, and collect returns. That’s rarely the case. Most algos are extremely reactive. If something stops working, we don’t fix it — we delete it and move on. That’s how the process works."
This isn’t an exception — it’s standard practice.
What stood out most in our talks was how adaptable these algorithms are. If market conditions shift — even slightly — the logic adapts immediately. These systems aren’t built on beliefs or opinions.
They’re built to respond to liquidity, volatility, and opportunity — nothing more.
This level of responsiveness is something most retail traders never factor into their approach, but it’s core to how modern markets operate.
█ How Quant Funds Use Disposable Strategies — And What Retail Can Learn
One of the most misunderstood realities in modern trading is how top quantitative funds like Two Sigma, Citadel, and Renaissance Technologies deploy, monitor, and replace their strategies.
Unlike traditional investors who develop a strategy and stick with it for years, many quant funds take a performance-first, outcome-driven approach. They:
Build hundreds of strategies,
Deploy only the ones that currently work, and
Retire or deactivate them the moment performance drops below their internal thresholds.
This is a deliberate, statistical, and unemotional process — and it's something that most retail traders have never been taught to think about.
█ What This Means
Quantitative firms often run:
100s of models simultaneously,
Each targeting a specific edge (e.g. trend-following, mean reversion, intraday order flow),
With tight risk controls and performance monitoring.
When a model:
Falls below a minimum Sharpe ratio (risk-adjusted return),
Starts underperforming vs benchmark,
Experiences a breakdown in statistical significance…
…it is immediately deprecated (removed from deployment).
No ego. No "fixing it."
Just replace, rebuild, and redeploy.
█ It runs live… until it doesn’t.
If slippage increases → they pull it.
If volatility regime changes → they pull it.
If too many competitors discover it → they pull it.
If spreads tighten or liquidity dries → they pull it.
Then? They throw it away, rebuild something new — or revive an old one that fits current conditions again.
█ Why They Do It
⚪ Markets change constantly
What worked last month might not work this week — due to regime shifts, volatility changes, or macro catalysts. These firms accept impermanence as part of their process.
⚪ They don’t seek universal truths
They look for temporary edges and exploit them until the opportunity is gone.
⚪ Risk is tightly controlled
Algorithms are judged by hard data: drawdown, volatility, Sharpe ratio. The moment a strategy fails to meet these metrics, it’s shut off — just like any risk engine would do.
⚪ They don’t fix broken models — they replace them
Time spent “tweaking” is time lost. New strategies are always in the pipeline, ready to rotate in when older ones fade.
█ Research & Real-World Validation
"Modern quantitative funds must prioritize real-time adaptability and accept that any statistical edge has a short shelf life under competitive market pressures." Adaptive Trading Agents” (Li, 2023)
Donald MacKenzie’s fieldwork on HFT firms found that algos are treated like disposable tools, not long-term investments.
Studies on adaptive algorithmic trading (e.g., Li, 2023; Bertsimas & Lo, 1998) show that funds constantly evaluate, kill, and recycle strategies based on short-term profitability and regime changes.
A former Two Sigma quant publicly shared that they regularly deploy hundreds of small-scale models, and once one fails risk thresholds or decays in Sharpe ratio, it’s immediately deprecated.
Walk-forward optimization — a method used in quant strategy design — is literally built on the principle of testing a strategy in live markets and discarding it if its forward performance drops.
█ Why Retail Rarely Hears This
Retail traders are often taught to:
“Stick with a system”
“Backtest 10 years”
“Master one setup”
But in the real quant world:
There is no perfect system. There are only edges that work until they don’t. And the moment market structure shifts — new volatility, different volume profile, regime change — the strategy is gone, no questions asked.
█ What This Means for Retail Traders
⚪ Don’t idolize “one perfect system.”
What worked in April might not work in June. Treat your strategies as temporary contracts, not lifelong beliefs.
⚪ Build modular logic.
Create systems you can tweak or retire quickly. Test new regimes. Think in frameworks, not fixed ideas.
⚪ Learn from regime shifts.
Volatility, spread, volume profile, macro tone — track these like a quant desk would.
⚪ Use metrics like:
- Win streak breakdown
- Market regime tracker
- Edge decay time (how long your setups last)
█ Final Thought
The best traders — institutional or retail — understand that there’s no such thing as a permanent edge. What matters is:
Having a repeatable process to evaluate strategy performance,
Being willing to shut off or rotate out what’s no longer working,
And staying adaptable, data-driven, and unemotional.
If you start treating your strategies like tools — not identities — you’ll begin operating like a professional.
-----------------
Disclaimer
The content provided in my scripts, indicators, ideas, algorithms, and systems is for educational and informational purposes only. It does not constitute financial advice, investment recommendations, or a solicitation to buy or sell any financial instruments. I will not accept liability for any loss or damage, including without limitation any loss of profit, which may arise directly or indirectly from the use of or reliance on such information.
All investments involve risk, and the past performance of a security, industry, sector, market, financial product, trading strategy, backtest, or individual's trading does not guarantee future results or returns. Investors are fully responsible for any investment decisions they make. Such decisions should be based solely on an evaluation of their financial circumstances, investment objectives, risk tolerance, and liquidity needs.

GOLD ROUTE MAP UPDATEHey Everyone,
Another smashing day on the charts with our levels being respected perfectly inline with our plans to buy dips.
After completing our bearish 3348 and bullish 3376 target we had the cross and lock above 3376 leaving a gap to 3395, which fell short just by few pips.
We then had the cross and lock below 3348 opening the swing range, which was also hit perfectly. We got the perfect bounce, just like we analysed allowing us to buy dips and now seeing the swing range carry out the move. We will see if this is completed for the full swing range 3348.
We will keep the above in mind when taking buys from dips. Our updated levels and weighted levels will allow us to track the movement down and then catch bounces up.
We will continue to buy dips using our support levels taking 20 to 40 pips. As stated before each of our level structures give 20 to 40 pip bounces, which is enough for a nice entry and exit. If you back test the levels we shared every week for the past 24 months, you can see how effectively they were used to trade with or against short/mid term swings and trends.
The swing range give bigger bounces then our weighted levels that's the difference between weighted levels and swing ranges.
BULLISH TARGET
3376 - DONE
EMA5 CROSS AND LOCK ABOVE 3376 WILL OPEN THE FOLLOWING BULLISH TARGETS
3395
EMA5 CROSS AND LOCK ABOVE 3395 WILL OPEN THE FOLLOWING BULLISH TARGET
3419
EMA5 CROSS AND LOCK ABOVE 3419 WILL OPEN THE FOLLOWING BULLISH TARGET
3440
BEARISH TARGETS
3348 - DONE
EMA5 CROSS AND LOCK BELOW 3348 WILL OPEN THE SWING RANGE
3330 - DONE
3306 - DONE
EMA5 CROSS AND LOCK BELOW 3306 WILL OPEN THE SECONDARY SWING RANGE
3288
3271
As always, we will keep you all updated with regular updates throughout the week and how we manage the active ideas and setups. Thank you all for your likes, comments and follows, we really appreciate it!
Mr Gold
GoldViewFX

GOLD → Risk zone 3340. Sell-off after rallyFX:XAUUSD , after breaking out of its accumulation phase, rallied towards the 3400 zone of interest, but failed to reach liquidity and reversed, selling off its gains due to economic uncertainty.
In my opinion, the market is unexpectedly subdued and has reacted very weakly to geopolitical problems in the Middle East. The market has digested the news of US airstrikes on Iranian nuclear facilities and is awaiting PMI data from the US and the eurozone, Fed statements, US GDP and other macroeconomic data. The uncertainty factor has done its job... Participants fear further escalation of the conflict, but so far Iran has refrained from taking drastic steps, which has reduced demand for gold as a safe haven asset. Geopolitics and macro statistics remain in focus.
Technically, gold is trading above 3340 (in the buy zone). A retest of the liquidity zone is possible, and if buyers keep the market above 3340-3350, the price may continue to rise.
Support levels: 3347, 3342, 3320
Resistance levels: 3366, 3396
On D1, the key level is the 3340-3347 area. At the moment, we are seeing a sell-off and a move to retest support. Accordingly, a false breakdown and price holding above 3340, followed by a change in character and a breakdown of the bullish structure, will hint at growth. But if the reaction at 3340 is weak and the market continues to storm this support, then in this case, the metal could drop to 3300
Best regards, R. Linda!

XAUUAD Reversal Setup Short Trade Opportunity Below Resistance Current Price: 3,327.56 USD
Entry Point: 3,332.67 USD
Stop Loss: 3,342.45 USD
Take Profit Levels:
Target 1 (Downside): 3,294.45 USD (-1.17%)
Target 2 (Upside): 3,393.78 USD (+1.50%)
🔧 Technical Indicators & Tools
Trade Line: Upward sloping trendline connecting higher lows, supporting recent bullish structure.
Moving Averages:
Red: Short-term (likely 50-period EMA)
Blue: Long-term (likely 200-period EMA)
Price is still trading below the long-term MA, suggesting broader bearish pressure.
Resistance Zone: 3,334.96–3,341.30 — a key supply area marked in purple.
Support Zone: 3,294.45 — identified as a previous demand level.
⚖️ Risk-Reward Analysis
Short Setup:
Entry: 3,332.67
Stop Loss: 3,342.45 (Risk ~10 USD)
Target: 3,294.45 (Reward ~38 USD)
R:R Ratio ≈ 1:3.8, which is favorable for a short trade.
📌 Summary
Bias: Bearish intraday
Setup Type: Short-sell at resistance zone
Confirmation: Price rejection or bearish candle near 3,334–3,342 zone
Invalidation: Break and close above 3,351.06 (upper resistance)

Gold may bounce up from support line of channel to 3330 pointsHello traders, I want share with you my opinion about Gold. Previously, the price broke out of a symmetrical triangle and moved confidently toward the seller zone. However, it failed to consolidate there and formed a downward channel, where price action has remained since. The movement inside this channel has been consistent, respecting both the resistance and support lines. After reaching the lower boundary, the price bounced up and approached the resistance area (3290 - 3300), which now acts as a key short-term obstacle. This zone was tested multiple times and served as support earlier, making it a strong technical level. Currently, the price is trading just below this zone and forming a base for the next move. I expect a possible retest of the support line of the downward channel, which may provide the impulse needed for a new upward move. In my opinion, the price will rebound from the bottom of the channel and start to grow toward the current resistance level at 3300. If this level is broken and confirmed via a retest, I expect continued movement toward the channel’s upper resistance line. That’s why I set my TP 1 at 3330 points, right near the resistance line of the channel. Please share this idea with your friends and click Boost 🚀
Disclaimer: As part of ThinkMarkets’ Influencer Program, I am sponsored to share and publish their charts in my analysis.

Lingrid | GOLD Weekly Analysis: Risk-Off Trade Unwinds OANDA:XAUUSD endured another challenging week as the Iran-Israel ceasefire continued to diminish safe-haven demand, while robust equity market performance drew capital away from precious metals. The risk-on environment has fundamentally shifted investor priorities, with growth assets overshadowing traditional defensive plays like gold.
The chart reveals gold testing the crucial $3,270 support zone, representing a significant confluence level where the upward trendline intersects with horizontal support. This area has historically provided strong buying interest and serves as a critical inflection point for gold's medium-term direction.
From a broader perspective, the 4H chart shows gold approaching the lower boundary of its established upward channel around $3,250. The pullback from the HH near $3,450 has accelerated through multiple support levels, with the downward trendline acting as dynamic support to any recovery attempts.
A decisive break below the $3,235 - $3,250 support confluence could trigger further selling toward the $3,200 major support zone. However, the long-term upward trendline dating back several months provides substantial technical backing. A successful defense of current levels would likely attract value buyers and could spark a relief rally toward the $3,330-$3,350 resistance area, particularly if geopolitical tensions resurface or equity markets show signs of fatigue.
If this idea resonates with you or you have your own opinion, traders, hit the comments. I’m excited to read your thoughts!

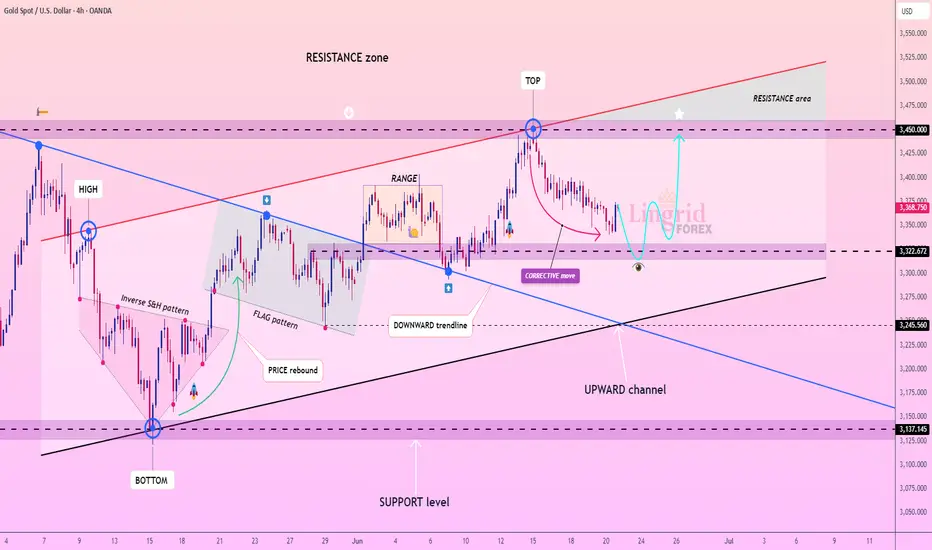
Lingrid | GOLD Weekly Outlook: Corrective Phase Tests SupportOANDA:XAUUSD experienced a notable pullback this week, retreating from the $3,450 resistance zone as profit-taking emerged following the recent geopolitical rally. The market appears to be entering a healthy corrective phase after the strong upward momentum driven by Middle Eastern tensions and safe-haven demand.
The 4H chart reveals gold testing the critical $3,320 support level, which coincides with the lower boundary of the established upward channel. This corrective move was anticipated after the sharp rally to the resistance area marked as "TOP" on the chart. The current price action suggests a natural retracement within the broader bullish structure.
Technically, the downward trendline from the recent high is being respected, indicating the correction may continue toward the $3,240-$3,270 range before finding stronger support. The flag pattern that previously drove the rally now serves as a reference point for this pullback phase.
Key levels to monitor include the $3,320 immediate support and the more substantial $3,200 level below. A decisive break below these supports could extend the correction further, while a bounce from current levels would reinforce the underlying bullish bias. The market remains within the broader upward channel, suggesting this correction is likely temporary before the next leg higher toward the resistance zone above $3,450.
Traders, if you liked this idea or if you have your own opinion about it, write in the comments.
Gold (XAU/USD) Bearish Trade Setup – June 27, 2025Entry Point: Around 3,300.98 USD
Stop Loss (SL): ~3,312.20 USD
Take Profit (TP): 3,229.33 USD
Current Price: 3,286.15 USD
Risk-Reward Ratio: ~1:6.3
(Potential reward ≈ 71.65 pts; risk ≈ 11.22 pts)
Technical Breakdown:
Trend:
The price is in a short-term downtrend, supported by:
Lower highs and lower lows.
Price trading below both 50 EMA (red) and 200 EMA (blue), confirming bearish momentum.
Bearish Breakout:
Price broke below a key support-turned-resistance zone near 3,300–3,302, triggering sell pressure.
Resistance Area:
Strong rejection at 3,302–3,312 zone, which is now acting as resistance.
SL is placed just above this zone to protect against false breakouts.
Target Zone:
TP set at 3,229.33, aligning with a previous support zone — a logical area for price to react.
Strategy Notes:
Bias: Bearish
Entry confirmation: Already triggered.
Risk Management: SL placement is tight and strategic; RR ratio is highly favorable.
Next support below TP: If 3,229 breaks, further downside could follow.
Summary:
This setup shows a well-defined bearish continuation with a clean break of support, a controlled SL above resistance, and a strong RR ratio. A suitable trade for trend-following strategies, but price must not retrace above 3,312 for this idea to remain valid.

THE KOG REPORTTHE KOG REPORT:
In last week’s KOG Report we said we would be looking for price to attempt that higher level and potentially break for higher pricing. If it didn’t the path showed the level for an opportunity to short which fell just short but worked well into the level we initially wanted.
We then published the red box targets and the bias through the week which held, and we managed to complete all bearish targets by Friday.
Was it easy? No! Did we expect that flush? No! We simply got to a stage on Friday where we could only watch or get in with the volume, so we stood back and just watched.
So, what can we expect in the week ahead?
Simple one this week. We can see potential for lower, however, we’re too low to attempt shorting this, especially with the key level 3250-55 just below and major support. For that reason, we published the red boxes to help you all, look for the break either side! Ideally, we want to support on the low from the open and then continue with the move upside into the 3280-85 level initially, which should flip us on the support at 3270-75. We could range there as there is no news tomorrow but a gradual incline is what we’re looking for.
Support 3250-55 needs to break for lower, while resistance 3306-10 is the level that needs to break to go higher. That’s our potential range for now.
KOG’s bias for the week:
Bullish above 3250 with targets above 3278, 3285, 3297 and above that 3306
Bearish below 3250 with targets below 3240, 3232, 3220 and below that 3212
RED BOX TARGETS:
Break above 3275 for 3279, 3285, 3289 and 3306 in extension of the move
Break below 3260 for 3255, 3251, 3240 and 3235 in extension of the move
Please do support us by hitting the like button, leaving a comment, and giving us a follow. We’ve been doing this for a long time now providing traders with in-depth free analysis on Gold, so your likes and comments are very much appreciated.
As always, trade safe.
KOG

GOLD ROUTE MAP UPDATEHey Everyone,
A PIPTASTIC day on the markets with our analysis playing out in true level to level fashion.
Yesterday we stated that that we had the cross and lock below 3348 opening the swing range, which was hit perfectly and gave the bounce and that we will now wait to see if the full swing is completed to 3348.
- This was played out to perfection with the full swing completed into 3348. No further lock above confirmed the rejection back into the swing range.
We will continue to buy dips using our support levels taking 20 to 40 pips. As stated before each of our level structures give 20 to 40 pip bounces, which is enough for a nice entry and exit. If you back test the levels we shared every week for the past 24 months, you can see how effectively they were used to trade with or against short/mid term swings and trends.
The swing range give bigger bounces then our weighted levels that's the difference between weighted levels and swing ranges.
BULLISH TARGET
3376 - DONE
EMA5 CROSS AND LOCK ABOVE 3376 WILL OPEN THE FOLLOWING BULLISH TARGETS
3395
EMA5 CROSS AND LOCK ABOVE 3395 WILL OPEN THE FOLLOWING BULLISH TARGET
3419
EMA5 CROSS AND LOCK ABOVE 3419 WILL OPEN THE FOLLOWING BULLISH TARGET
3440
BEARISH TARGETS
3348 - DONE
EMA5 CROSS AND LOCK BELOW 3348 WILL OPEN THE SWING RANGE
3330 - DONE
3306 - DONE
EMA5 CROSS AND LOCK BELOW 3306 WILL OPEN THE SECONDARY SWING RANGE
3288
3271
As always, we will keep you all updated with regular updates throughout the week and how we manage the active ideas and setups. Thank you all for your likes, comments and follows, we really appreciate it!
Mr Gold
GoldViewFX

Gold: A Bearish Outlook - Another Point of ViewGold: A Bearish Outlook - Another Point of View
Since yesterday, gold has not moved much despite the situation in the Middle East looking calm and stable for the moment.
In a normal market, gold should have started another downward wave, given that a ceasefire was reached between the influential countries and a war that could have lasted for years given their military arsenal.
Yesterday, Federal Reserve Chairman Powell testified for the second day and his comments were aggressive, despite being provoked by many of Trump's supporters with very aggressive tones. This was probably one reason why the US dollar did not show strength.
However, gold is a safe-haven asset and if it is to respect its status, chances are it will fall further, at least as a profitable moment, because all the important events have ended so far. It could create a possible reversal from the current area as shown in the chart.
Key downside targets: 3314.50, 3300, 3285, and 3270.
You may find more details in the chart!
Thank you and Good Luck!
❤️PS: Please support with a like or comment if you find this analysis useful for your trading day❤️

XAU/USD Reversal Signal Bullish Momentum: Targeting 3337The XAU/USD 15-minute chart indicates a strong bullish reversal after price action bounced from the key support zone near 3302. A clear breakout from the descending channel signals that bearish momentum has faded. Price is now trading above the Ichimoku cloud, reinforcing the shift in short-term sentiment. This move is supported by strong bullish candles and rising momentum, suggesting buyers have regained control. The price has also broken a key intraday resistance level, opening the door for further upside. The projected move targets the upper resistance zone around 3377, as marked on the chart. With favourable risk-to-reward and confirmation from technical indicators, this setup aligns well with a bullish intraday trade.
Entry Point: 3330
Target Point: 3377
