Analysis for the next week (XAUUSD) Hello Traders, Happy Weekend.
The market is going to open tonight, As you see the down trend is running, the price is falling like a waterfall.
Now the market is on the support area according to H1 & H4 TimeFrame.
The market is respecting the support area and there is a Trend line support according to D1 TimeFrame.
The market is respecting the Trend line and support area.
According to my analysis gold will drop till 3287 to 3271.
If gold fly, it can fly till 3350 then it will fall.
Stay tune for update.
Kindly share your views and leave positive comments here, Thanks.
XAUUSD trade ideas

SMART MONEY CONCEPT (SMC)Bearish Analysis – Market Structure
1: Market Context
• The price was coming from a strong bullish structure that had already mitigated the last remaining interest in the 4H OB.
• A key resistance zone was formed where institutional investors closed buy orders.
• The bullish momentum left a Fair Value Gap in 1H, which has not yet been mitigated.
2: Shift Signals
• A fake out (false breakout) was observed above the resistance, followed by a Change of Character (Choch).
• This indicates liquidity absorption and the possible start of a bearish phase.
• Distribution structure confirmed before the bearish momentum.
3:Entry Plan and Target
• Entry (Sell): In the upper zone after the 4H OB retest/resistance.
• Stop Loss: Above the fake out wick (invalidation zone).
• Take Profit: Around 3305, seeking to mitigate the FVG-1H and reach the previous support zone.
• RR: High (favorable for swing or scalping with partials).
4:Confirmation and Management
• Wait for confirmation on a lower timeframe (5M / 1M) before executing the entry.
• Watch for a possible last liquidity grab before falling.
• Manage with partials and move the SL to BE when the halfway point is exceeded.
GOOD LUCK TRADERS…

GOLD | Gold Eyes Pivot at 3347 – NY Session Close KeyGOLD | Gold Eyes Pivot at 3347 – NY Session Close Key
🕯Gold slipped slightly on Tuesday due to a stronger dollar, but remains close to a two-week high amid growing expectations of a U.S. rate cut in September.
⏺ Price has begun to retreat from the 3380 resistance, now heading toward the pivot level at 3347.
We’re watching for a potential reversal from 3347, especially if a 4H candle closes above this level during the New York session — this could trigger a bullish recovery toward 3365, and possibly retest 3380.
⏺ A confirmed breakout above 3380 would open the path for further upside toward 3402, but only if strong momentum is sustained.
If price closes below 3347 on the 1H, and this is confirmed by a 4H candle, it would likely reactivate bearish pressure toward the 3320 support.
• Resistance: 3365 – 3380 – 3402
• Support: 3320 – 3313

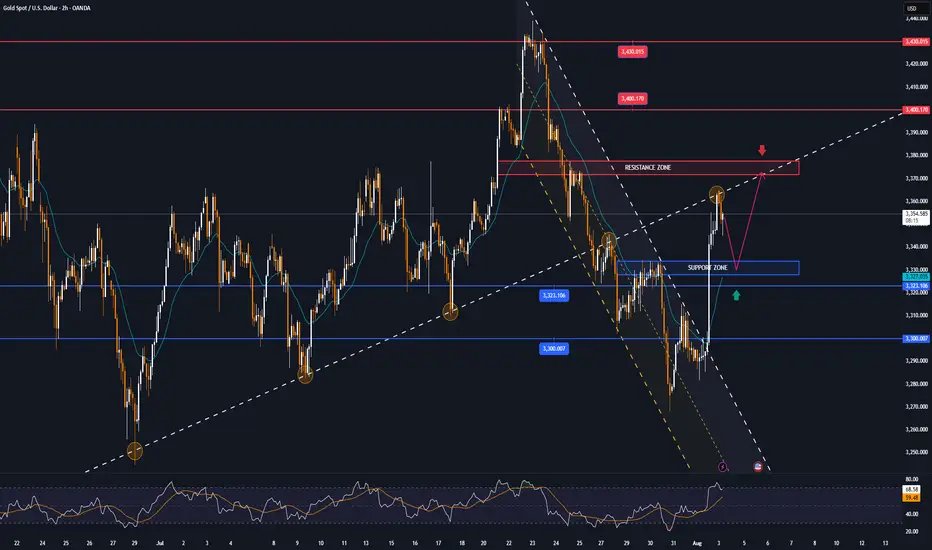
Gold can reach resistance area and then continue to fallHello traders, I want share with you my opinion about Gold. Over an extended period, the price action of Gold has been contained within a large descending triangle, a pattern characterized by a series of lower highs testing a descending resistance line and a relatively flat support base. The major seller zone around the 3415 resistance level has consistently capped upward rebounds, establishing a clear downward pressure on the asset. The most critical recent development has been a decisive breakdown, where the price broke below a key ascending trend line and, more importantly, below the horizontal support at 3310. This structural break has shifted the immediate market dynamics, turning the former support area of 3310 - 3320 into a new ceiling of resistance. The primary working hypothesis is a short scenario based on the principle of a breakdown and retest. It is anticipated that the price will attempt a corrective rally back towards this new resistance area around 3310. A failure to reclaim this level, confirmed by a strong rejection, would validate the breakdown and signal the continuation of the larger downward trend. Therefore, the tp for this next bearish leg is logically placed at the 3240 level. This target represents a significant area of potential support and a measured objective following the resolution of the recent consolidation. Please share this idea with your friends and click Boost 🚀
Disclaimer: As part of ThinkMarkets’ Influencer Program, I am sponsored to share and publish their charts in my analysis.

Gold Eliot analysis My predictions about gold in previous years have been quite accurate and calculated. Currently, I think a wave 4 correction, which is a micro-wave, is taking place. As we can see, this micro-wave will probably decrease between $2,700 and $3,000 and then advance to targets above $4,000. Majid Babaei Tehran August 1404

XAUUSD - 4/8/25Theres alot happening that is influencing Gold. But just following the market structure, we see a HTF BoS towards more bearish action. However friday's news did bring a big push up with huge imbalance in the Dollar as well as Gold.
I identified the zone that broke structure above and looking for price to touch this zone before going back down to take out any imbalance. t
The current TP is quite way down at the moment targeting the HTF equal low liquidity, but I will trail my SL.
if this Zone that broke structure is taken out then my bias will shift to bullish trades to retest the ATH.

XAUUSD Short 2nd EntryElite Analysis
XAUUSD 2nd Entry
Same analysis as before
All rules confirmed
Targeting lower liquidity pools

Gold holds its bullish momentum - Strategy 1000 pips ? Hello everyone, what do you think about gold prices?
Yesterday, gold ended the session near the key psychological level of 3,400 USD. Overall, the metal remains in a short-term uptrend.
Some immediate supporting factors include:
-Concerns about the US economy – The Fed may soon have to cut interest rates, weakening the USD and making gold more attractive.
-Geopolitical uncertainty – Trade tensions between the US and India over Russian oil imports are prompting investors to turn to gold.
-Financial market volatility – Global equities show signs of a pullback after a strong rally, driving defensive capital flows into gold to reduce portfolio risk.
From a technical perspective: XAUUSD is maintaining a steady upward trend after breaking out of its previous down channel and forming a Rising Wedge pattern. On the chart, prices are consistently creating higher highs and higher lows, with the range narrowing over time — a sign that the market is consolidating before a potential breakout.
Currently, the lower boundary of the wedge is acting as support. If prices hold above this level, the primary scenario remains a move higher toward the 3,433 to 3,450 USD resistance zone. Conversely, if the wedge’s support is broken, the price could retrace to 3,350 USD before the uptrend resumes.
And you — what’s your view on XAUUSD’s next move? Share your thoughts in the comments!

Gold is set for a major crash!Are you ready for bearish trend of Gold?
After touching upper line of channel, Gold is ready for starting bearish trend.

After data shock, GOLD has bullish conditions againOANDA:XAUUSD rose more than 2% on Friday, hitting a one-week high, as weaker-than-expected U.S. non-farm payrolls data boosted hopes of a Federal Reserve rate cut and the announcement of new tariffs boosted safe-haven demand.
On the economic data front
Gold prices rose more than 2% in U.S. trading on Friday (Aug. 1), hitting a one-week high, as weaker-than-expected U.S. non-farm payrolls data fueled hopes of a Federal Reserve rate cut and safe-haven demand was boosted by the announcement of new tariffs.
The U.S. Department of Labor's Bureau of Labor Statistics reported that nonfarm payrolls increased by just 73,000 jobs in July, well below market expectations of 110,000. June's data was revised down to just 14,000, indicating a significant slowdown in job growth. The unemployment rate rose to 4.2%, indicating a cooling labor market.
The jobs data was weaker than expected, but slightly higher than the market's lowest forecast. This increases the likelihood of a rate cut by the Fed later this year. As a non-yielding asset, gold typically performs better in a low-interest-rate environment.
According to CME Group's FedWatch tool, market participants now expect the Federal Reserve to cut rates twice before the end of the year, starting in September. Earlier this week, the Fed held rates steady at 4.25%-4.50%. Chairman Powell said it was too early to determine whether a rate cut would be forthcoming in September, citing inflation and employment data.
On the trade front
Trump has imposed a new round of tariffs on exports from dozens of trading partners, including Canada, Brazil, India and Taiwan, causing a global market crash.
Countries are scrambling to negotiate a better deal. In times of economic and geopolitical uncertainty, safe-haven gold is in high demand.
So far in 2025, gold prices have risen more than $400, hitting a record high of $3,167.57/oz on April 3, driven by safe-haven demand and central bank buying.
Weak jobs data also sent the dollar lower against major currencies, further supporting gold prices as a weaker greenback makes gold more attractive to investors holding other currencies.
Investors' Attention Turns to September FOMC Meeting
Markets are now focused on the September Federal Open Market Committee (FOMC) meeting. Facing the dual pressures of volatile inflation, slowing employment and escalating global trade tensions, the Fed will have to balance its inflation target with economic growth.
Markets are betting on the Fed to begin a new round of easing, and gold, as a hedge against currency devaluation and economic uncertainty, is expected to continue to benefit.
Gold prices have risen more than 30% year-to-date, reflecting the market’s preference for safe-haven assets. If weak U.S. economic data continues in the coming weeks, or if new geopolitical conflicts emerge, gold prices are expected to continue their upward trend, challenging new highs for the year.
Summary, Commentary
Weak employment, new tariffs and a slumping stock market have all contributed to a strong recovery in gold prices. With the possibility of the US Federal Reserve cutting interest rates in September increasing significantly, gold market sentiment has warmed and risk aversion has returned.
Investors will need to keep a close eye on inflation data, Fed officials’ speeches, and whether Trump continues to stoke trade tensions, which could lead to greater volatility in the gold market.
Against the backdrop of the unexpected non-farm payrolls report and moderate inflation, the market has essentially “locked in” the possibility of a rate cut in September, but whether the cut will be 25 or 50 basis points, and whether there will be further rate cuts in the future, will depend on the interaction between the Fed members’ verbal guidance and market expectations.
Technical Outlook Analysis OANDA:XAUUSD
On the daily chart, affected by the sudden weak data that shocked the market, gold broke most of the technical structure that was leaning towards the downside. Price action was pushed above the EMA21, while the short-term downtrend channel was also broken above and the Relative Strength Index crossed above 50.
These are the initial conditions for a short-term uptrend. But to confirm an uptrend and a new uptrend in the near term, gold needs to continue to break above the 0.236% Fibonacci retracement level (3,371 USD) first, then the target will be around 3,400 USD in the short term.
If gold breaks above $3,400 again, traders should set a new target of $3,430 in the short term, rather than $3,450 which is the all-time high.
Motivationally, the RSI has not reached oversold territory to provide pure reversal support, but it has been pushed by the market shock after the NFP data release, so this rally may not be sustainable in a purely motivational way either.
Overall, gold is now more bullish after a rally on Friday, opening up initial conditions for expectations of a new uptrend. And the notable points will be listed as follows.
Support: 3,323 – 3,310 – 3,300 USD
Resistance: 3,371 – 3,400 – 3,430 USD
SELL XAUUSD PRICE 3376 - 3374⚡️
↠↠ Stop Loss 3380
→Take Profit 1 3368
↨
→Take Profit 2 3362
BUY XAUUSD PRICE 3327 - 3329⚡️
↠↠ Stop Loss 3323
→Take Profit 1 3335
↨
→Take Profit 2 3341
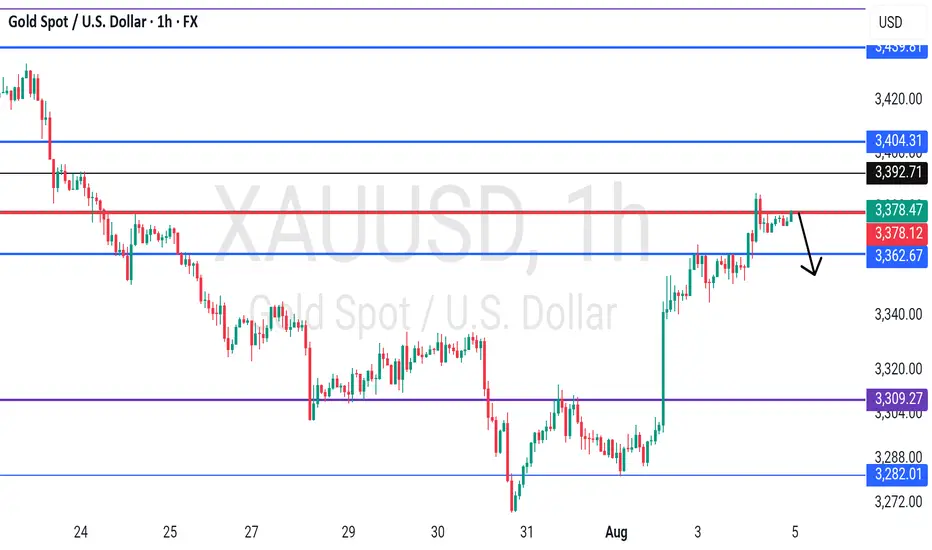
GOLD - at resistance ? Whats next ??#GOLD... market just reached at his current resistance area and that is 3378-79
Keep close and if market holds the cdrop expected from here.
Good luck
Trade wisely
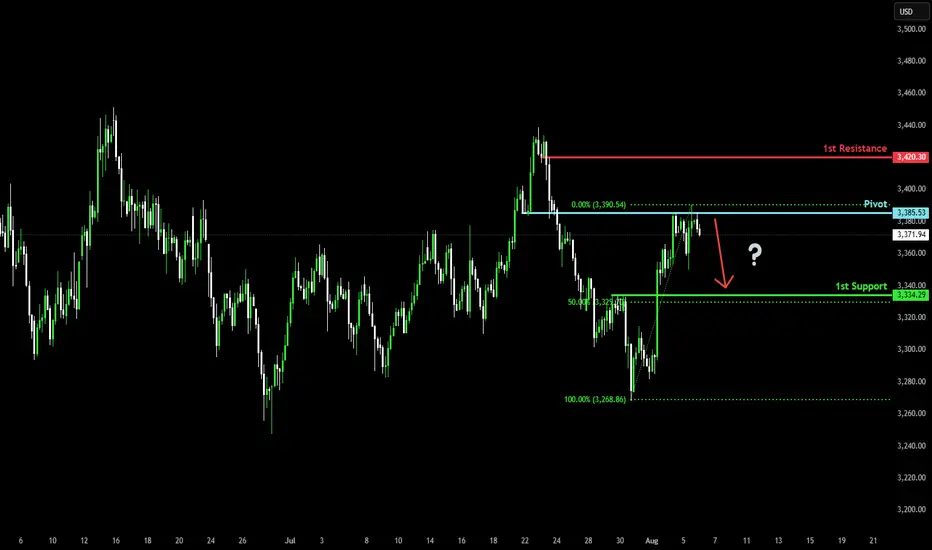
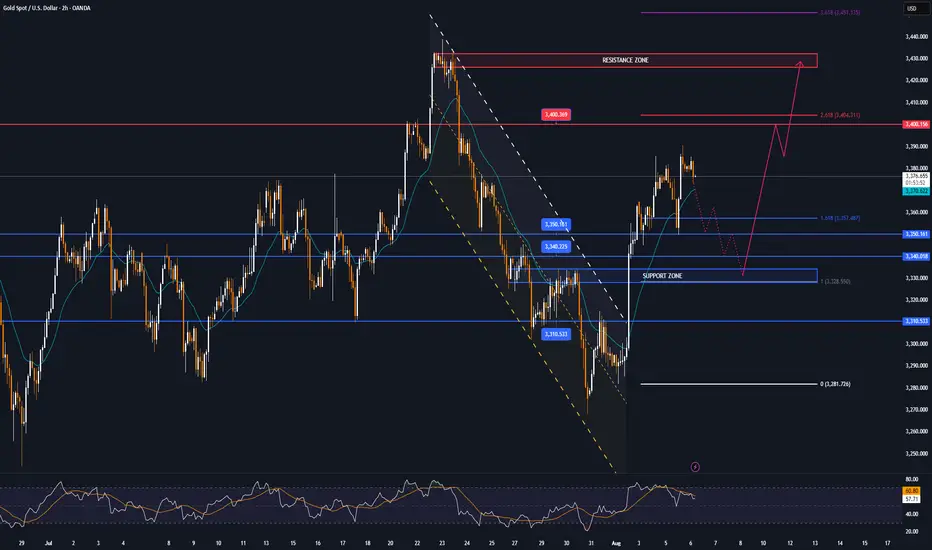
Bearish drop for the Gold?The price has rejected off the pivot which has been identified as a pullback resistance and could drop to the 50% Fibonacci support.
Pivot: 3,385.53
1st Support: 3,334.29
1st Resistance: 3,420.30
Risk Warning:
Trading Forex and CFDs carries a high level of risk to your capital and you should only trade with money you can afford to lose. Trading Forex and CFDs may not be suitable for all investors, so please ensure that you fully understand the risks involved and seek independent advice if necessary.
Disclaimer:
The above opinions given constitute general market commentary, and do not constitute the opinion or advice of IC Markets or any form of personal or investment advice.
Any opinions, news, research, analyses, prices, other information, or links to third-party sites contained on this website are provided on an "as-is" basis, are intended only to be informative, is not an advice nor a recommendation, nor research, or a record of our trading prices, or an offer of, or solicitation for a transaction in any financial instrument and thus should not be treated as such. The information provided does not involve any specific investment objectives, financial situation and needs of any specific person who may receive it. Please be aware, that past performance is not a reliable indicator of future performance and/or results. Past Performance or Forward-looking scenarios based upon the reasonable beliefs of the third-party provider are not a guarantee of future performance. Actual results may differ materially from those anticipated in forward-looking or past performance statements. IC Markets makes no representation or warranty and assumes no liability as to the accuracy or completeness of the information provided, nor any loss arising from any investment based on a recommendation, forecast or any information supplied by any third-party.
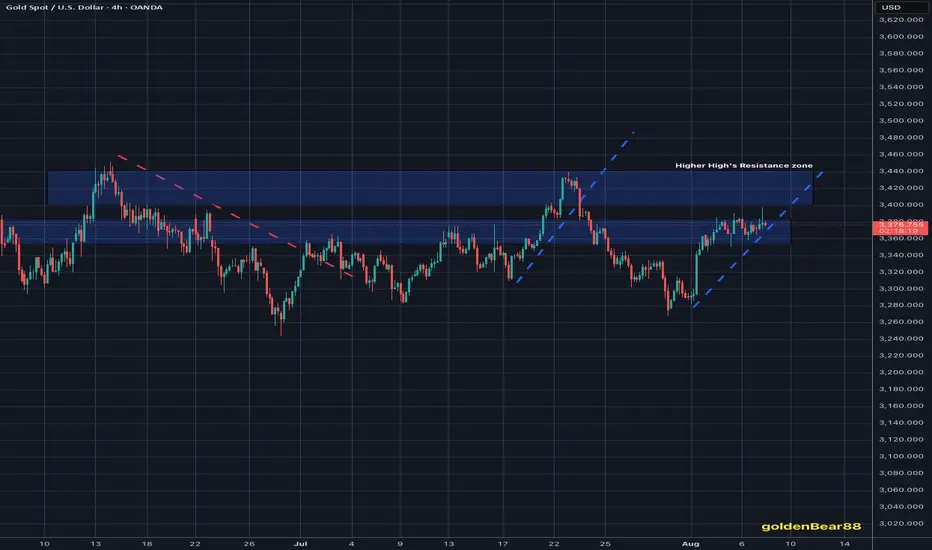
Gold extending Buying sequenceAs discussed throughout my Tuesday's session commentary: "My position: I will keep Buying every dip on Gold from my key entry points / #3,357.80 is one of them expecting final push above the Resistance zone towards #3,400.80 benchmark."
If you have been Buying every dip as per my suggestion you would be in excellent Profits now. I have been Buying Gold from my #3,357.80, #3,367.80, #3,372.80 and #3,378.80 key entry points (last batch of Buying orders closed with Target late U.S. - early Asian session last night).
Technical analysis: Gold is under unprecedented Volatility (however with Bullish underlying trend) with Gold (Xau-Usd Spot) and the Futures price on a tight spread. This is of course the product of heavy speculation in the Metals market, fuelled by the expectation that the Fed’s new talks will be accepted. Needless to mention, this environment is Gold friendly. Technically I do see current aggressive decline in form of a correction as not sustainable however I cannot approach current configuration Technically since these are Fundamentally driven sessions but I do expect a slight pullback back towards #3,352.80 - #3,357.80 only for Gold to soar even more, as the main Support and Higher High’s High’s / Low’s cluster is nearby (#3,357.80 - #3,367.80). Despite Bond Yields stabilization, the continuous Low’s on DX on parabolic decline are adding Buying pressure on Gold and limiting all Selling advance which I am utilizing to it's maximum with my set of Buying orders.
10 POWERFUL INVESTING & TRADING QUOTES OF ALL TIME
Here are powerful quotes of professional traders, investors and experts in financial markets.
Let their words inspire you and help you in your trading journey.
"To succeed in the market, you must learn to think like everyone else and do the opposite." - Sir John Templeton 📈💭💡
"The four most dangerous words in investing are: 'This time it's different.'" - Sir John Templeton ⏳📉🛑
"The more you learn, the more you earn." - Warren Buffett 📚💰📈
"The key to trading success is emotional discipline. If intelligence were the key, there would be a lot more people making money." - Victor Sperandeo. 💪💰🚫🧠
"Investing is not about making predictions, it's about having a plan and sticking to it." - Tony Robbins 📊🔄📌
"The best time to buy a stock is when the blood is running in the streets." - Baron Rothschild 💀🔪💰
"The best investment you can make is in yourself." - Warren Buffett 💼💡💰
"The stock market is not a casino; it's a crooked casino." - Charlie Munger 🎰🎲🏛️
"Losses are part of the game. You can't win every trade." - Martin Schwartz. 📉😔💔
"The fundamental law of investing is the uncertainty of the future." - Peter Bernstein. ⚖️❓🔮
The More I trade, the more I realize how precise and meaningful are these phrases. Take them seriously, and they will help you achieve the financial success.
❤️Please, support my work with like, thank you!❤️
I am part of Trade Nation's Influencer program and receive a monthly fee for using their TradingView charts in my analysis.
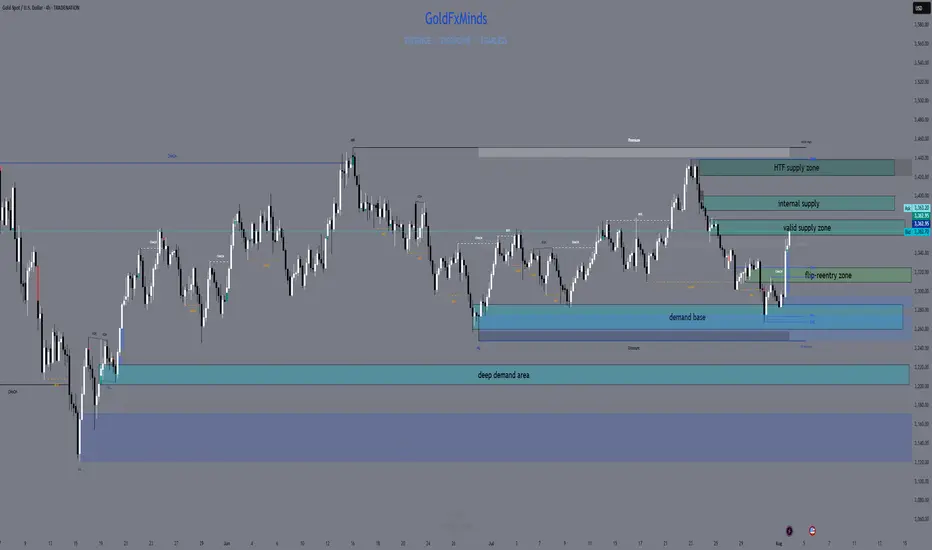
XAUUSD Daily Outlook – August 4, 2025We’re not in breakout. We’re deep in premium — and supply is stacked.
—
Gold is now trading at 3362, sitting right inside the first valid daily supply zone — the same block between 3355 and 3375 that caused the last rejection. The bullish rally from 3272 was clean: liquidity sweep, CHoCH, imbalance filled, HL confirmed. Bulls did their job. Now they’re walking straight into pressure.
Above this zone, things don’t get easier — they get trickier.
Just a bit higher, we have an internal supply trap between 3398 and 3412. It’s a reaction zone built from imbalance and inducement — not strong enough to hold a reversal on its own, but perfect to fake out breakout buyers. If price pushes through 3375 and enters this pocket, snipers should be watching carefully for early signs of weakness.
And finally, at the top of the current structure sits the HTF supply trap at 3430–3439 — the last weekly wick, the macro reversal zone. That level is sacred. If price makes it there, either we’ll see full-blown expansion… or a violent reversal born from overconfidence.
So what do we do now?
We wait.
If price starts to reject from this 3355–3375 supply with bearish intent, we target the flip reentry zone at 3318–3328 — the previous CHoCH break and dynamic EMA cluster. That’s your first intraday long trigger if bulls want to come back strong.
If that breaks, next is the demand base at 3287–3267, the origin of this entire bullish move. Below that? Imbalance support near 3225 — the final line before structure shifts.
—
🟥 Valid Supply Zone → 3355–3375
🟥 Internal Supply Trap → 3398–3412
🟥 HTF Supply Trap → 3430–3439
🟫 Flip Reentry Zone → 3318–3328
🟦 Demand Base → 3287–3267
🟦 Imbalance Support → 3225–3205
—
This isn’t a breakout. It’s a build-up inside premium.
The smartest move today might be no move — until structure speaks.
—
Are you watching for the rejection? Or the breakout trap?
Let us know your bias below 👇🏼
Tap that ❤️ if this gave clarity, and follow GoldFxMinds to stay ahead of every key level — no noise, just structure.
—
With sniper calm and strategic clarity,
GoldFxMinds 💙
Disclosure: Analysis based on Trade Nation TradingView chart feed.

GOLD trades in narrow range, leading market pulseThe current market pulse is still mainly revolving around the Trump-initiated tariff story, with spot OANDA:XAUUSD trading in a fairly narrow range and currently reported at $3,376/oz, down 0.13% on the day. Gold is also awaiting further impact from the Fed's interest rate cut, with a weaker Dollar providing support for non-yielding gold.
Tariff News Update
US President Donald Trump said on Tuesday (August 5) that US tariffs on imported semiconductors and pharmaceuticals will be announced “in about a week”. The progressive tariffs on imported pharmaceuticals could be as high as 250%.
US news agency Bloomberg News said the Trump administration is now preparing to target key economic sectors and pledge to reshape global trade.
“We’re going to start with a lower tariff on drugs, but within a year, not more than a year and a half, it’s going to be 150%, then 250% because we want drugs made in our country,” Trump said in an interview with CNBC on Tuesday. He did not specify what the initial tariff would be.
“We’re going to be announcing measures on semiconductors and chips, which is a different category,” Trump added. However, Trump did not provide further details.
The U.S. Commerce Department has been investigating the semiconductor market since April as it prepares for possible tariffs on an industry with estimated global sales of nearly $700 billion. The U.S. has imposed tariffs on imported cars, auto parts, as well as steel and aluminum under the Trump administration.
Tariffs on imported chips could significantly raise costs for major data center operators, including Microsoft Corp., OpenAI, Meta Platforms Inc. and Amazon.com Inc., which plan to spend billions of dollars on the advanced semiconductors needed to power their artificial intelligence businesses.
On the Fed’s interest-rate path
US job growth in July missed expectations, while nonfarm payrolls data for May and June were revised down significantly, with a combined loss of 258,000 jobs, suggesting a worsening labor market.
Furthermore, San Francisco Fed President Mary Daly said on Monday: "We may need more than two rate cuts, and more is likely." She also noted: "The labor market is not too weak, but it is weakening, and further weakening would be detrimental."
Surprising US labor market data and Daly’s dovish comments have all but confirmed the likelihood of a Fed rate cut in September. According to CME’s FedWatch tool, the market is now pricing in a 90% chance of a Fed rate cut in September.
OANDA:XAUUSD is often seen as a safe haven asset during times of political and economic uncertainty, and performs better in low-interest-rate environments.
Technical Outlook Analysis OANDA:XAUUSD
Gold is still trading in a fairly narrow range yesterday, but the price action is still mainly held above the EMA21 and it still has all the conditions for a possible increase. However, although the range is quite large, the overall situation is still showing a sideways accumulation trend.
Currently, gold is supported by the EMA21, followed by the short-term $3,310 level and the raw price point of $3,300. As long as it remains above the psychological $3,300 level, it is still eligible for a short-term bullish outlook.
Meanwhile, a break above $3,400 would open the door for a new short-term bullish cycle with the next target around $3,430 – $3,450.
On the momentum front, the RSI maintains its price action above 50 and is still far from the overbought zone (80 – 100) suggesting that there is still plenty of room for upside ahead.
During the day, in terms of technical position, gold has unchanged conditions that are inclined to increase in price, and the notable positions will be listed as follows.
Support: 3,350 – 3,340 – 3,310 USD
Resistance: 3,400 – 3,430 – 3,450 USD
SELL XAUUSD PRICE 3431 - 3429⚡️
↠↠ Stop Loss 3435
→Take Profit 1 3323
↨
→Take Profit 2 3317
BUY XAUUSD PRICE 3329 - 3331⚡️
↠↠ Stop Loss 3325
→Take Profit 1 3337
↨
→Take Profit 2 3343
Gold still looking bearish . Gold still looking bearish and respecting the upper trend line . My analysis is just as simple as previous ones hence easy to comprehend .
This is still a sell in as much price holds below the upper trend line . A break below the lower trend line will lead price to 3340s and a break below this again takes us to last weeks low at 3280s - 3270s . Still bearish biases until upper trendline is broken completely .

My #3,400.80 Medium-term Target deliveredAs discussed throughout my yesterday's (and many other analysis) commentary: If you have been Buying every dip as per my suggestion you would be in excellent Profits now. I have been Buying Gold from my #3,357.80, #3,367.80, #3,372.80 and #3,378.80 key entry points (last batch of Buying orders closed with Target late U.S. - early Asian session last night).
Technical analysis: Gold is under unprecedented Volatility (however with Bullish underlying trend) with Gold (Xau-Usd Spot) and the Futures price on a tight spread. This is of course the product of heavy speculation in the Metals market, fuelled by the expectation that the Fed’s new talks will be accepted. Needless to mention, this environment is Gold friendly. Technically I do see current aggressive decline in form of a correction as not sustainable however I cannot approach current configuration Technically since these are Fundamentally driven sessions but I do expect a slight pullback back towards #3,352.80 - #3,357.80 only for Gold to soar even more, as the main Support and Higher High’s High’s / Low’s cluster is nearby (#3,357.80 - #3,367.80). Despite Bond Yields stabilization, the continuous Low’s on DX on parabolic decline are adding Buying pressure on Gold and limiting all Selling advance which I am utilizing to it's maximum with my set of Buying orders.
Technical analysis: Gold is Trading on my predicted values as I really don’t mind current consolidation candles within newly formed Hourly 1 chart's Neutral Rectangle. Price-action has made marginal High's on Hourly 4 chart with #3,409.80 (local High's I mentioned earlier that can stall the uptrend) showcasing strong durability. If #3,400.80 benchmark however gets invalidated on High Volume (the last #3-session horizon had been really strong however ahead of local Resistance zone test very anemic) then I can call a test of the #3,427.80 Higher High's extension which represents my next Short-term Target. Gold is extremely Overbought however there are no signs of uptrend exhaustion as I don’t see any firm reason why #3,400.80 benchmark wouldn’t be re-tested within #2-session horizon. Remember, Weekly chart (#1W) still needs a slightly Lower Price (mentioned on previous remarks) before further uptrend as I mentioned that Gold dips only to rise more (Buying accumulation). DX is testing my Higher Low’s heavy Resistance zone as I haven’t got any reservations or doubts regarding its correlation to Gold.
My position: I have re-Bought Gold from #3,382.80 many times throughout yesterday's session and did final aggressive set of Buying orders on #3,388.80 calling for #3,400.80 benchmark late U.S. session which was delivered. I have closed all on #3,400.80 benchmark utilizing current upside push to it's maximum however Gold extended the rise towards #3,409.80 even. I stayed awake and re-Bought #3,395.80 few times since I knew Price-action will be circling #3,400.80 mark and consolidate. I will call it for this week and take early weekend break as I am more than satisfied with my Profits.

GOLD - been waiting for 2 weeksTeam, I have been waiting GOLD for two week to short at 3404-3410
i just woke up and missed the short
Price current at 3401 - I am shorting NOW
Target 1 at 3386 - take 70% volume and BRING STOP LOSS TO BE
Target 2 at 3365
LETS GO


XAUUSD H4 Outlook – August 4, 2025Structure is bullish — but supply is layered. Precision now matters more than bias.
—
Gold is trading at 3362, sitting right inside the heart of a key structural zone. After a strong breakout from 3285–3260, price reclaimed imbalance, broke internal structure, and powered higher into premium. The trend is bullish — but we’ve just stepped into stacked supply.
Let’s break down every zone that matters now, from top to bottom:
🟥 3360–3375 – Valid H4 Supply Zone
This is the first active supply block — the origin of the last bearish leg. It holds a clean OB + imbalance and is currently being tested for mitigation.
We're inside it right now. This zone is critical:
→ If price breaks and holds above it, continuation is likely
→ If we reject here, it confirms sellers are defending their level
🟥 3385–3398 – Internal Supply Trap
A secondary supply zone built from previous order flow.
If bulls push through 3375 without rejection, this is the next area to watch for weakness.
This zone often creates fake breakouts, especially when momentum slows. RSI is already showing signs of exhaustion approaching this level.
🟥 3420–3440 – HTF Supply Trap
This is the top — the last unmitigated supply on the weekly.
It's not in play yet, but if bulls break above 3398 decisively, this is where the bigger trap could form.
Any long into this zone must be backed by strong structure and continuation candles — otherwise, it’s a liquidation magnet.
🟫 3322–3310 – Flip Reentry Zone
If we reject from current supply, this is the first high-probability reentry for bulls.
It’s where the last CHoCH confirmed, and it aligns with EMA confluence and minor imbalance.
Buy setups from here must be confirmed on M15/M30 — no blind longs.
🟦 3285–3260 – Breaker Demand Base
The true origin of the bullish move.
This zone caused the structural flip — clean OB, FVG stack, and liquidity sweep.
If price returns here, it becomes a must-hold for bullish continuation. One of the best sniper zones for longs.
🟦 3222–3205 – Final Demand Layer
Deep structure zone holding imbalance + previous HL base.
Only comes into play if 3260 fails. A break below this would shift bias to neutral or bearish on H4.
🎯 Bias Summary
✔️ H4 bias = bullish
✔️ Price is inside 3360–3375 supply
✔️ EMA 5/21/50 aligned, but RSI is elevated
⚠️ This is not a breakout — it’s a test zone
🔁 Execution Plan
📍 Rejection from 3360–3375 → sell scalp toward 3322
📍 Clean break of 3375 → watch for next short at 3385–3398
📍 Failure of 3398 → HTF draw toward 3430–3439
📍 Pullback toward 3322–3310 → potential long zone
📍 Clean drop to 3285 → high-RR buy area
📍 Break below 3260 → only valid demand left is 3222
—
This is not the time to chase. It’s the time to stalk.
You’re in premium. Supply is active. Let structure decide — you just execute with clarity.
—
Which zone are you watching for your next move?
Comment your bias below 👇🏼 Smash the ❤️ if this brought clarity, and follow GoldFxMinds to trade with precision every day.
Disclosure: Chart based on Trade Nation feed (TradingView).
Bullish Momentum Ahead? XAAUSD Price to Watch!The market just closed above 3,353 , which is our BOS and RBS level. It was previously a resistance, then became support, and now it's being tested as resistance again. Looking at how gold moved last week, it came really close to the major resistance area I had marked. Unfortunately, it didn’t quite reach my pending order, which was set just a bit lower.
After reviewing the price action, I noticed that gold reacted to an order block before making its move upward. Luckily, we managed to catch a nice HnS sell setup & the golden zone fibo I had marked earlier, using my trusted golden Fibonacci levels. They’ve consistently delivered reliable entries.
Looking ahead to the upcoming week, I’ll be using the same golden fibo setup. The market is showing a clean pattern, and I’ve already mapped out a solid entry zone. The zone is fairly wide, but with proper risk management and entry layering, there’s definitely good potential for profit .
Let’s see how things play out next week. That’s all from me for now. If you found this helpful, feel free to like and follow for more analysis.

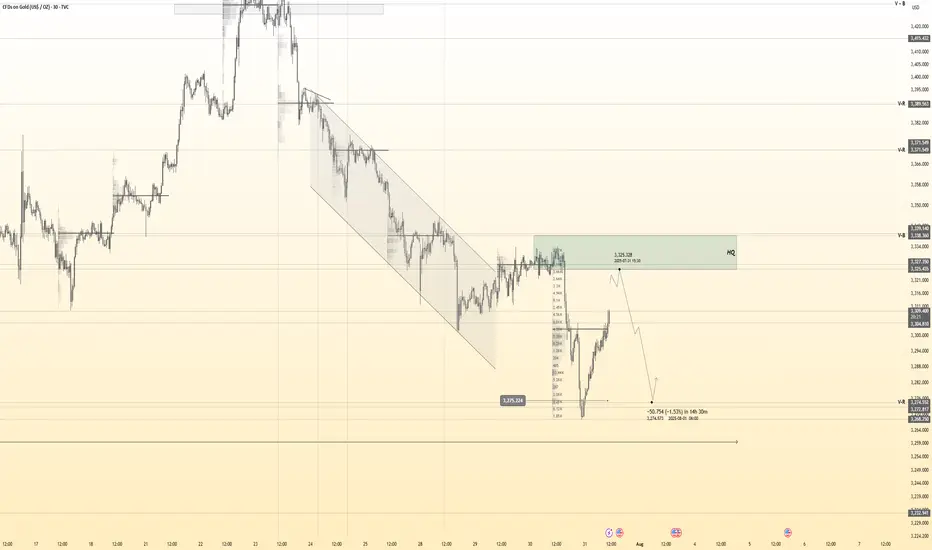
Gold 30Min Engaged ( Bearish Reversal Entry Detected )Time Frame: 30-Minute Warfare
Entry Protocol: Only after volume-verified breakout
🩸Bearish Reversal - 3325
➗ Hanzo Protocol: Volume-Tiered Entry Authority
➕ Zone Activated: Dynamic market pressure detected.
The level isn’t just price — it’s a memory of where they moved size.
Volume is rising beneath the surface — not noise, but preparation.
🔥 Tactical Note:
We wait for the energy signature — when volume betrays intention.
The trap gets set. The weak follow. We execute.