Today Gold Phucqed All Buyer today i think there is some us terriffs news which began gold to dump very badly , market liquidate the buyers , I am also a buyer and lost 9% today but here we go , im still a buyer , there is no strong logic behind it it's a gut feeling strategy 😅 now i am going for prayer ,
XAUUSD trade ideas

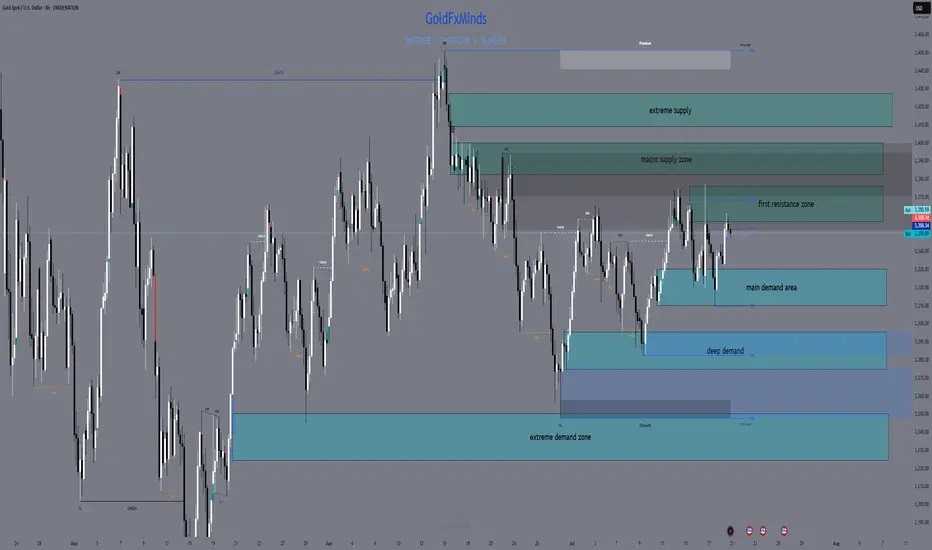
Weekly XAUUSD Outlook | July 21–25GoldFxMinds | Structure-Based HTF Plan
Hello traders,
This week we’re back in key HTF territory. Price is compressing inside a premium structure zone, between clean supply and demand areas. Trend is still bullish, but momentum is weakening — so we focus on structure to guide us.
🟨 Weekly Bias: Neutral | Range Structure in Play
We currently have no confirmed bullish or bearish bias on the weekly timeframe.
Gold remains trapped in a macro range between:
🟥 Upper Resistance Zone: 3355–3380
🟦 Lower Demand Zone: 3280–3240
Last week’s movement created a wick grab near 3375 followed by a strong push down, but without a clean break of structure — meaning we’re still inside a distribution–accumulation trap.
📌 Until we see a clear breakout (above 3380 or below 3280), the weekly bias remains neutral.
This is not a time to force directional trades on the weekly.
Instead, we wait for Daily and H4 confirmation, and position ourselves around the edges of this weekly range.
🔹 Last Week Recap
Weekly candle created a wick into 3377, rejecting just under previous week’s high. No BOS, no liquidity sweep with continuation — just a clear rejection inside supply, confirming premium trap.
Weekly candle closed with a top wick and small body — price is compressing under resistance. Still bullish structure, but not impulsive.
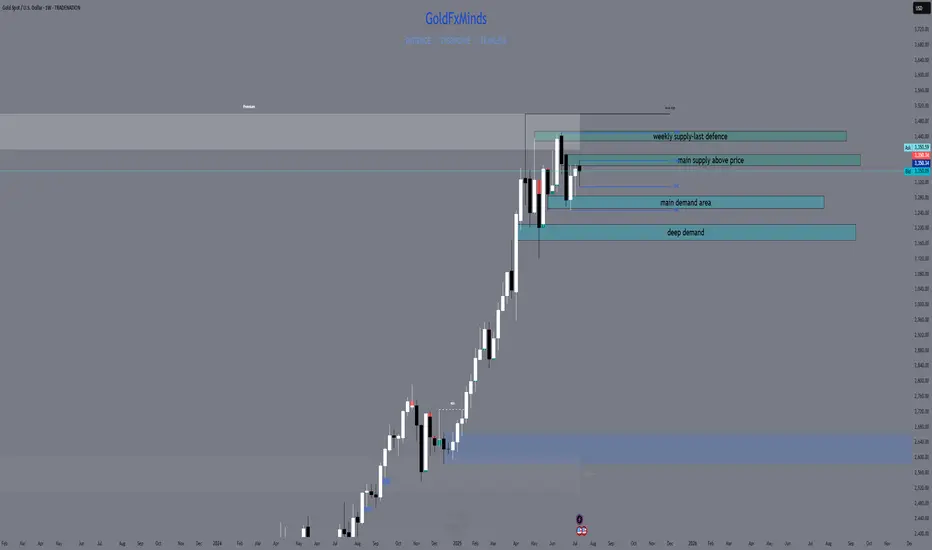
🔹 Weekly Key Structure Zones
🔸 3365–3390 (Supply)
→ Reason: Rejection from prior weekly high (3377), aligned with clean OB and FVG left behind from June breakout.
→ Structure context: No bullish BOS above 3375. This is now an unbroken supply zone with strong wick rejections. Liquidity sits above.
→ Use: Wait for price to tap back in → look for M15–H1 reaction for possible sell if no BOS above 3390.
🔸 3430–3450 (Supply - Last Line)
→ Reason: Unmitigated impulsive candle OB from prior macro swing high. This zone marks the final structure before a full continuation toward new highs.
→ Structure context: If this breaks with a strong BOS, macro structure flips bullish again.
→ Use: Only engage if price clears 3390 with strong volume and closes → watch this for last reaction zone.
🔸 3285–3260 (Demand)
→ Reason: Last bullish OB + FVG combo from early July, unmitigated. Price never retraced to this base since the rally.
→ Structure context: No BOS down yet, so this is still valid bullish origin.
→ Use: If price pulls back aggressively this week, watch this zone for LTF confirmation (CHoCH or BOS bullish). This would be a clean discount buy.
🔸 3210–3180 (Deep Demand)
→ Reason: Higher timeframe CHoCH origin zone, aligns with Fibonacci 61.8% retracement from entire May–July swing.
→ Structure context: Only in play if 3260 fails and we get clean BOS down on Daily.
→ Use: This is your swing buy zone if market breaks structure lower. Strong confluence for reaction.
🔹 HTF Structure Recap
Weekly trend: Still bullish (no BOS down), but compression under resistance
Structure range: Between 3390 and 3260 — price inside premium, no breakout yet
EMA Flow: Bullish but extended. Space for retracement.
RSI: Divergence above 3350 — supporting possible retrace.
🔹 Macro Events This Week
Tuesday: Powell speaks 🗣️ (volatility risk)
Thursday: Flash PMIs (usually directional)
Friday: Durable Goods & Home Sales 🏡
⚠️ Be patient on high-impact days. Let price come into your marked zones — don’t chase inside noise.
🔹 Summary & Plan
We are inside a macro range between 3390 (supply) and 3260 (demand). Structure is not broken — so we play both sides:
Sell Setup: If price taps back into 3365–3390 with no BOS → watch for reaction
Buy Setup: If price retraces into 3285–3260 → look for clean bullish CHoCH to validate
Middle area = chop. Wait for price to get to structure zones — don’t guess.
Thanks for reading 💛
We’ll drop daily and intraday outlooks once price moves closer to one of these structure zones. Until then:
🎯 Trade the reaction, not the prediction.
🔥 If you want these levels and sniper plans every day, follow , like 🚀🚀🚀 and drop a comment if you caught the move!
Stay focused, stay sharp, and never force a trade.
GoldFxMinds
GOLD SNIPER PLAN – July 21, 2025Hey, GoldMinds! 🔥
This isn’t just another range day — it’s the type of market that separates disciplined snipers from impulsive chasers. If you want an edge, you need a plan that’s both sharper and more refined than what most see on their charts.
After a week full of fake breakouts, confusing swings, and whipsaw price action, gold is giving us the gift of clarity — but only for those patient enough to let the market reveal itself. Here’s how you cut through the noise and focus on the only zones that actually pay.
🚩 SELL ZONES
1. Primary Supply: 3358–3370
This is the fortress where real sellers pushed back hard. The structure here is crystal clear: last week’s failed breakout, sharp rejection, and a textbook H1/M30 order block. You want the sniper entry? Wait for price to tap here and only short if you see an instant, aggressive bearish response on M15/M5 — not just a slow drift.
2. Upper Liquidity Trap: 3380–3395
Classic trap for late buyers. This is where price loves to sweep stops and trigger emotional FOMO — but the real professionals are only interested if the move fails hard. Watch for a fake breakout and sudden reversal; this is the sniper zone for “fade and run” shorts.
⚪ DECISION ZONE (Neutral / Pivot)
Pivot Range: 3335–3345
Forget this level — it’s where amateurs get chopped up. There’s no order block, no real fair value gap, just confusion and false hope. A true sniper waits here, watching, not acting.
🟢 BUY ZONES
1. Main Demand: 3326–3332
This is the engine room for bulls: a refined order block, evidence of real absorption, and a history of sharp reversals. Don’t try to anticipate — let price come here and look for a snapback move on M15/M5. This is where patient buyers take their shot.
2. Deep Demand: 3311–3320
Where the fear turns to opportunity. This zone sits under recent lows, home to panic sweeps and emotional selling. Only consider a long if you see a powerful, impulsive bounce. The risk is high, but the reward for perfect timing is even higher.
BIAS & EXECUTION
Bias: Neutral, but watch for range expansion — the market is coiling for a bigger move.
Execution:
– Only act at the true edges, never in the middle.
– Let M5/M15 price action prove your setup — the market owes you nothing.
– If a zone breaks with momentum, do not fight the flow; stand aside or prepare for the next edge.
FINAL SHOT
This is where discipline pays.
Sniper trading is about letting the market come to you and striking only when your zone lights up with confirmation. Every other move is just noise, meant to shake out the impatient. Drop a comment below with the zone you’re watching most , follow and🚀🚀🚀 GoldFxMinds for daily sniper maps, and remember: in gold, only real structure pays.
Disclosure: Charts powered by Trade Nation. Educational content only.
Gold Outlook for Today Todays outlook for Gold - I really cant share my strategy, if you want it, just send me a message and I will, It very simple, I think trading is simple, we just over think and complicate things
XAUUSD on swing Gold is currently holding rising channel along with the Range of 3340-3375
What's possible scanarios we have?
▪️I'm looking for Buying trade 1st we have 3342-3345 support area for potential buying spot.
Other then we have pending liquidity below 3340-3335 which I'm expecting the perfect buyying opportunity keep buy set targets at 3370 then 3400.
•Also we have buyying option If h4 closed above 3380 I will buy and target will be 3400.
▪️ keep in mind below 3330 we have sellers gap and our targets will 3305 then 3290
#XAUUSD

XAUUSD: Bearish Bias SetupI am watching for a possible reversal in XAUUSD, predicting a rejection with a downside target around 3.300.
This downside target is reasonable based on this setup, as it is based on a previous bullish move, from which price could find support and bounce, or break below, and the downside momentum could start to continue down.
I am just sharing my thoughts on the chart, this is not financial advice. Always confirm your setup and manage your risk accordingly.


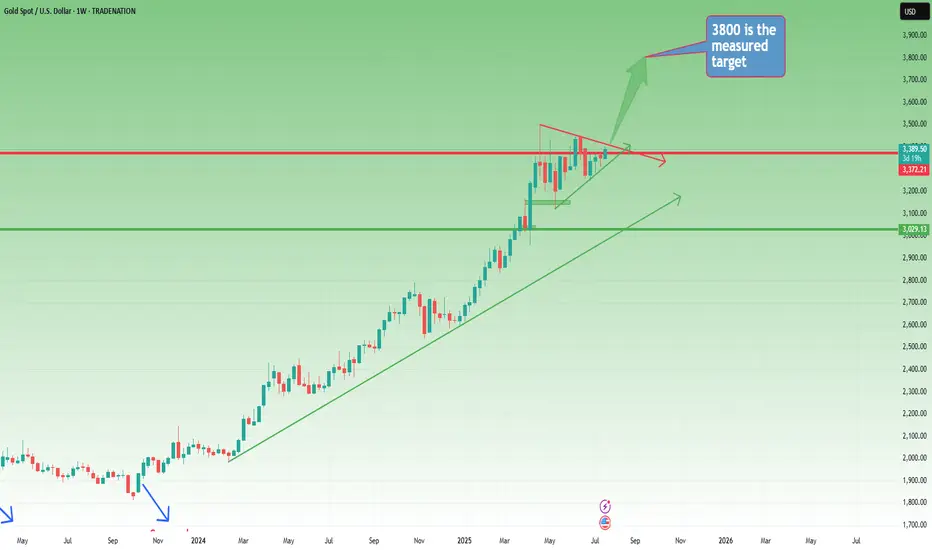
Weekly Outlook: Gold Builds Pressure – Is the Big Move Coming?📆 Big Picture View
Since the start of 2024, Gold has been moving in a well-defined long-term bullish trend.
Yes, there were meaningful pullbacks along the way — but the direction was never in doubt. Step by step, Gold climbed over 15,000 pips in just over a year, reaching a new all-time high in late April.
📉 Post-ATH: A Period of Stabilization
After peaking, Gold shifted into consolidation mode, with price gravitating around the 3300 zone.
This sideways movement has been ongoing for the past three months, but it’s not a sign of weakness — it’s the market catching its breath.
On the weekly chart, this consolidation is now forming a symmetrical triangle, a classic continuation pattern that often appears mid-trend.
📐 The Technical Setup
- The symmetrical triangle shows compression of volatility
- Buyers and sellers are slowly converging toward a decision point
- A breakout is approaching, and when it comes, it could be explosive
🎯 What’s the Trigger?
- A confirmed break above 3450 would validate the triangle breakout
- That opens the door to quickly test the 3500 round figure
- The measured target for the triangle sits at 3800
Given the time Gold has spent consolidating (3+ months), this target could realistically be reached by year’s end
🧭 Strategic Takeaway
- As long as Gold holds above 3300, the bullish structure remains valid
- Breakout above 3450 is the green light for the next leg up
- Until then, the consolidation continues, and smart money prepares
📌 Conclusion:
Gold is building pressure. The weekly triangle is maturing.
This isn’t the end — it’s the pause before the next move.
Stay patient. Stay focused.
Because if 3450 breaks… 3800 is not a dream — it’s a destination. 🚀
Disclosure: I am part of TradeNation's Influencer program and receive a monthly fee for using their TradingView charts in my analyses and educational articles.
P.S: Here you have a short term analysis on Gold
Gold 30Min Engaged ( 3355 Bearish Entry Detected )Time Frame: 30-Minute Warfare
Entry Protocol: Only after volume-verified breakout
🩸Bearish Reversal 3355 Zone
➗ Hanzo Protocol: Volume-Tiered Entry Authority
➕ Zone Activated: Dynamic market pressure detected.
The level isn’t just price — it’s a memory of where they moved size.
Volume is rising beneath the surface — not noise, but preparation.
🔥 Tactical Note:
We wait for the energy signature — when volume betrays intention.
The trap gets set. The weak follow. We execute.

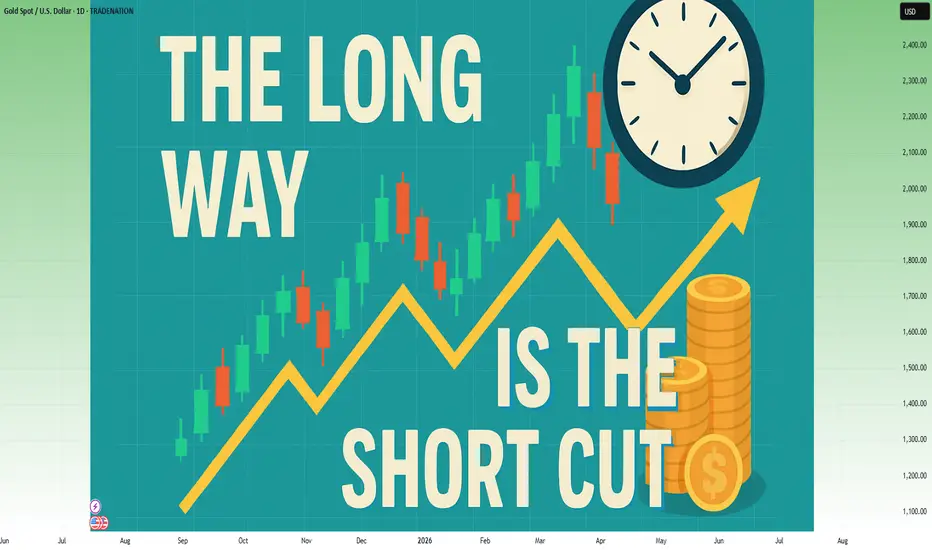
In trading, the long way is the shortcut⚠️ The Shortcut Is an Illusion — And It Will Cost You
In trading, everyone wants to arrive without traveling.
They want the profits, the freedom, and the Instagram lifestyle — even if it’s fake.
What they don’t want is the process that actually gets you there.
So they chase shortcuts:
• Copy signals without understanding the reason behind them
• Over-leverage on “the perfect setup”
• Buy indicators they don’t know how to use
• Skip journaling and backtesting
• Trade real money without trading psychology
And then they wonder…
Why is my account bleeding?
Why does this feel like a cycle I can't break?
Because:
Every shortcut in trading is just a fast track to disaster.
You will lose. You will restart. And it will take even longer than if you just did it right the first time.
🤡 The TikTok Fantasy: “1-Minute Strategy That Will Make You Millions in 2025”
This is the new wave:
A 60-second video showing you a magical indicator combo.
No context. No testing. No risk management.
Just fake PnL screenshots and promises of millionaire status before next summer.
“This 1-minute scalping strategy made me $12,000 today!”
And people fall for it… because it’s easier to believe in shortcuts than to accept that real trading is boring, repetitive, and hard-earned.
If it fits in a TikTok video, it’s not a strategy. It’s clickbait.
________________________________________
❓ Looking for a System Without Knowing the Basics
Here’s the paradox:
Most people are desperate to find a “profitable strategy” — but they haven’t even mastered the basic math of trading.
• They don’t know how pip value is calculated
• They don’t understand how leverage works
• They confuse margin with risk
• They size positions emotionally, not based on their account
• They can’t define what 1% risk per trade actually means in dollars
But they’re out here, loading indicators, watching YouTube “hacks,” and flipping accounts with 1:500 leverage.
Imagine trying to perform surgery before learning anatomy.
That’s what trying to trade a strategy without knowing pip cost looks like.
________________________________________
🛠️ The Long Way Is the Fastest Way
You want the real shortcut?
Here it is:
• Learn price structure deeply
• Backtest like a scientist
• Journal like a professional
• Risk small while you're learning
• Stay on demo until your edge is proven
• Master basic math: leverage, margin, pip value, position sizing
This is the long way.
But it’s the only way that doesn’t end in regret.
________________________________________
⏳ Most Traders Waste 2–5 Years Looking for a Shortcut
And in the end?
They crawl back to the long path.
Broke, humbled, and wishing they had just started there from the beginning.
The shortcut is a scam.
The long way is the only path that leads to consistency.
You either take it now… or take it later — after your account pays the price.
________________________________________
✅ Final Thought
Don’t ask how fast you can get profitable.
Ask how solid you can build your foundation.
Because in trading:
❌ The shortcut costs you everything
✅ The long way gives you everything
And the longer you avoid it, the longer it takes.
XAUUSD Expecting bullish Movement Gold is showing potential for a bullish reversal from the key support zone between 3390 to 3395. Price has formed a base in this range, and if it holds, we may see an upside breakout above the descending trendline
Buy Zone: 3390 – 3395
First Target: 3355.50
Second Target: 3380.50
A successful breakout and hold above the trendline resistance could trigger a move toward our short-term targets. Watch for bullish confirmation before entering. Manage risk accordingly

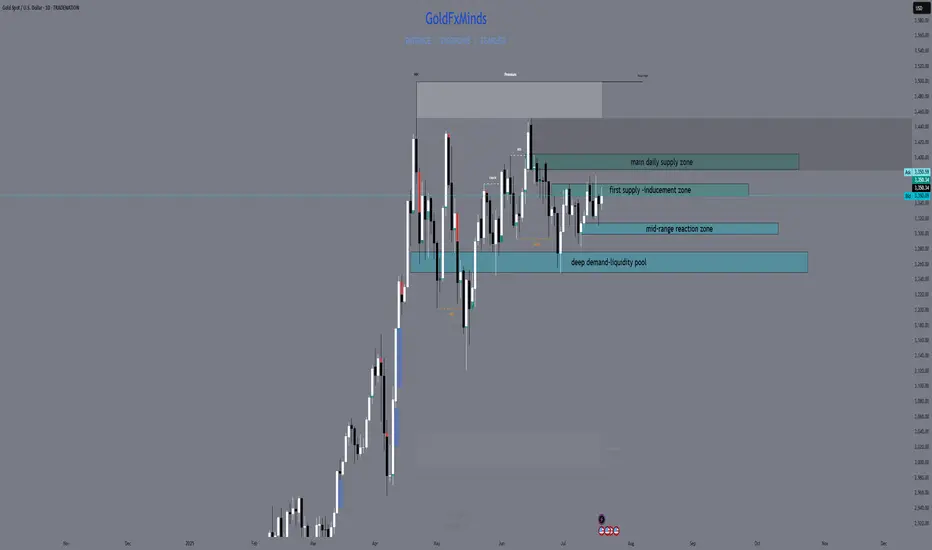
XAUUSD Daily Outlook – July 21, 2025Hey traders 💙
Gold continues to move inside a high timeframe range, with both bulls and bears defending structure at the edges. Price remains stuck between supply and demand — and only the strongest levels matter now. Here’s how the chart truly looks:
🔸 Key Supply Zones
1. 3380–3405: Main Daily Supply / Liquidity Pool Above
This is the top wall of the current range and the zone with the highest supply. Multiple failed breakouts, long upper wicks, and a clear cluster of liquidity just above. Unless we get a solid daily close above 3405, this area remains a trap for late buyers and a magnet for liquidity grabs.
2. 3355–3375: Internal Supply / Inducement Block
This zone has acted as an internal ceiling since the last CPI event. Here, price repeatedly failed to close above, and every return has produced quick rejections or fake breakouts. It often works as an inducement, catching breakout buyers and flipping the market lower.
🔹 Key Demand Zones
1. 3312–3300: Internal Demand / Mid-range Reaction
Here we see a clear reaction point where buyers have defended aggressively after CPI and NY session moves. It’s an internal demand area, often working as a temporary bounce or a place for stop hunts before larger moves.
2. 3275–3250: Main Daily Demand / Liquidity Pool Below
This is the base of the range, holding as support multiple times this month. Every dip into this zone has triggered large bounces, but the liquidity sitting below is also a key magnet for potential sweeps. Only a full daily breakdown here would flip the higher timeframe bias bearish.
📊 Technical Structure & Strategy
We are stuck between Main Supply (3380–3405) and Main Demand (3275–3250).
Every “middle” move is either inducement or a set-up for liquidity collection — not a real trend.
No daily close above 3405 → no bullish continuation.
No breakdown below 3250 → no clean bearish momentum.
Your edge: Only act when price confirms a reaction at a major zone with CHoCH/BOS, strong OB, or a liquidity sweep.
🧠 Takeaway:
This is not the time to guess direction — let the market show its intent at the edges. Use TradingView alerts on your key levels, be ready for volatility from macro news, and don’t get trapped in the mid-range games.
💬 Comment your bias or questions below.
Follow GoldFxMinds for more advanced XAUUSD updates and sniper-level education.
Stay patient, stay precise, and let structure work for you!
Posted using Trade Nation broker feed. As a participant in the Trade Nation Influencer program, I receive a monthly fee for using their TradingView charts in my educational content.
— GoldFxMinds 💙
Gold 30Min Engaged ( Dual Entry's Detected )Time Frame: 30-Minute Warfare
Entry Protocol: Only after volume-verified breakout
🩸Bullish Reversal 3357 Zone
🩸Bearish Reversal 3357 Zone
➗ Hanzo Protocol: Volume-Tiered Entry Authority
➕ Zone Activated: Dynamic market pressure detected.
The level isn’t just price — it’s a memory of where they moved size.
Volume is rising beneath the surface — not noise, but preparation.
🔥 Tactical Note:
We wait for the energy signature — when volume betrays intention.
The trap gets set. The weak follow. We execute.
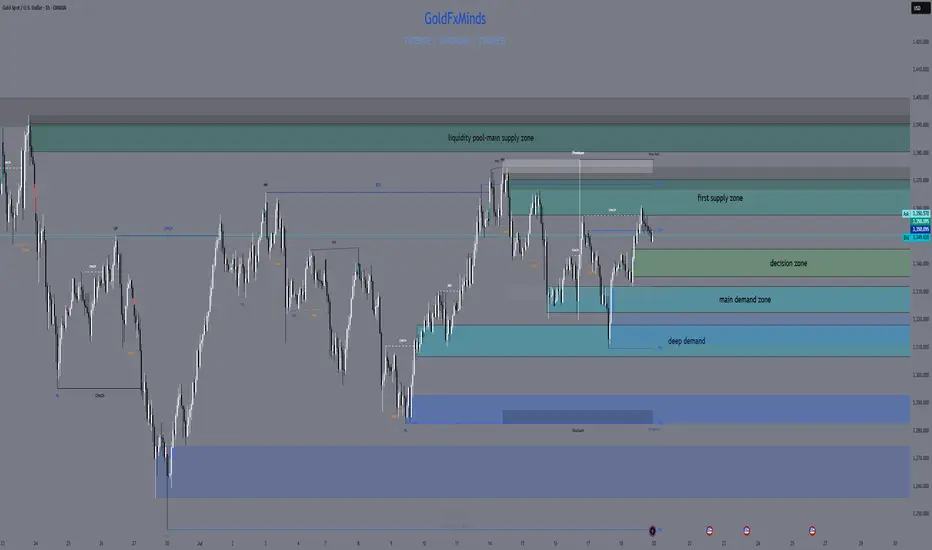
Gold Market Update – Key Zones for the Next MoveHey gold lovers! As the NY session wraps up, the chart is a painting of tension: gold boxed tight between major structure — and the real action is only about to start.
Bias:
At this stage, gold remains in a short-term bullish structure as long as price holds above the 3421–3428 decision area. A break and hold below this zone would shift the bias to neutral or bearish for the next sessions.
🎨 What’s drawn on the chart?
🟥 3472–3478 Supply Zone:
The ceiling, still untouched — this is where every failed breakout has left a “scar” on the chart. If we finally reach this zone, watch for wicks, rejections, or that rare, clean breakout candle. Sellers and patient bulls are both watching for “the drawing” to be complete.
🟩 3383–3390 Demand Zone:
The real floor. On your chart, it’s the base built by strong bounces and those long wicks buyers left behind. If price falls here, it’s not just a line: it’s a zone where new rallies are born and the market might “paint” a major reversal.
🟦 The Middle is Just Noise
Price is coiling, painting confusion in the center — but the edge zones are where structure and opportunity live.
Don’t be the trader who gets erased in the chop. Let price draw the story at supply or demand before making your move.
💡 Plan for Tonight
Wait for price to reach 🟥 supply or 🟩 demand.
Watch the “drawing” — will you see a wick, a rejection, or a true breakout?
Only trade once the story is clear at the edges.
Drop your best chart art or scenario below!
like🚀🚀🚀and 🔔 Follow for real structure updates & daily market stories — let’s turn trading into a masterpiece, together.
GoldFxMinds

XAUUSD LIVE OUTLOOK – JULY 23, 2025Good evening, traders—let’s get this right, no mistakes. Gold hit 3,438, then pulled back and found support exactly in the 3,380–3,390 zone. Here’s your precise update:
🔸 HTF OVERVIEW (H4 → H1)
New High & Liquidity Sweep: A clean breakout to 3,438 invalidated every old supply.
Primary Demand: Price settled into the 3,380–3,390 H4 order block (untested FVG beneath). H1 confirms this blue zone as the critical buy area.
Invalidated Supply: No valid sell zones until we carve fresh structure above 3,438.
🔹 LTF PRECISION (M30 → M15)
M30 Flow: Spike to 3,438, then instant drop into 3,380–3,390. Volume spiked on the decline, then eased as price held.
M15 Structure: Inside 3,380–3,390, watch for a clean BOS above 3,395—that’s your bull‑bear pivot. Until then, this zone is the edge of the knife.
🎯 KEY ZONES & TRIGGERS
Buy Zone #1 (Live): 3,380–3,390
Confluence: H4 order block + unfilled FVG + H1 swing low
Trigger: M15 BOS above 3,395 and retest.
Buy Zone #2 (Backup): 3,350–3,360
For a deeper pullback—untested H4 demand.
Sell Zone: 3,420–3,438
Confluence: unfilled H4 FVG + premium supply
Fade only on clear M15 rejection (pin‑bar/engulf).
Decision Pivot: 3,395
Above = bullish continuation; below = stand aside.
➡️ ACTION PLAN
Longs: Enter on M15 close above 3,395 and retest; targets at 3,420 then 3,438.
Shorts: Only on rally into 3,420–3,438 with a decisive rejection candle.
Invalidation: A sustained break below 3,380 warns of a deeper flush toward 3,350–3,360.
🚀 CALL TO ACTION
If this nailed your edge, smash that Like, Follow @GoldFxMinds for daily sniper updates, and Boost this post so your fellow traders don’t miss these live levels! Drop a 🔥 if you’re ready to strike the next move.
Disclosure: I’m part of TradeNation’s Influencer program and receive a monthly fee for using their chart feed.
— GoldFxMinds

The Myth of Gold Reversals – Why Traders Keep Catching the KnifeGold is a master of deception.
It shows a clean wick into a zone, but reacts just enough to pull in early buyers or sellers — then rips straight through their stops like they weren’t even there.
The reversal looked real and the candles seemed perfect.
But the move? It was never meant for them.
This isn’t bad luck, but traders who survive aren’t trying to guess, they are the ones reading the reaction after the trap.
Let’s break down how these traps happen — and how Smart Money actually operates when XAUUSD is loading a real move.
🟥 Sell Trap – The "Instant Short" Mistake
Price pushes up into a clear reaction zone — maybe an OB, maybe an imbalance, a FVG, or a gap.
Structure looks stretched. Traders recognize a premium zone and decide it’s time to short.
The trap? Jumping in immediately on the touch, with no confirmation.
This is where Gold loves to trap sellers.
No M15 CHoCH/ BOS on M5 or real liquidity swept. Just a blind move and hope.
Price often pulls slightly higher — sweeping internal liquidity, triggering SLs — then shows a real rejection.
📌 Here’s what needs to happen before selling:
• First: look for a liquidity sweep (equal highs or engineered inducement)
• Then: price must shift — CHoCH or BOS on M15 or M5
• Finally: confirmation via bearish engulf, imbalance fill, or break + retest
• For experts: M1 can offer refined sniper triggers with minimal drawdown
💡 If none of this appears, it’s not a setup — it’s a trap.
🟩 Buy Trap – The "Wick Bounce" Illusion
Price taps a demand zone — again, a refined OB or imbalance, liquidity zone.
A long bullish wick forms. Some candles pause. It looks like a reversal.
But there’s no shift.Just hovering.
Many jump in long the second they see the wick. And then price breaks straight through.
📌 Here’s how to flip this trap into a real buy:
• Let price sweep liquidity below the zone — signs of a purge - true wick bounce
• Watch for a CHoCH or BOS on M15, M5, or even M1
• Look for a strong bullish engulf from the reactive level
• Confirm via imbalance fill or price reclaiming broken structure
📍 If all that happens — the trap becomes your entry.
If not? Stand down.
📊 What Smart Traders Actually Do Differently
They don’t chase wicks.
And never enter just because price tapped a line.
IT IS ALL ABOUT READING STRUCTURE AND PRICE ACTION.
Here’s how:
• Mark the highest probability reaction zones — above and below current price;
• Set alerts, not blind entries;
• Wait for price to come into their zone and then watch what it does there;
• Look for confirmation: CHoCHs, BOS, engulfing candles, FVG fills, clean rejections;
• And always keep one eye on the news — because Gold reacts fast and violently when volatility hits.
• Repeat this work daily until they learn how to recognize signs faster and more secure.
That’s the difference between chasing the reversal… and trading the move after the trap.
Because in this game, patience isn’t just a virtue — it’s survival.
And Gold? Well, XAUUSD has no mercy for those in a hurry and not studying its moves day by day, month after month and so on. Learn structure and price action even if you join any channel for help if you are serious about trading this amazing metal.
If this lesson helped you today and brought you more clarity:
Drop a 🚀 and follow us✅ for more trading ideas and trading psychology.
XAUUSD H4 Outlook – Full Structure & Macro | July 21, 2025Hello, GoldMinds! 💙
After a volatile week, gold remains caught in a wide H4 range, ping-ponging between structural supply and demand. Let’s break down the current picture so you can navigate the next big moves with confidence.
🌍 Macro & Bias
Macro context:
Last week’s US CPI print triggered a temporary rally, but gold failed to hold above resistance and quickly reversed as the dollar strengthened. Next week brings Fed Chair Powell’s testimony, global PMI numbers, and jobless claims—all catalysts for new volatility.
Bias:
Neutral on H4:
Gold is consolidating inside a broad sideways range.
The market is waiting for a catalyst to break above 3375 or below 3310 before showing a real trend.
🔸 Structural Key Supply Zones (Above Price)
1️⃣ 3357–3375 | Main H4 Supply
Why it matters:
Aggressive NY and CPI rallies have been sold off here; price rejected every attempt to close above 3375. OB, liquidity cluster, inducement—this is the first real ceiling above price.
Trade logic:
Watch for M15/H1 reversal or exhaustion. No clean break = supply remains active.
2️⃣ 3384–3400 | Macro Supply
Why it matters:
All failed breakouts from early summer were stopped in this block. Liquidity pool and macro OB; every test led to sharp pullbacks.
Trade logic:
Avoid FOMO—only short with confirmation of rejection.
3️⃣ 3410–3425 | Extreme Supply
Why it matters:
The final upper ceiling for now. Any spike here is likely to see big profit-taking and volatility.
🔹 Structural Key Demand Zones (Below Price)
1️⃣ 3330–3310 | Main H4 Demand
Why it matters:
All major dips last week bounced here—bulls are active in this OB. It’s the base of the current “micro-range,” with clear LTF inducement and high volume.
Trade logic:
Look for bullish reversal (M15/H1) before trusting any long from here.
2️⃣ 3295–3275 | Swing Demand / Discount Zone
Why it matters:
The main structure support for July. Strong OB, historic liquidity sweeps—each deep flush has brought responsive buyers.
Trade logic:
Watch for reaction, but don’t knife-catch without a clear structure break.
3️⃣ 3250–3225 | Extreme Demand / HTF Liquidity Pool
Why it matters:
The “final line” for bulls. This zone has absorbed all major liquidations and created swing reversals since early spring.
📊 H4 Structure Logic
Current play:
Gold is stuck in a structural cage between 3375 and 3310.
Until price closes outside these edges, every spike is likely a liquidity hunt.
Pro move:
Only react to confirmation in these zones—don’t force trades in the mid-range!
🧠 Game Plan
Set alerts at each supply & demand zone.
Wait for confirmation: M15/H1 CHoCH, BOS, wicks, or volume.
Let the news come to you: Powell & PMI will likely force a test of an edge; be patient.
💬 What’s your bias for the week? Drop it below and tag a friend!
🚀🚀🚀 and Follow GoldFxMinds for sniper-level gold planning and deep-dive SMC education.
Posted using the Trade Nation broker feed as part of their influencer program for using their TradingView charts in educational content.
— GoldFxMinds 💙
Gold: holding flat grounds Gold was traded relatively flat during the previous week, moving within a range of $3.370 and $3.313. The safe-haven asset was holding relatively steady on eased geopolitical and economic tensions. The US Dollar gained a bit last week on better than expected inflation and jobs data posted during the week. Analysts are in agreement that current concerns related to the U.S. debt growth and further trade tariffs updates will certainly support the price of gold in the near future period.
The RSI was holding relatively steady modestly above the level of 50. This indicates that investors are still not ready to take the move toward the oversold market side. The MA50 modestly slowed down its divergence from MA200, however, two lines are still holding a higher distance between them, in which sense, cross is certainly not in store for some time in the future.
Charts are indicating that the price of gold continues to be well supported around current levels. There is some potential for a small move toward the down side, till the levels around $3.310. Also, the $3.3K support line might be tested. On the opposite side, any news related to geopolitical or economic tensions might swiftly push the safe-haven asset toward the upside, at least till the level of $3.370.

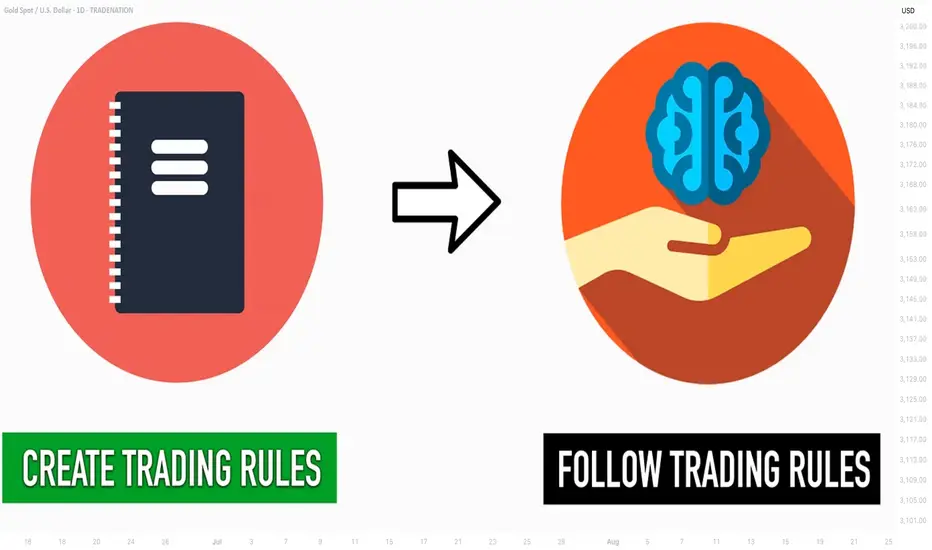
Learn 2 Essential Elements of Forex Gold Trading
In the today's post, we will discuss how Forex Gold trading is structured, and I will share with you its 2 key milestones.
Trading with its nuances and complexities can be explained as the interconnections of two processes: trading rules creation and trading rules following.
1️⃣ With the trading rules, you define what you will trade and how exactly, classifying your entry and exist conditions, risk and trade management rules. Such a set of consistent trading rules compose a trading strategy.
For example, you can have a following trading plan:
you trade only gold, you analyze the market with technical analysis,
you buy from a key support and sell from a key resistance on a daily, your entry confirmation is a formation of a reversal candlestick pattern.
You set stop loss above the high/low of the pattern, and your target is the closest support/resistance level.
Here is how the trading setup would look like.
In the charts above, all the conditions for the trade are met, and the market nicely reached the take profit.
2️⃣ Trading strategy development is a very simple process. You can find hundreds of different ones on the internet and start using one immediately.
The main obstacle comes, however, with Following Trading Rules.
Following the rules is our second key milestone. It defines your ability to stay disciplined and to stick to your trading plan.
It implies the control of emotions, patience and avoidance of rationalization.
Once you open a trade, following your rules, challenges are just beginning. Imagine how happy you would feel yourself, seeing how nicely gold is moving to your target after position opening.
And how your mood would change, once the price quickly returns to your entry.
Watching how your profits evaporate and how the initially winning position turns into a losing one, emotions will constantly intervene.
In such situations, many traders break their rules , they start adjusting tp or stop loss or just close the trading, not being able to keep holding.
The ability to follow your system is a very hard skill to acquire. It requires many years of practicing. So if you believe that a good trading strategy is what you need to make money, please, realize the fact that even the best trading strategy in the world will lose without consistency and discipline.
❤️Please, support my work with like, thank you!❤️
I am part of Trade Nation's Influencer program and receive a monthly fee for using their TradingView charts in my analysis.
GOLD Melted , 2 Best Places To Sell Clear , Don`t Miss 200 Pips Here is My 30 Mins Gold Chart , and here is my opinion , we Again Below 3377.00 and we have a 30 Mins Candle closure below this strong res , so i`m waiting the price to go back and retest this res and new support and give me a good bearish price action to can enter a sell trade and we can targeting 200 pips , and we have a good res @ 3365.00 we can sell from it also if the price didn`t reach 3377.00 and targeting from 100:200 pips , and if we have a Daily Closure below This res this will increase the reasons for us , just wait the price to back a little to retest it and then we can sell it . if we have a daily closure aboveit this idea will not be valid anymore .

SWING TRADE OPPORTUNITY 〉LONGAs illustrated, I try to visualize what the next bullish impulse could look like if price holds 3300 as a key psychological and algorithmic price level.
Illustrated are the potential buy areas (a current one and an extended one in case a pullback occurs to manipulate lower levels in the next 24-48 hours).
This projection, if valid, could hold from now until next week, so it can be considered a swing trade to hold at least the next week and into the following one).
--
After this post, I will upload another analysis on the Daily timeframe projecting the longer term move, so make sure to go in my profile to check it out.
GOOD LUCK

XAU/USD Elliott Wave Setup : Triangle Ends, Impulse BeginsThe 8-hour XAU/USD chart presents an Elliott Wave structure, currently in the final stages of Wave 4 within a larger impulsive cycle. The complex correction in Wave 4 has unfolded as a WXYXZ (triple-three pattern), forming a contracting triangle (ABCDE) — a classic consolidation phase that typically precedes a sharp impulsive breakout.
Wave E has recently completed near the lower boundary of the triangle, supported by the ascending trendline drawn from the April low. This suggests the correction is mature and Wave 5 is ready to ignite.
Target 1 (T1) : 3434.845
Target 2 (T2) : 3500.535
Stop Loss (SL) : 3309.729
The triangle (Wave 4) breakout structure suggests bullish continuation.
Multiple internal WXY corrective waves have completed, signaling exhaustion.
Volume and candle structure support the possibility of impulsive buying in Wave 5.

Gold trend analysis: bullish but not chasing the rise.Gold, last Thursday's daily line closed with a long lower shadow, bottomed out and stabilized, and once again stabilized at the lower track support point of the large convergence triangle. Combined with the cyclical movement after the two stabilizations at 3247 and 3282, it was three consecutive positive rises; therefore, last Friday, and at least these two days on Monday this week, there will be consecutive positive rises; today gold rose as expected, the Asian and European sessions continued to be strong, and there was a second rise in the U.S. session. Since the U.S. session went directly higher before and after, the current support below has moved up to the 3377-75 area, where a top and bottom conversion position will be formed. Therefore, if it falls back to 3375-77 in the evening, you can continue to go long and look to above 3400. If it falls below 3370, it will fluctuate. The upper short-term resistance level is 3387-3393, the previous high. If the market touches here for the first time, you can try to see a double top decline.
