Professional Chart Analysis – Gold Spot (XAU/USD) – 4H Timeframe⏳ Overview
This 4-hour chart of XAU/USD (Gold vs USD) shows a large symmetrical triangle pattern with a smaller triangle forming near the apex — signaling an upcoming high-probability breakout. This structure reflects prolonged market indecision and compression of volatility.
---
🔺 1. Chart Pattern Structure
🟦 Primary Structure: Symmetrical Triangle
Upper Trendline (Resistance): Descending from ~3,480 to ~3,400
Lower Trendline (Support): Ascending from ~3,200 to ~3,300
This large triangle encapsulates price action since April 2025, representing an extended consolidation phase.
🟥 Secondary Structure: Mini Triangle
A smaller triangle (highlighted in pink) within the larger structure shows tight range consolidation in the last 2–3 weeks.
This acts as a coiling zone, where a breakout is imminent.
---
📈 2. Price Action Analysis
Current Price: $3,374.26 (midpoint of the large triangle)
Volatility: Significantly reduced, suggesting a breakout move is coming.
Market Condition: Low momentum and choppy within the range — likely liquidity build-up by institutions.
---
🎯 3. Key Levels
Zone Price Range Significance
Immediate Resistance $3,400–$3,420(Local top of triangle)
Immediate Support $3,300–$3,320(Bottom triangle support)
Major Breakout Level 🔼 Above $3,420(Bullish breakout)
Major Breakdown Level 🔽 Below $3,280 (Bearish breakdown)
High Target Zone $3,500–$3,560(Measured bullish move)
Low Target Zone $3,200–$3,140(Measured bearish move)
---
🧭 4. Trade Setup Scenarios
✅ Bullish Scenario (Breakout Above $3,420)
Entry: Above $3,420
Stop-Loss: Below $3,390
Targets:
TP1: $3,500
TP2: $3,560
⚠️ Bearish Scenario (Breakdown Below $3,280)
Entry: Below $3,280
Stop-Loss: Above $3,310
Targets:
TP1: $3,200
TP2: $3,140
---
📉 5. Institutional Perspective
This pattern may represent distribution (if it breaks down) or re-accumulation (if it breaks up).
Institutions often use triangle apexes as breakout points to trigger stop hunts and induce volatility.
---
📝 Professional Conclusion
> Gold (XAU/USD) is in a well-defined symmetrical triangle, with price action approaching a critical breakout zone. The market is coiling within a smaller triangle, suggesting a volatility explosion is near. Traders should stay out of the chop zone and prepare for a breakout or breakdown confirmation using volume, candlestick structure, or retest setups.
---
Would you like me to:
🔧 Mark this chart with entry/exit levels, stop loss, and breakout targets?
📤 Prepare a version suitable for posting on TradingView with annotations and analysis title?
XAUUSD trade ideas


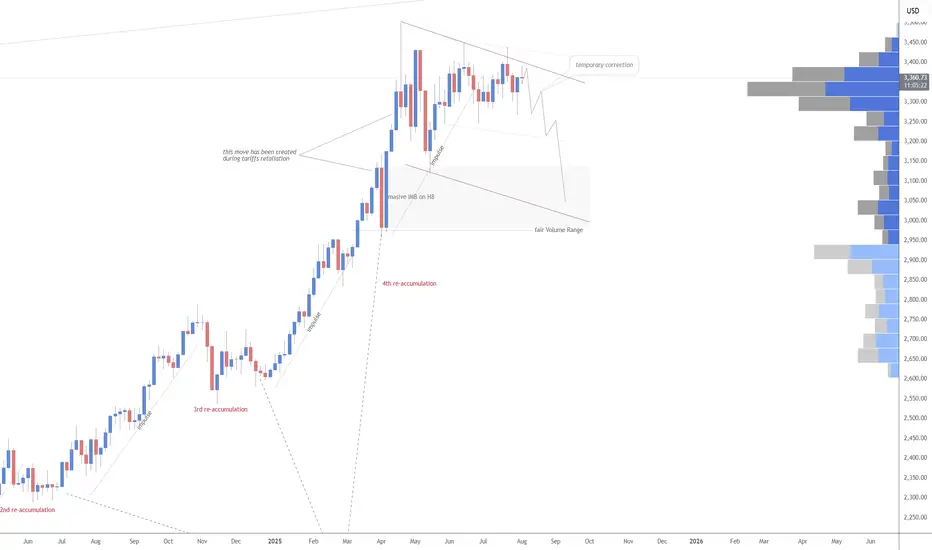
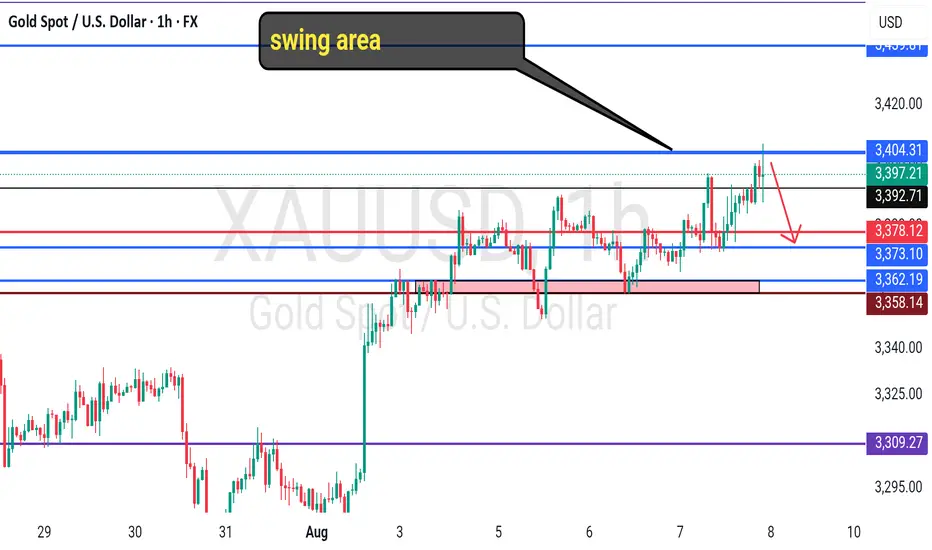
GOLD ROUTE MAP UPDATEHey Everyone,
Quick follow up on our 1H chart route map:
What can I say.....pure perfection on our chart analysis as everything played out exactly as expected.
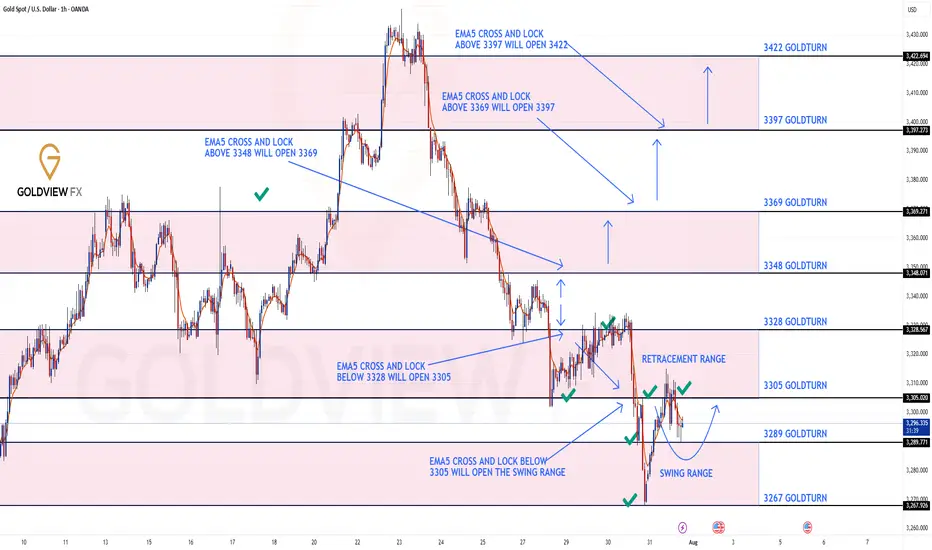
Yesterday, we identified the first level of the swing range at 3289, which delivered a clean full swing into 3305.
Today, we hit Level 2 of the swing range at 3267, and once again, it played out flawlessly with another full swing up to 3305.
A perfect finish to the day. Great work all around!
We are now looking for support above the swing range and a break above 3305 to track the movement up or further retest and break below the 1st level of the swing range may open the the 2nd level at 3267 again.
We will keep the above in mind when taking buys from dips. Our updated levels and weighted levels will allow us to track the movement down and then catch bounces up.
We will continue to buy dips using our support levels taking 20 to 40 pips. As stated before each of our level structures give 20 to 40 pip bounces, which is enough for a nice entry and exit. If you back test the levels we shared every week for the past 24 months, you can see how effectively they were used to trade with or against short/mid term swings and trends.
The swing range give bigger bounces then our weighted levels that's the difference between weighted levels and swing ranges.
BULLISH TARGET
3348
EMA5 CROSS AND LOCK ABOVE 3348 WILL OPEN THE FOLLOWING BULLISH TARGETS
3369
EMA5 CROSS AND LOCK ABOVE 3369 WILL OPEN THE FOLLOWING BULLISH TARGET
3397
EMA5 CROSS AND LOCK ABOVE 3397 WILL OPEN THE FOLLOWING BULLISH TARGET
3422
BEARISH TARGETS
3328 - DONE
EMA5 CROSS AND LOCK BELOW 3328 WILL OPEN THE FOLLOWING BEARISH TARGET
3305 - DONE
EMA5 CROSS AND LOCK BELOW 3305 WILL OPEN THE SWING RANGE
3289 - DONE
3267 - DONE
As always, we will keep you all updated with regular updates throughout the week and how we manage the active ideas and setups. Thank you all for your likes, comments and follows, we really appreciate it!
Mr Gold
GoldViewFX
GOLD Weekly Recap & Outlook (Week 31 | July 28 – Aug 01)Note: Some elements may shift depending on your screen size. View the full snapshot in perfect layout:
📈 CAPITALCOM:GOLD
Timeframe: 30m | MJTrading View
⸻
🔹 Weekly Performance
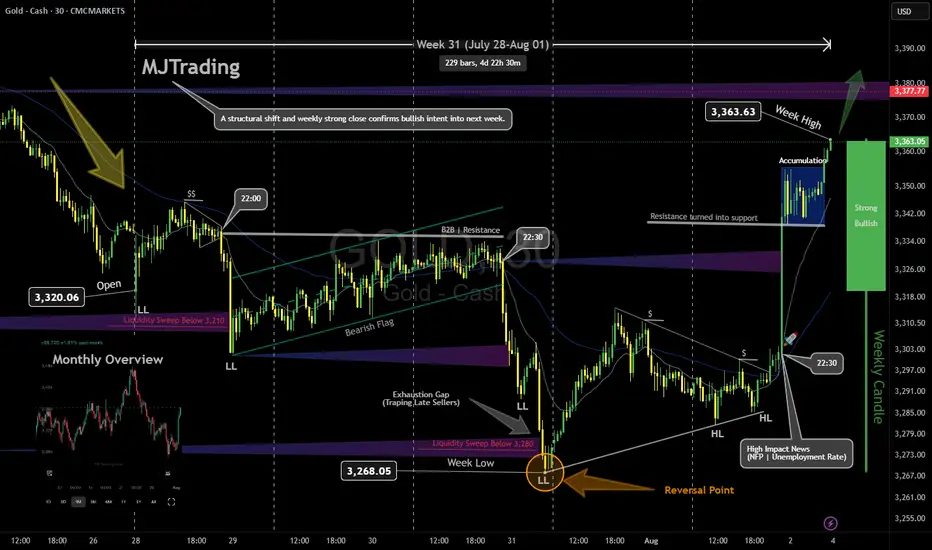
• Open: 3,320.06
• High: 3,363.63
• Low: 3,268.05
• Close: 3,363.05
Gold delivered a classic Smart Money move this week: liquidity sweep, structural shift, and bullish expansion.
⸻
🔹 Price Action Breakdown
1️⃣ Early Week: Bearish Continuation
• Price opened around 3,320 with a gap and extended last week’s bearish leg.
• Formed lower lows (LL) and a bearish flag, signaling continuation.
2️⃣Midweek: Liquidity Grab, Reversal Point and
• Last Bearish leg marks the exhaustion gap and stop run.
• Market printed a liquidity sweep below 3,310 then 3,280 (weekly low), trapping late sellers.
• Smart Money likely absorbed sell-side liquidity before initiating the reversal leg.
• This aligns perfectly with SMC principles: sweep → accumulation → expansion.
3️⃣ Late Week Rally
• Following NFP & Unemployment Rate news, price broke 3,333 and rallied strongly to 3,363.63 confirming a Bullish Market Structure Shift (MSS).
• Resistance turned into support, validating the accumulation phase.
• Price rallied strongly to 3,363.63,.
• The weekly candle flipped bullish, closing near the high, with Smart Money leaving a clear footprint of accumulation and expansion.
⸻
🎯 Key Levels & Outlook
• Support: 3,355 → 3,333 - 3,340
• Resistance: 3,377 → 3,380+
• Bias: Bullish above 3,333.
• Watch for liquidity sweeps of intraday lows to catch new long entries, targeting 3420-3440.
⸻
💡 MJTrading View:
A structural shift and weekly strong close confirms bullish intent into next week.
As long as 3,333 holds, dips are buying opportunities.
⸻
Please share your opinions...
#MJTrading #GoldAnalysis #SmartMoney #LiquiditySweep #PriceAction #MarketStructure #Forex #TradingView #ChartDesigner #BullishMarket
Fortnight Overview:
Psychology Always Matters:
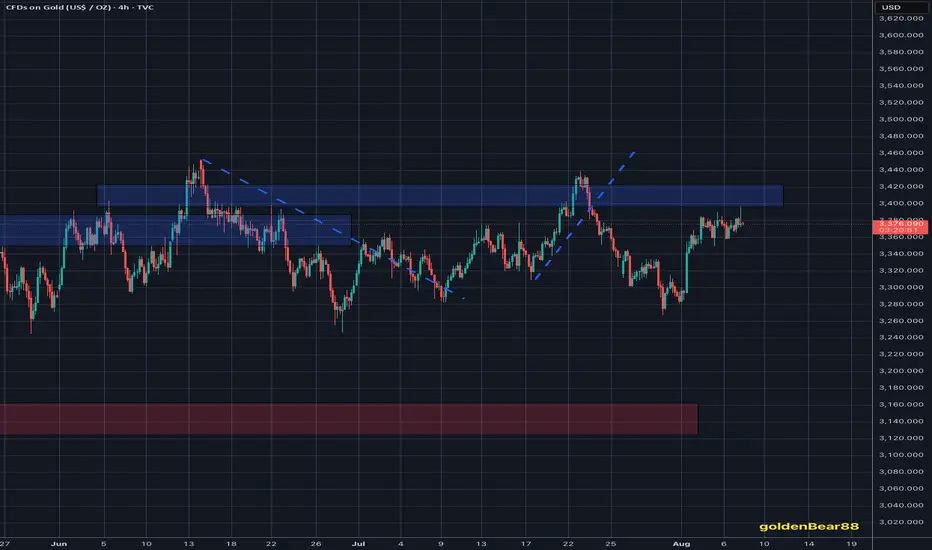
Gold Bullish intradayOverall bias is bullish on gold for today . im looking at price to break out of this wedge and either retest the zone where there was volume or it may just shoot up . im already in the trade but this could ne another entry up with stop loss a few pips as buffer beneath the zone .

Smart Money Concept (SMC) XAU/USD Bearish Analysis – SMC
1. Market Context
The price is coming off a bullish expansion that mitigated areas of interest, but failed to break through supply structures with force, leaving an imbalance (FVG 4H) and pending liquidity at lower levels.
2. Consolidation Zone
After the surge, the market entered a consolidation phase (accumulation/distribution), forming BOS and ChoCh without generating new HH, a sign of buying weakness.
3. Fake Out and Rejection
A fake out trapped buyers and the price returned to the range, indicating liquidity absorption by institutional investors.
4. Bearish Interest
The previous LL and LH levels were not mitigated and act as price magnets. This creates bearish interest, with a high probability of seeking that liquidity.
5. Trading Plan
• Entry: Rejection at the resistance zone
• Confirmation: Failed retest and rejection (SMA rejection)
• Target: Next LL at the support zone
• Stop Loss: Above the resistance zone/fake out
Summary: The price is showing a distribution structure with accumulated liquidity below the support, increasing the probability of a bearish continuation.
GOOD LUCK TRADERS….

Gold Poised for a Surge: 3400 in Sight, 3430 Within ReachToday, gold retreated to a low of around 3350 before rebounding again, reaching a high of around 3390. During this process, we seized the opportunity to go long on gold near 3356 and closed the trade by successfully hitting TP: 3380, making a profit of 240 pips!
Although gold retreated after reaching 3390, I had originally planned to short gold near 3395, but gold didn't reach that level during the rally, so our shorting plan had to be shelved. Currently, it's trading in a narrow range around 3380. Clearly, I'm not considering shorting gold after a pullback.
Although gold retreated to around 3350 during the day, it did not destroy the current bullish structure of gold. In addition, gold regained the 3370-3375 area again during the rebound, and the gold bulls became even stronger. Therefore, I have now lost the desire and interest to short gold. Gold has currently reached a high near 3390. Given its current structure and strength, I don't believe 3390 is the current high. Gold is likely to attempt to break through 3400, and even has the potential to continue its rise to the 3420-3430 range. As the center of gravity of gold shifts upward, the current short-term support has moved up to the 3375-3365 area; and the relatively strong support is located in the 3360-3350 area.
Therefore, for short-term trading, I prefer to start trying to go long on gold after it retreats to the 3375-3365 area, and expect gold to hit 3400 as expected, or even continue to the 3420-3430 area.

XAUUSD Chart Analysis – Smart Money Concepts (SMC) Based🔍 XAUUSD Chart Analysis – Smart Money Concepts (SMC) Based
1. Market Structure Overview:
The chart clearly shows a bullish market structure forming after a sequence of Breaks of Structure (BOS) and Change of Character (CHoCH) events.
The market has consistently made Higher Lows, indicating strength from the bulls and institutional order flow to the upside.
2. Key Zones Identified:
✅ Strong Support Zone (Demand Area):
Around $3,260–$3,280, this level has been respected multiple times.
It is marked with BOS, CHoCH, and a Bullish Fair Value Gap (FVG) indicating institutional accumulation and unfilled orders.
The area also contains a Weak Low, which gives price a reason to stay above if bullish sentiment continues.
❌ Strong Resistance Zone (Supply Area):
Around $3,420–$3,460, this area shows signs of Level Rejection and is labeled with Buy-Side Liquidity.
This is where price previously reversed after grabbing liquidity—indicating distribution and possible shorting interest from smart money.
3. Liquidity Zones:
Buy-Side Liquidity: Above recent swing highs near $3,420–$3,440. Price tapped this level and sharply rejected.
Sell-Side Liquidity (Target Area): Currently aiming for the zone around $3,350, which aligns with a recent imbalance (FVG) and a clean liquidity pool below short-term higher lows.
4. Fair Value Gaps (FVGs):
A Bullish FVG is seen mid-chart, where price was rapidly driven up, leaving a gap—price later returned to this zone, respected it, and pushed higher again.
This is a strong sign of institutional entry and provides excellent long entries.
5. Trend Confirmation:
BOS + CHoCH + Higher Lows = Bullish Bias.
Each low is forming higher than the previous, with strong rejections from demand zones.
6. Entry & Target Insight:
Entry Point: After price reacted from support and printed another Higher Low.
Target: Currently price is targeting $3,350 (short-term retracement or pullback target).
This target is likely an internal liquidity sweep before potential continuation to retest the resistance zone again.
7. Educational Takeaways:
Market Structure is King: Observe BOS/CHoCH for directional bias.
Liquidity Matters: Understand where liquidity is resting—price seeks it.
FVG as Entry Tool: Fair Value Gaps provide high-probability trade setups when aligned with structure.
Patience at Key Zones: Wait for confirmations at resistance/support rather than impulsive trades.
✅ Summary:
Bias: Bullish, until structure breaks.
Short-Term Target: $3,350 (as per the chart).
Long-Term View: If price maintains higher lows, potential revisit to the resistance zone ($3,420–$3,460) is likely.
Invalidation Level: Break and close below strong support ($3,260) would shift bias.

GOLD short term Analysis. - 15 mins. Gold (XAU/USD) – Harmonic Pattern Analysis (15m Chart)
As of: August 5, 2025
🔶 Pattern Observed: Bearish Harmonic (likely Gartley or Butterfly)
Pattern Completion: Near 3385–3390 zone
The price has tested the PRZ (Potential Reversal Zone) and started showing early signs of weakness.
A clear "Short only below here" marker is drawn just below 3370, signaling key support.
🔻 Short Trade Thesis:
If price breaks and sustains below 3370, bearish confirmation is triggered.
This confirms the harmonic pattern's validity and opens the path for impulsive downside targets.
🎯 Downside Targets (if 3370 breaks):
First target: 3310–3320
Second target: 3265–3270
Final target (extended move): 3180–3200
⚠️ Invalidation:
If price breaks above 3395–3400, the harmonic setup is invalidated.
In such case, avoid any short setups and re-analyze price action for new trend direction.
Conclusion:
This harmonic pattern suggests a high-probability short setup below 3370, with clean targets mapped out. However, it's critically important to wait for confirmation (break and retest or strong momentum candle) before entry. If the price starts moving up from current levels without breaching 3370, this setup becomes invalid.
⚠️ Disclaimer:
This analysis is for educational and informational purposes only and should not be considered as financial advice. Trading commodities and financial instruments involves significant risk and may not be suitable for all investors. Please perform your own due diligence or consult with a licensed financial advisor before making any trading decisions. The author is not liable for any losses incurred based on this analysis.

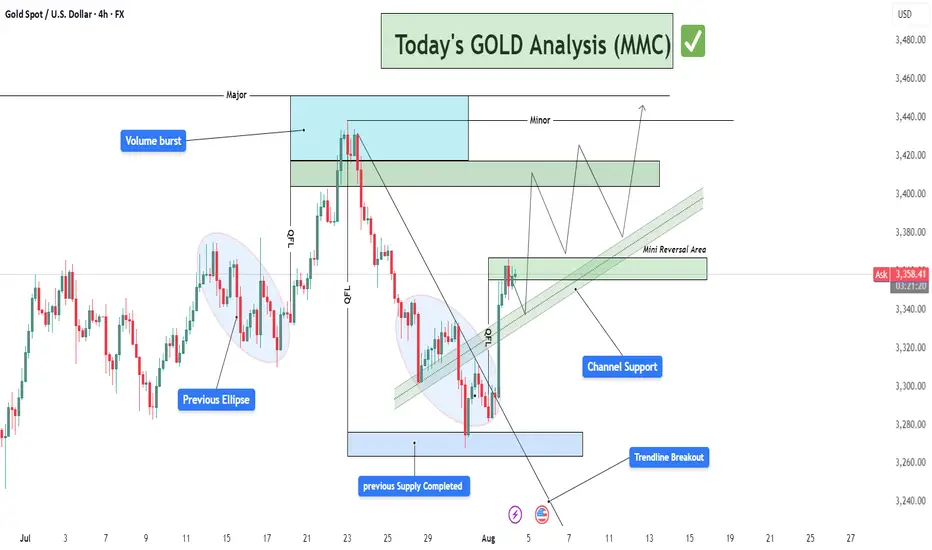
Today's GOLD Analysis : MMC Structural Analysis + Reversal ZoneThis analysis is rooted in MMC – Mirror Market Concepts, a framework designed to track institutional behavior through liquidity patterns, QFL (Quick Flip Levels), trendline shifts, and volume bursts. The current 4H Gold chart demonstrates a smart money footprint that provides actionable insight for intraday and swing traders.
🔍 Detailed Technical Breakdown:
🟦 1. Previous Supply Completed | Demand Zone Reversal
At the lower end of the chart, price entered a key blue zone around $3,250–$3,280, previously a supply zone now flipped into demand. This zone represents where institutional buyers absorbed liquidity, forming the base for a bullish impulse.
The strong reaction from this zone, marked by long-wick candles and immediate reversal, indicates exhaustion of selling pressure.
This reversal is confirmed by a QFL structure, meaning price created a fast liquidity sweep before flipping direction.
MMC recognizes this as a high-probability area of reversal, a point where smart money typically enters.
📈 2. Trendline Breakout & Structure Shift
A descending trendline, representing bearish market control, was decisively broken to the upside. This shift marks:
End of the corrective phase
Beginning of a bullish structural change
Buyers now control the short-term narrative
The breakout was not only clean but also supported by a volume burst, which is a classic MMC indicator that institutional traders are entering the market.
🔶 3. Volume Burst Confirmation
Volume behavior plays a critical role in MMC. We see a clear volume spike post-breakout. This suggests that:
The breakout is not false
Buyers were aggressively positioned
A sustainable move is in development
This supports the validity of the trendline breakout and confirms the idea that price is ready to test higher liquidity zones.
🟢 4. Current Price Structure: Bullish Channel
After the breakout, the market formed a bullish channel, where price is steadily climbing while respecting parallel boundaries.
The channel support line acts as a dynamic entry point for retracement buys
MMC strategy uses this structure to identify scaling entries at channel lows or after successful pullbacks into key reversal zones
🟩 5. Mini Reversal Area (Short-Term Resistance Zone)
Price is currently testing a minor supply zone or what MMC defines as a "Mini Reversal Area". This is a reaction zone before continuing toward the major target above.
There are two possible reactions:
Short-term rejection, leading to a pullback into the lower channel support zone
Minor consolidation, forming a base for a breakthrough toward major resistance
🟦 6. Major & Minor Supply Zones Above
Marked in light blue and green, these zones represent areas where previous selling volume and distribution occurred.
The major supply zone (approx. $3,440–$3,470) is the next institutional target
The minor zone sits between $3,400–$3,420 and may cause initial resistance or a base for another impulse
These levels are prime for partial profit-taking or scouting short-term reversal trades.
📊 Trade Management Insights:
🛒 Buy Opportunities (Long Bias):
On pullback into channel support near $3,340–$3,350
On bullish confirmation from mini reversal area
On break and retest above minor resistance at $3,420
🛑 Stop-Loss Suggestion:
Below the channel support or below the blue demand zone (approx. $3,245)
🎯 Profit Targets:
TP1: $3,400 (first resistance)
TP2: $3,420 (minor supply)
TP3: $3,450–$3,470 (major institutional level)
🧠 Mirror Market Concepts (MMC) Highlights:
QFL Structures = Institutional Reversal Points
Volume Burst = Confirmation of Breakout Validity
Trendline Breakout = Momentum Shift
Channel Structure = Controlled Climb Pattern
Mini Reversal Zone = Key Decision Point Before Continuation
🧭 TradingView Summary for Minds Community:
This GOLD chart beautifully aligns with the MMC method — spotting smart money involvement early and aligning with their flow. After confirming structural reversal via trendline and QFL, the setup now looks poised for continuation toward the $3,440–$3,470 zone, making it a perfect chart to watch for buy-the-dip setups.
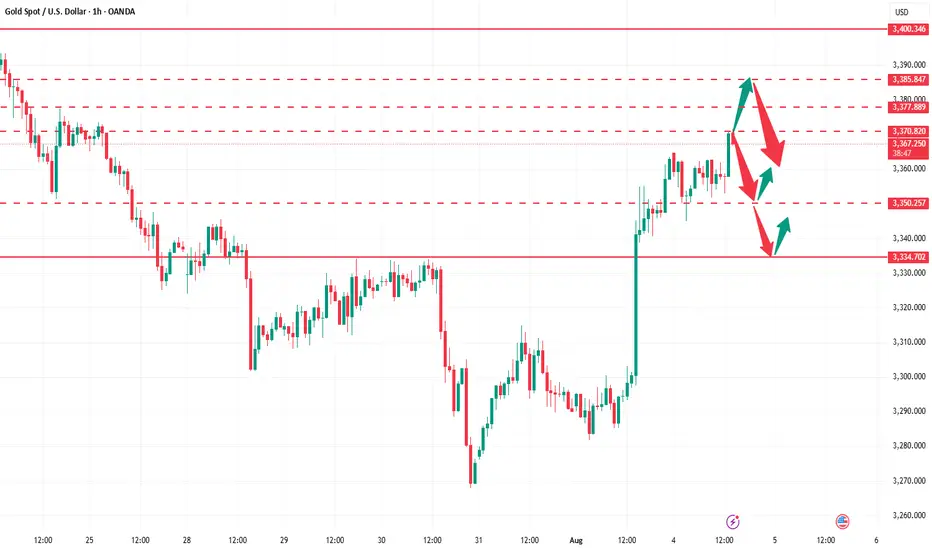
Why do you always miss the real opportunities?Judging from the current gold trend, gold rose to a high of around 3368 and then entered a narrow range of fluctuations. Our previous long plan failed to continue to hold at the high level. Although some brothers may feel regretful, the market is always full of variables. We must flexibly adjust our thinking according to market changes. At present, there is a need for a retracement on the technical side. This retracement is not a trend reversal, but provides space for subsequent bullish momentum. Overall, the bullish trend is still dominant, but the current price is approaching the important pressure area of 3370-3385. The short-term carrying capacity has weakened, and it is not advisable to chase highs blindly. It is recommended to be cautious at high levels in operations. In the short term, it can be given priority to try to intervene with short positions in batches in the 3370-3385 area, waiting for a technical correction. If it subsequently retraces to the key support area of 3350-3335 and stabilizes, you can consider the long position layout again and continue to participate in the main bull trend.
Gold operation suggestion: short in batches in the 3370-3385 area, with the target at 3355-3350. If it falls back to the 3350-3335 area and stabilizes, consider entering a long position at the right time.
Gold you now totaly buy trend for next 3 to 5 days Gold you now totaly buy trend for next 3 to 5 days
If you want learn more fell free contrect me .

GOLD Weekly View📌 Mark your reference points — key levels or order blocks on the chart.
📌 Wait for price to reach them — there’s no need to be in the market all the time.
📌 Once price reaches your level, allow 10–40 candles to form. This is critical. Why? Because during this time, the market goes through its usual phases:
1. Accumulation
2. Manipulation
3. Distribution (which results from accumulation)
💡This is the natural cycle: cause and effect.
You don’t want to get trapped in the accumulation or manipulation phases, that’s where most traders get liquidated.
Instead, wait for structure to form inside your reference point or order block. Once structure is clear, you’ll often spot a QML (Quasimodo Level) and that’s your entry trigger.
💡You don’t need to be the first buyer or seller. You just need to enter at the right time, with clarity and confirmation. Let the market come to you, and let it show its hand before you act.
XAU/USD – Bearish Momentum Building: Circle 2 Top In?OANDA:XAUUSD
We have now completed a 1-2-3-4-5 structure to the downside (in white).
Following that, we got a counter-correction in the form of an A-B-C, which potentially marks the completion of our yellow (Circle) Wave 2 🟡.
However, it’s not confirmed just yet — we still have two additional Fibonacci levels at 3400 and 3418, which could act as resistance zones and final topping areas for Circle 2.
We are now anticipating a 1-2-3-4-5 impulse into Circle 3, as already illustrated in yellow 🟡.
So at the moment, bias remains bearish 🔻.
Should we break above the Fibonacci levels mentioned, I do have an alternative scenario in mind — an ABCDE triangle formation that may have developed over the past months.
If that becomes relevant, I’ll make a separate upload for it 📌.
For now, I'm actively looking for sell positions, and I’ve already entered shorts ✅.


XAUUSD: Market Analysis and Strategy for August 4th.Gold Technical Analysis:
Daily Chart Resistance: 3400, Support: 3300
4-Hour Chart Resistance: 3370, Support: 3330
1-Hour Chart Resistance: 3363, Support: 3352.
Last week's NFP data was positive for gold prices, sending gold prices sharply higher. The market trend was much stronger than expected, breaking through the resistance level of 3333 and then rising to around 3360.
The daily chart shows Friday's sharp rise, erasing the losses from the first four days of last week. This signals continued bullishness for this week and the market outlook.
However, for those of us who are day traders, please be cautious about buying at high levels. After all, excessive short-term gains in gold could lead to profit-taking.
Technically, the daily MACD fast and slow lines are about to form a golden cross near the zero axis, indicating that the downward correction is nearing its end. However, the 1-hour RSI indicator shows a strong overbought signal, suggesting continued movement towards the lower support level.
For today's trading, it's best to wait for a pullback before buying. This is both safer and offers greater profit potential. Focus on the lower support level around 3333-3320. Upside targets could be in the 3375-3390 range.
Buy: near 3330
Sell: near 3370

XAUUSD Analysis todayHello traders, this is a complete multiple timeframe analysis of this pair. We see could find significant trading opportunities as per analysis upon price action confirmation we may take this trade. Smash the like button if you find value in this analysis and drop a comment if you have any questions or let me know which pair to cover in my next analysis.

GOLD - Cut n Reverse Area? Holds or not??#GOLD... market perfect moved as per our analysis and now m
It's just reached at his current ultimate area that is 3404
Keep close with and holding of that area means drop...
NOTE: we will cut n reverse above althat area on confirmation.
Good luck
Trade wisely
Gold extending Buying sequenceAs discussed throughout my Tuesday's session commentary: "My position: I will keep Buying every dip on Gold from my key entry points / #3,357.80 is one of them expecting final push above the Resistance zone towards #3,400.80 benchmark."
If you have been Buying every dip as per my suggestion you would be in excellent Profits now. I have been Buying Gold from my #3,357.80, #3,367.80, #3,372.80 and #3,378.80 key entry points (last batch of Buying orders closed with Target late U.S. - early Asian session last night).
Technical analysis: Gold is under unprecedented Volatility (however with Bullish underlying trend) with Gold (Xau-Usd Spot) and the Futures price on a tight spread. This is of course the product of heavy speculation in the Metals market, fuelled by the expectation that the Fed’s new talks will be accepted. Needless to mention, this environment is Gold friendly. Technically I do see current aggressive decline in form of a correction as not sustainable however I cannot approach current configuration Technically since these are Fundamentally driven sessions but I do expect a slight pullback back towards #3,352.80 - #3,357.80 only for Gold to soar even more, as the main Support and Higher High’s High’s / Low’s cluster is nearby (#3,357.80 - #3,367.80). Despite Bond Yields stabilization, the continuous Low’s on DX on parabolic decline are adding Buying pressure on Gold and limiting all Selling advance which I am utilizing to it's maximum with my set of Buying orders.
Gold Analysis: Short Selling is ExpectedThe short selling point is expected from the upper resistance, as this resistance is very strong.

Gold Reversal in Progress - Sell Signal Confirmed Below 3375Hello IGT FOLLOWERS
Here is my Gold overview, Gold is showing weakness after rejecting resistance near 3378/3390. Price is giving rejection from the resistance level again and again, indicating bearish momentum. A break below 3360 could confirm further downside till 3330..
Key points :
Entry point : 3375
Resistance area : 3378/3390
Support Area : 3338/3330
Follow me for more latest updates and signals

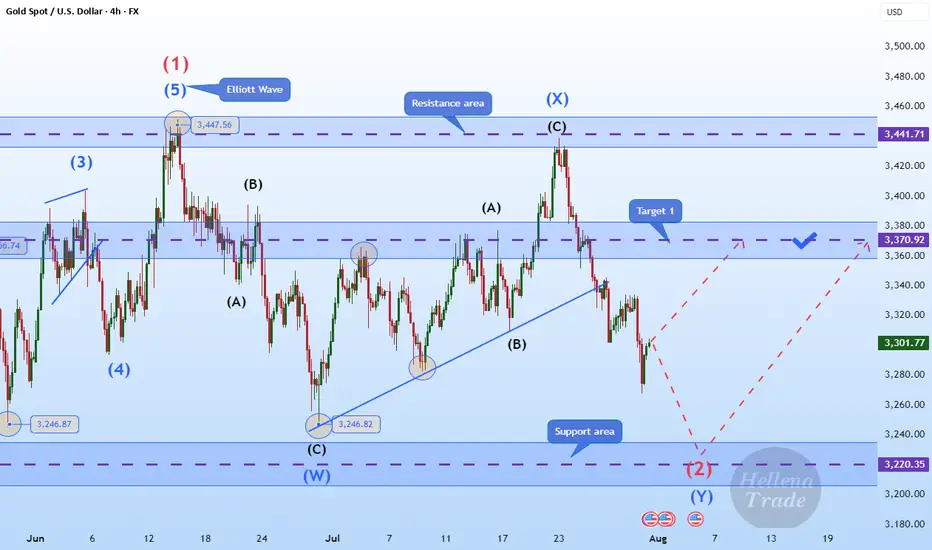
Hellena | GOLD (4H): LONG to area of 3370 (Wave 2).Colleagues, gold is once again disrupting our plans, and I have to revise the wave marking. It's not easy, but the most important thing is to keep doing it.
Now I'm back to the previous marking — the price is in wave “2” correction.
To complete this wave, the price needs to overcome the level of wave “W” of the middle order 3246.82. Then the correction will be completed and wave “3” will begin an upward movement.
I see the minimum target in the area of the 3370 level.
Manage your capital correctly and competently! Only enter trades based on reliable patterns!
XAUUSD Technical AnalysisTechnical Analysis – Symmetrical Triangle with Retest
Current Market Situation
The chart shows a symmetrical triangle pattern, which is a continuation pattern often followed by strong directional movement.
The price has broken below the triangle, signaling a potential bearish move.
Currently, the price is in the retest phase of the broken triangle, which is an important area to confirm the bearish trend before continuing downward.
Key Zones
Retest Zone (Pullback): Located between current price and 3,374, which is a strong resistance area.
Targets (TP):
TP1: 3,322.97
TP2: 3,285.87
TP3: 3,262.59
Possible Scenarios
✅ Bearish Scenario (Preferred):
If the price holds below the retest zone, we expect a continuation to the downside towards:
Target 1: 3,322.97
Target 2: 3,285.87
Target 3: 3,262.59
⚠ Bullish Scenario (Alternative):
A daily close above 3,374 will invalidate the bearish scenario and may trigger a reversal.
Conclusion
The market shows a strong technical indication of a bearish continuation after confirming the retest.
Any daily close above 3,374 would cancel the bearish scenario.
It is recommended to monitor price action closely in the retest zone for confirmation before entering trades.
