shorti see a very good sell on XAUUSD and it might be ranging between the accending channel which is good for scalping but since it's Friday i'm not taking any trades
XAUUSD trade ideas

XAUUSDlook TF M5
Entry Setup and Risk Management:
Active Buy Limit at 3,368.00 (Volume: 10 million USD)
Entry is pending at the lower Order Block (OB) zone and the imbalance area.
SL (Stop Loss): Around 3,365.00
TP (Take Profit): 3,381.00 – 3,381.70
Manual Buy at 3,370.41 and 3,370.49 (Volume: 5 million USD each)
Both positions are currently open, targeting the same TP area — the Daily OB zone.
Price Confirmation:
The current price is around 3,371.73, showing bullish potential (upward reversal).
There is a bullish reac

XAU/USD Technical Analysis (1H Chart)Based on the 1-hour chart, XAU/USD is currently at a critical juncture, presenting a potential short-selling opportunity. The analysis is based on a confluence of technical factors.
Key Observations:
Minor Bearish Trend: The price is trading within a well-defined descending channel, indicating a short-term bearish trend. The market has been forming a series of lower highs and lower lows since the peak around the 06:00 mark on August 6th.
Fibonacci and Trendline Confluence: The current price is testing a significant resistance zone. This area is a cluster of multiple technical indicators:
Descending Trendline: The price is directly touching the upper boundary of the bearish channel, which is acting as dynamic resistance.
Fibonacci Retracement: The price has retraced up to the 0.618 Fibonacci level, a key area where sellers often step in to push the price back down.
Moving Averages: The price is trading below the faster-moving averages (red, green, blue lines), which are also beginning to slope downwards, adding to the bearish sentiment.
Trade Scenario:
The chart highlights a potential short (sell) trade setup:
Entry: Around the current price level (~3,372.130), capitalizing on the resistance from the trendline and Fibonacci cluster.
Stop Loss: Placed above the recent swing high and the resistance zone, around 3,378.000. This protects the position against a breakout above the channel.
Take Profit: Targeted at a lower support level, around 3,338.000.
Conclusion:
The outlook for XAU/USD in the short term is bearish. The price is facing strong resistance at the confluence of the descending trendline and the 0.618 Fibonacci level. As long as the price remains below this resistance cluster, a continuation of the downward move towards the target of 3,338.000 is likely. A break and close above the 3,378.000 level would invalidate this bearish scenario.

Gold still Trading in Bullish territoryTechnical analysis: No strong Bullish impulse regarding yesterday's U.S. session opening, as Gold didn’t extended recovery candles and finally invalidated both Resistances in one hit / try (I cannot treat #3,382.80 as an breakout since strong Volatility Gold is Trading under). This is a typical sign that the market should continue consolidating, waiting for a catalyst to extend Buying motion. Since Gold is Buying every Bottom since #2023 Year as fractal which is repeated #3 times statistically, every variance that Gold repeats #3 times or more, it becomes a cycle which every Gold Trader should take into consideration. As Fed commentary usually arise Buyers on the aftermath - Gold continues the Buying sentiment, engages the consolidation Rectangle (lately #5-session consecutive run of #20 point Trading on average), then engages the steeper decline. Regarding all mentioned above, I can expect Trading to be performed above #3,377.80 - #3,382.80 hard Resistance zone where Gold can engage the consolidation Rectangle above (Stabilization area as I prefer calling it), and then again deliver Lower High’s extension once local High's are Priced in. Fundamentally, the Risk-off sentiment that DX Investors had these past few sessions should fade away after this result as Investors will remove capital from riskier assets such as DX and Bond Yields, and can go back to safe-haven metals such as Gold with confidence. Meaning that if DX continues to lose value after NFP debacle, Bond Yields should benefit along with the Stock markets, which can kick-start the Buying sequence on Gold, and vice-versa.
My position: I will keep Buying every dip on Gold from my key entry points / #3,357.80 is one of them expecting final push above the Resistance zone towards #3,400.80 benchmark.

8/4: Watch Support at 3343–3337 and Resistance at 3372–3378Good morning, everyone!
Last Friday, gold rallied strongly, driven by a combination of favorable economic data and bullish technical signals, decisively breaking above the 3337–3343 resistance zone. During the subsequent pullback, price action remained firm above 3337, followed by a secondary upward move.
From a technical standpoint, the structure suggests the potential for continued upward consolidation, with the possibility of filling the gap near 3396. However, significant resistance remains between 3372 and 3378 — failure to break through this zone decisively may result in a short-term pullback before further gains.
Key levels to watch:
Initial support: 3348 and 3337–3343 zone
Major support: 3312–3300 zone (a break below could signal deeper downside risk)
Trading Strategy:
Focus on intraday setups around these critical areas. Look for buy opportunities on dips as long as support holds, while remaining cautious of sharp pullbacks near strong resistance.

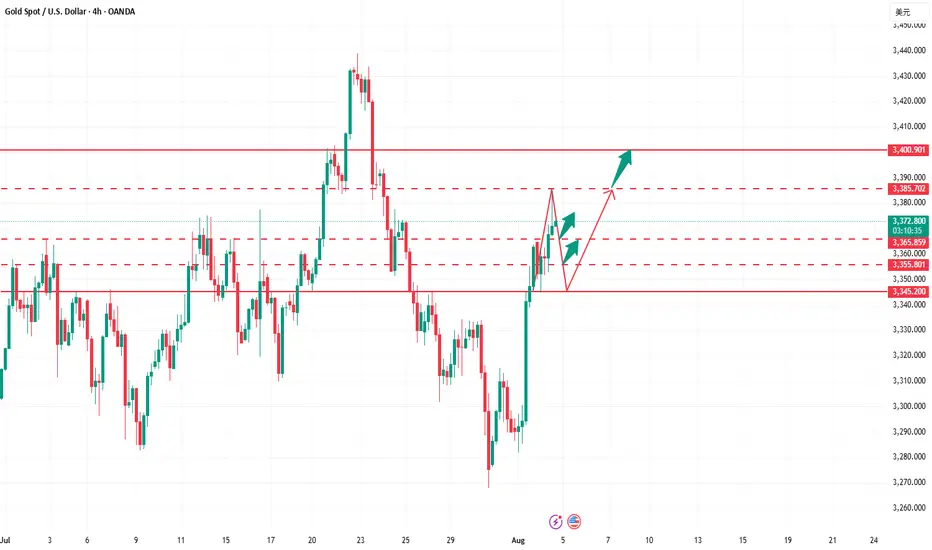
Gold price analysis week 32The recently released Nonfarm data has become an important catalyst, officially breaking the previous bearish wave structure and shaping a completely new uptrend for gold prices. Breaking above the wave 1 peak at the 3315 area is a clear confirmation signal that the downtrend has ended.
In that context, the trading strategy for next week should prioritize buying orders. This rally has the potential to push gold prices to historical peaks if the bullish momentum is maintained with stable trading volume.
Specific trading strategy:
Important support zone: 3333 – 3315
Short-term resistance zone: 3373 – 3416

GOLD AGAINGold hit our BE, and still believe for sell to buy...We re-entered shorts. We trust still setup

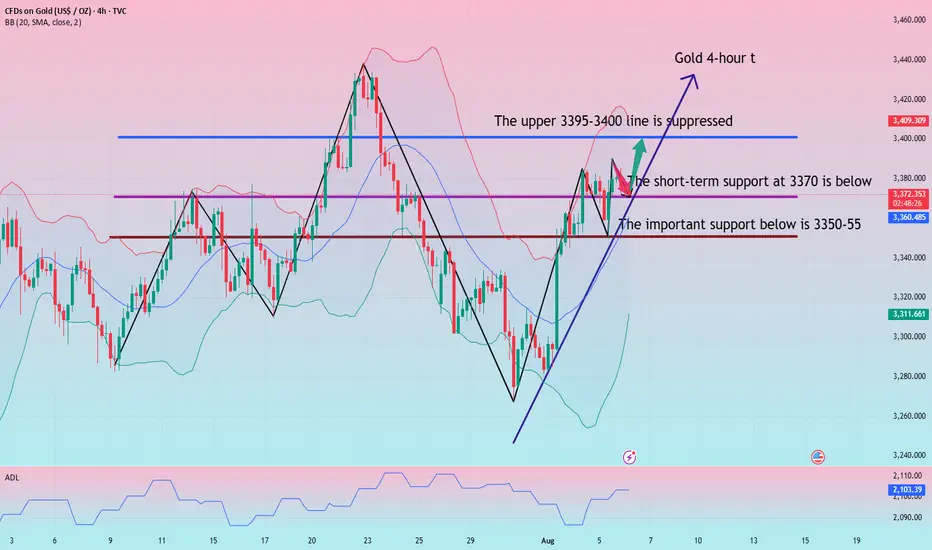
Today's bulls sprint to 3400
Based on the 4-hour chart, short-term support is currently at 3370, with 3350 being the dividing line between bullish and bearish strength. If the daily chart stabilizes above this level, the bullish trend remains unchanged. However, caution should be exercised when entering short positions against the trend until the daily chart breaks below 3350. I will update you on the specific trading strategy during the trading session.
Gold Trading Strategy:
Go long on gold dips to 3370-73, and add to your long position on dips to 3350-55. Set a stop-loss at 3343, and target 3390-3395. Hold if it breaks above this level.
Gold Market Insight – Daily FlowGold market mitigated daily supply at 3389, triggering a price plunge aimed at clearing imbalance through the 3332 zone. This move reflects the bearish reaction to overhead supply and the market’s intent to correct inefficiencies before any potential reversal.
🟡 Key Zones:
Supply Mitigated: 3389
Imbalance Targeted: 3332
Watch for: Buyer reaction near 3332 for signs of bullish defense or continuation toward lower demand zones. follow for more insights , comment and boost idea

Gold - Breakout and retest of a bullish FlagBullish flag break out and price is in a demand zone. As long as the demand holds, pressure will be to the upside.

August 4, 2025 - XAUUSD GOLD Analysis and Potential OpportunitySummary:
Gold is currently in a sideways-to-bullish structure. Strong resistance remains around 3440–3450; if this level fails to break, it offers a high-probability shorting opportunity. Near-term focus is on the 3350 support level — if it breaks, bearish momentum may pick up and selling the pullback becomes ideal. If 3350 holds, consider buying the dip and targeting a test of 3375. Stay flexible and responsive to price action at key levels. Manage risk accordingly.
📍 Key Levels to Watch:
• 3400 – Resistance
• 3384 – Resistance
• 3375 – Key resistance
• 3365 – Resistance
• 3350 – Psychological level
• 3345 – Support
• 3334 – Key support
• 3323 – Support
• 3310 – Support
📈 Intraday Strategy
SELL if price breaks below 3350 → target 3340, then 3334, 3323, 3315
BUY if price holds above 3365 → target 3370, then 3375, 3384, 3394
👉 If you find this helpful or traded using this plan, a like would mean a lot and keep me motivated. Thanks for the support!
Disclaimer: This is my personal view, not financial advice. Always use proper risk control.

Analysis For The Next WeekHello Traders,
I hope you had joyful weekend, the market is going to open tonight so we are back with new idea for next week.
As you know gold was dropping for last two weeks and suddenly pumped almost 650 pips after the impact of NFP News. We saw the high pressure in the market on Friday due to news impact.
Gold has broken the buy trend line D1,H4. According to D1,H4 gold still wants to drop till 3251.
If price respects area 3372-3393, then gold will drop. If price breaks the area 3400 then it will pump and it can make another All Time High. As you know 3501 is the All Time High (ATH). Price can break if there will be a breakout for bullish moment.
Keep in touch and drop positive comments here, Thanks.

Gold Trend Reversal: MSS Completed Eyes on OB and Breaker Block!The gold market has executed a Market Structure Shift (MSS) in the New York session, indicating a trend reversal. Initially, the market made a Break of Structure (BoS) to the upside, but later dropped sharply and closed below the MSS level, confirming a bearish shift. Currently, the market is likely entering a retracement phase and may look to fill its Pending Demand (PD) arrays.
There are two critical levels from which the market could potentially drop again:
1. The first is an Order Block (OB).
2. The second is a Breaker Block (BB).
Keep a close watch on these two levels. If the market returns to either and presents bearish confirmation signals, it could resume the downward move towards swing lows.
Do Your Own Research (DYOR).

Strike with precision and win in the gold trading market!Gold continues to fluctuate in an upward structure, with lows gradually rising, showing that the bulls are still in a dominant position. The current key support has moved up to the 3360 line. Before this position is effectively broken, the overall idea is to maintain a low-long strategy. It should be noted that the current market has been consolidating at a high level for three consecutive days, and has the basis for further strengthening. It is not advisable to wait for a sharp pullback at this time, but to pay attention to the continuity opportunities of direct pull-ups. It is recommended to seize the strong continuation opportunities in the current period in terms of operations, and strategically postpone it to the European and American trading sessions for simultaneous execution. Specifically pay attention to the long order layout opportunities in the support area of 3375-3360, and the upper resistance is around 3390-3405. Overall, we should flexibly participate in the high-altitude and low-long rhythm in this range. It is recommended to wait and see in the middle position, chase orders cautiously, and wait patiently for key points to enter the market.

The best ambush point for short positions below gold 3400.The daily structure of gold still maintains a bullish dominant pattern. The upper target is the upper Bollinger band of 3400. If it breaks through this position, the upside space will be further opened up. The 4-hour Bollinger band is gradually closing, and the price is fluctuating in the range of 3400-3360. In the short term, it is still treated with range thinking. Before an effective breakthrough, the operation can adopt a high-altitude and low-long strategy. Gold is currently at a critical node of change. If it rises and falls in the evening, it may release a temporary peak signal. The area below 3400 is expected to become an opportunity for the layout of medium-term short positions. The overall recommendation is to remain cautious, respond flexibly to changes in rhythm, and strictly control risks.
Gold operation suggestion: You can continue to try short selling in the 3390-3400 range, with the target at 3380-3370.

XAUUSD - Short XAUUSD Short Trade Idea – 4H Chart
Price has made a strong move up, but it's now entering an area where sellers were in control before.
Why I'm looking to short:
Price is retesting a supply zone where the last big drop started
It’s also near a resistance level and rejected from there
The downtrend is still valid with lower highs
There's a good chance price could drop to grab liquidity below
*** Target areas:
First target: around 3288
Final target: around 3250, where we have a demand zone
*** Invalidation:
If price breaks and closes above 3385, this short idea is no longer valid.

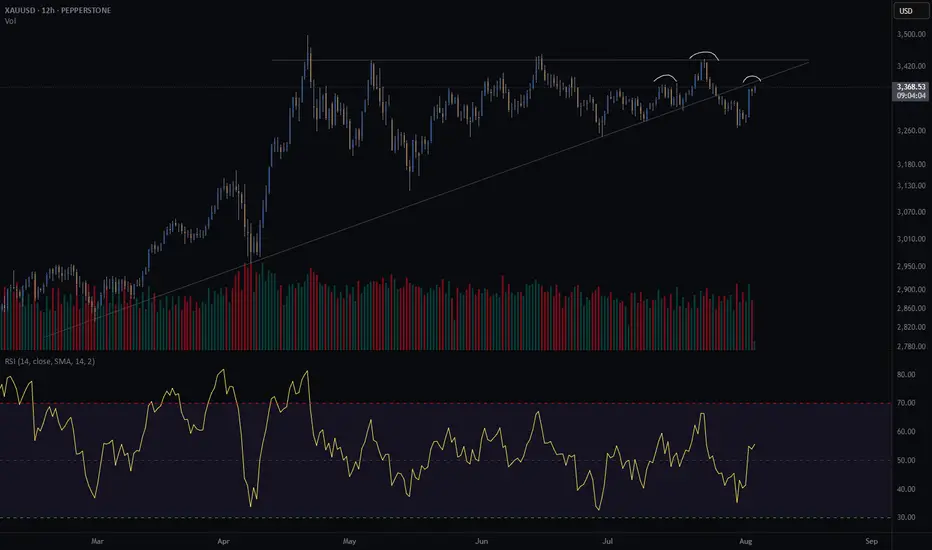
Gold crash (SHORT) - head and shouldersGold is at an interesting crossroad.
It broke through its diagonal support on Friday the 25th of July.
Price is retesting previous support. Does it turn into resistance?
Further confluence is a head and shoulders of the H8 and H12, with the right shoulder coinciding with the retest of the diagonal.
Since I am long gold with my investments, I am hesitant to short gold through my trading business. However, if my pattern is available, I take the trade. This will be a very short term trade - a few days at most if the trade goes in my favour.
Risk/reward = 12.6
Entry price = 3382.5
Stop loss price = 3396.2
Take profit level 1 (50%) = 3230
Take profit level 2 (50%) = 3181
The risk reward is exceptionally high. However, I have taken a more conservative approach with my entry because of my apprehension to short gold. For this trade I will enter at the extreme end of the range in which I will look for entries. This is the reason for such a high RR. It might result in me missing an entry.
Grasp the trend accurately and have a crazy weekend!After testing the 3380 support level several times in a row today, gold maintained an oscillating upward trend. Today's layout of 3380 repeatedly went long, and 3400 shorts were all successfully closed with profits, with a total profit of 580pips. Currently, gold is oscillating at a high level in the 3404-3380 range. The possibility of a direction choice cannot be ruled out in the evening. If the market continues to be bullish in the evening, it is necessary to pay attention to whether the price will fall below 3380 when it tests the support level for the third time. If the support level is effectively broken, it is expected to fall to the key support level of 3370. If the price firmly stands above the 3400 mark, it may continue to test 3410. If there is no breakthrough either above or below, it will still maintain a range of oscillations, and the idea of selling high and buying low will be the main focus.

XAUUSD 8/4/25 followupPrice closed strongly above Sunday's open so I am just looking for retracements to the upside from here.

Gold: Stalemate Situation – Is a Bullish Wedge Brewing?Hello everyone. Lucas here! I am back to update and discuss with you.
Yesterday, gold once again reversed from the resistance level of 3,400 USD. However, a vague "bullish wedge" pattern is forming on the chart...
Gold price has dropped from its two-week high due to profit-taking. The correction was intensified after the United States imposed tariffs on imported gold bars (1 kg), which could disrupt supply from Switzerland and London.
Key supporting factors: Weak U.S. employment data and expectations that the Fed will cut interest rates in September are putting significant pressure on the USD, making gold more attractive to investors seeking a safe-haven asset.
Risk: Short-term volatility ahead of U.S. CPI data next week. However, the underlying bullish momentum remains intact.
The issue with the bullish wedge pattern is that it forms a vague shape. We have an upward movement, but this pattern could easily reverse the local bullish trend due to the difficult resistance zone at 3,390-3,410.
Currently, the lower boundary of the wedge is acting as support. If the price holds above this level, the main scenario remains a bullish move towards the 3,433 to 3,450 USD resistance zone. On the other hand, if the support of the wedge pattern is broken, the price could return to the 3,350 USD level before the bullish trend resumes.
Hope you like this analysis and don't forget to follow and share to get the latest information!
Good luck!

How to accurately capture golden trading opportunities?Bullish trend is still the main trend of gold at present. After rising to 3368 at the opening today, it fell under pressure and fluctuated. Technically, it has tested the pressure level and needs to be adjusted. The overall high-level carrying capacity has also declined, so it is not advisable to chase the rise too much. In terms of operation, it is recommended to wait for the price to stabilize before buying more. Judging from the current gold trend, the upper short-term resistance is in the 3380-3385 area, and the key pressure is at the 3395-3400 line; the lower short-term support is in the 3365-3355 area, and the key support is in the 3350-3345 range. The overall suggestion is to arrange long orders on dips around the support area, and try to maintain a stable wait-and-see attitude in the middle position. I will prompt the specific operation strategy at the bottom, please pay attention in time.
Gold Trading Strategy: Buy in batches as gold retreats to the 3365-3350 area, targeting the 3380-3385 area. If this resistance zone is broken, hold and look for upward movement.
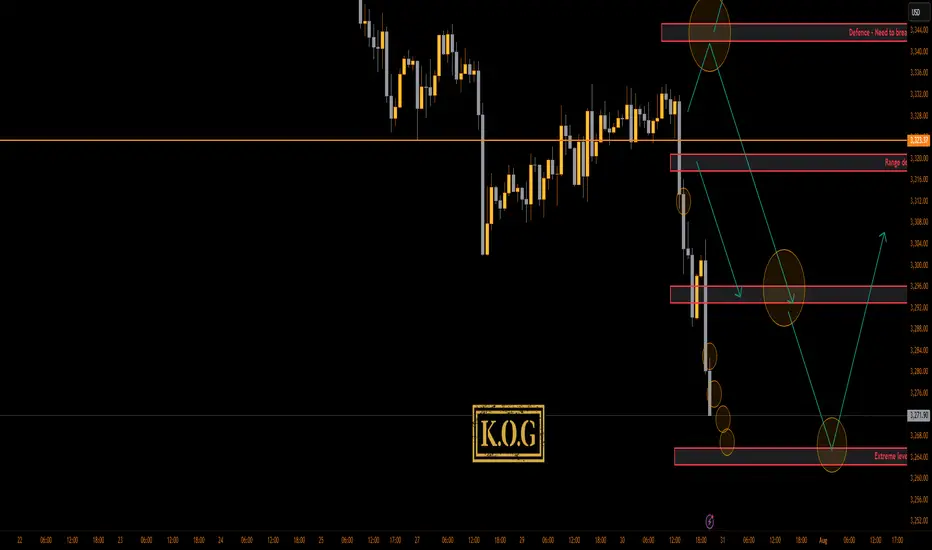
THE KOG REPORT - UpdateEnd of FOMC Update:
Thank you.
RED BOX TARGETS:
Break above 3335 for 3338, 3340, 3345, 3347 and 3357 in extension of the move
Break below 3320 for 3310✅, 3306✅, 3302✅, 3297✅ and 3393✅ in extension of the move
Please do support us by hitting the like button, leaving a comment, and giving us a follow. We’ve been doing this for a long time now providing traders with in-depth free analysis on Gold, so your likes and comments are very much appreciated.
As always, trade safe.
KOG