Gold - M30 Buy SetupOANDA:XAUUSD TVC:GOLD
Timeframe: m30
Risk Level: Low-Medium
🔹 Setup:
Price is testing the boundary of the ascending channel and retesting the support @ 3350
📈 Entry:
Current price zone: 3360-65
🎯 Targets (TP):
TP1: 3375
TP2: 3385
TP4: 3410
TP6: 3430
⛔ Stop Loss (SL):
3349
H4 Overview:
PEPPERSTONE:XAUUSD
#XAUUSD #GOLD #Buy #Signal #MJTrading
Psychology Always Matters:
XAUUSD trade ideas


XAUUSD Gold Trading Strategy August 7, 2025XAUUSD Gold Trading Strategy August 7, 2025:
Gold prices are steady as US President Donald Trump has imposed an additional 25% tariff on Indian goods due to India's continued purchases of Russian energy. This new measure raises the current 25% tariff on Indian goods to 50%.
Fundamental news: The current market pulse is still mainly revolving around the tariff story initiated by Trump, in which spot gold is trading in a fairly narrow range. Gold is still waiting for further impact from the Fed's interest rate cut process, a weaker dollar will create support for non-yielding gold.
Technical analysis: The trading range of gold prices is currently narrowing, RSI on H1 and H4 frames is approaching the overbought zone. Gold prices have recovered, but resistance zones such as 3400 - 3405 and 3420 - 3425 can be short-term profit-taking areas for investors. Liquidity zones and Fibonacci frames show that the upward force of gold prices is showing signs of slowing down.
Important price zones today: 3373 - 3378, 3400 - 3405 and 3420 - 3425.
Trading trend today: SELL.
Recommended orders:
Plan 1: SELL XAUUSD zone 3402 - 3404
SL 3407
TP 3399 - 3390 - 3380 - 3360 - OPEN.
Plan 2: SELL XAUUSD zone 3423 - 3425
SL 3428
TP 3420 - 3410 - 3390 - 3370 - OPEN.
Plan 3: BUY XAUUSD zone 3373 - 3375
SL 3370
TP 3378 - 3388 - 3400 (small volume).
Wishing you a safe, successful and profitable trading day.💗💗💗💗💗

Gold Trading Opportunity
---
### ⚡️ **– Harmonic Setup You Don’t Want to Miss**
🚨 **"We’re standing at the edge of a golden reversal!"**
The *Gartley* and *Deep Crab* harmonic patterns have formed with stunning precision, signaling a powerful potential drop*. This level is not just a number—it’s a pressure point where a reversal pattern converges with a high-volume **supply zone**, amplified by a strong **RSI overbought signal**.
💼 With disciplined **risk management** and clearly defined **stop-loss and multi-tier targets**, we’re positioning ourselves for a calculated and confident short move.
This is not guesswork—it’s a textbook setup backed by structure, momentum, and sentiment.
🔥 Don’t chase the market. Let it come to you. This setup rewards patience and precision.
---

Gold Technical Analysis - Bullish Momentum or Pullback Ahead?Gold (XAU/USD) is trading around $3,371, showing a bullish bias within an ascending channel. Price is consolidating below key resistance at $3,384, and a breakout above this level could lead to a rally toward $3,400–$3,429. On the downside, support lies at $3,340 and $3,312; a break below these could trigger a deeper pullback toward $3,268. The trend remains bullish above $3,340, with buy interest expected on dips, while a confirmed breakdown below $3,268 would shift momentum in favor of bears.
🔑 Key Levels to Watch:
- Resistance: $3,384 → $3,396 → $3,429
- Support: $3,360 → $3,340 → $3,320
📈 Potential Scenarios:
- Bullish: If gold holds above $3,340 and breaks above $3,384, it may rally toward $3,400–$3,429, with potential to reach $3,450+. This keeps the uptrend intact.
- Bearish: If rejected from $3,384, gold could dip to $3,340–$3,312 for a healthy correction before possibly bouncing again. Trend remains bullish unless lower supports break.
📊 Trend Outlook:
- Short-Term Trend: Bullish while inside or above the rising channel
- Medium-Term Trend: Neutral to Bullish; watch for breakout confirmation above $3,384
- Momentum: Consolidating, with potential for a breakout after current sideways structure
Note
Please risk management in trading is a Key so use your money accordingly. If you like the idea then please like and boost. Thank you and Good Luck!

Gold Trading Strategy August 8XAUUSD – Bullish Breakout from Triangle Pattern
Gold has officially broken the upper boundary of the triangle accumulation pattern, confirming the continuation of the uptrend. This bullish momentum is heading directly towards the 3430 area, and if the buying pressure is maintained, the 3445 level is completely within reach.
Today is Friday, the closing day of the weekly candle, so the oscillation amplitude is usually stronger and the price can easily approach new peaks. Observation shows that the buying pressure in the US session has been maintained continuously in recent days - this supports the strategy of BUYing now and holding until the US market opens.
Support zone: 3385 – 3365 – 3333
Resistance zone: 3419 – 3431 – 3445
Gold targets 3430 - Bulls in controlHello IGT FOLLOWERS
Here is my Gold overview, From last couple of days gold is respecting the trend line very well in the upwards, Gold is now working on a trend line's support area around 3382/3376. Indicating strong bullish momentum. A break of 3410 could confirm further upside till 3430..
Key points :
Entry point : 3381
Support Area : 3382/3376
Follow me for more latest updates and signals

#XAUUSD ALMAZOV PROJECTION D1 - H1In daily trading, the price is in its fifth bullish nesting, not yet breaking through the start limit, but pushing for a breakout-type bullish trend. We move down to H1 to look for continuation bullish cycles.
On H1, the second bullish nesting, OK, the trident formation, point 5, bounces off Shum. Therefore, we look for a rebound from the downward swing, starting and F61.8 zones for buys, SL at X.

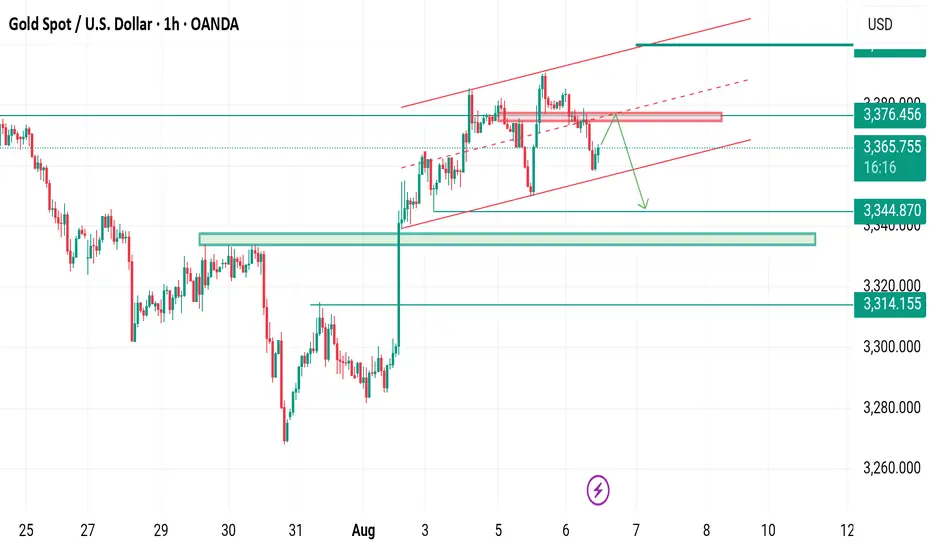
XAUUSD → Correction before a Breakout and RallyGold (XAUUSD) is expected to pull back slightly before making a bigger move up. Right now, it’s facing some resistance, so a small drop is likely. But the long-term trend remains bullish due to factors like possible Fed rate cuts and global uncertainty. After this correction, gold could break higher. Traders should watch for buying opportunities near support levels. The strategy is to "buy the dip" for a potential rally later.
Read the chart for entry and exit points
Do your own research before making any decision of Buying or selling trade in gold as market is more volatile...
This is not a financial advise to trade and this is just an educational purposes

XAUUSD LongElite Analysis (Published this after execution)
Price took previous session low
Went to lower time frame to look for confirmations to upper liquidity pools
Confirmed 10m BOS
Found a 1m OB
Checked all confirmations and executed
Targeting upper liquidity pools
XAUUSD / GOLDPOTENTIAL sell setup during newyork session .
sell zone: 3365-3368 //3368-3372
potential target: friday opening price or friday daily low
not financial advice. follow at own risk.. Don't all in.

XAUUSD needs retest before swing highM30-H1 TIMEFRAME SETUP
Currently we have range of 3345-3380 area also we have proper CHOCH on H4 at 3335 support area
What possible scenarios we have ?
• If market remains low 3372-3378 then you can scalp a sell trades towards 3360-3350 area which I take sell with minimal risk.
• secondly I wait for drop to my Buying area where I will buy XAUUSD in dips and my optimal target will be 3402-3410.
Additional Tip:
Market is on bullish Bias ,above 3385 no sell Trade .
#XAUUSD
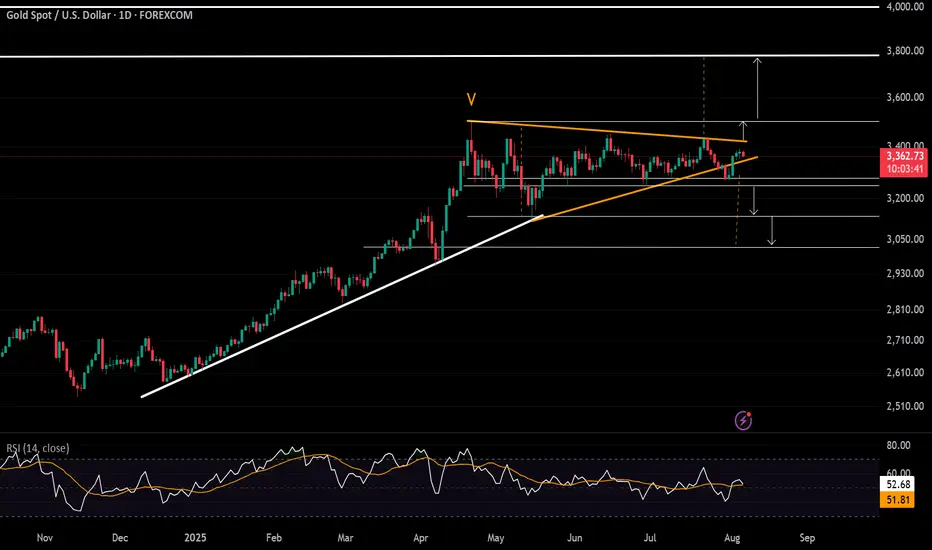
Will Gold Break Out on Tariff and Fed Uncertainty?Gold’s price action is currently fluctuating above the trendline connecting higher lows from May 2025, potentially aiming for the trendline from December 2024, which aligns with the 2025 peak at 3,500.
A firm hold above the 3,400 and 3,450 levels could accelerate a move back toward the 3,500-record, with potential for further gains toward new highs at 3,780 and 4,000, respectively.
On the downside, a close below 3,340 may lead to a pullback to 3,280 for a possible rebound, or even a deeper retracement toward 3,230 and 3,130.
- Razan Hilal, CMT
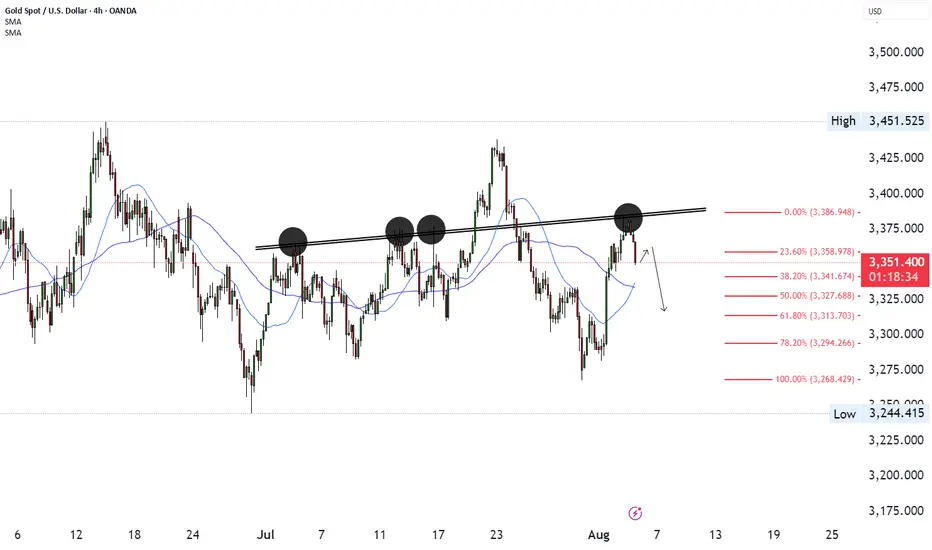
XAUUSD 3300 NEXT?#XAUUSD With that massive rejection off the resistance! 🔴
My Next targets for this correction are 3341 and 3327.
If this gets driven by some catalyst, then we might see 3313 and even 3293 depending on the strength!
GOLD Will Go Up! Buy!
Take a look at our analysis for GOLD.
Time Frame: 2h
Current Trend: Bullish
Sentiment: Oversold (based on 7-period RSI)
Forecast: Bullish
The market is approaching a key horizontal level 3,372.49.
Considering the today's price action, probabilities will be high to see a movement to 3,395.61.
P.S
Please, note that an oversold/overbought condition can last for a long time, and therefore being oversold/overbought doesn't mean a price rally will come soon, or at all.
Disclosure: I am part of Trade Nation's Influencer program and receive a monthly fee for using their TradingView charts in my analysis.
Like and subscribe and comment my ideas if you enjoy them!

GOLD M15 OUTLOOKAccording to M15 analysis gold market going in buy from today now market running in side wave from last few Hours now wait for good opportunity market will be touch SUPPORT ZONE you can buy from there dont be greedy use money management
TRADE AT YOUR OWN RISK
REGARD ALBERT

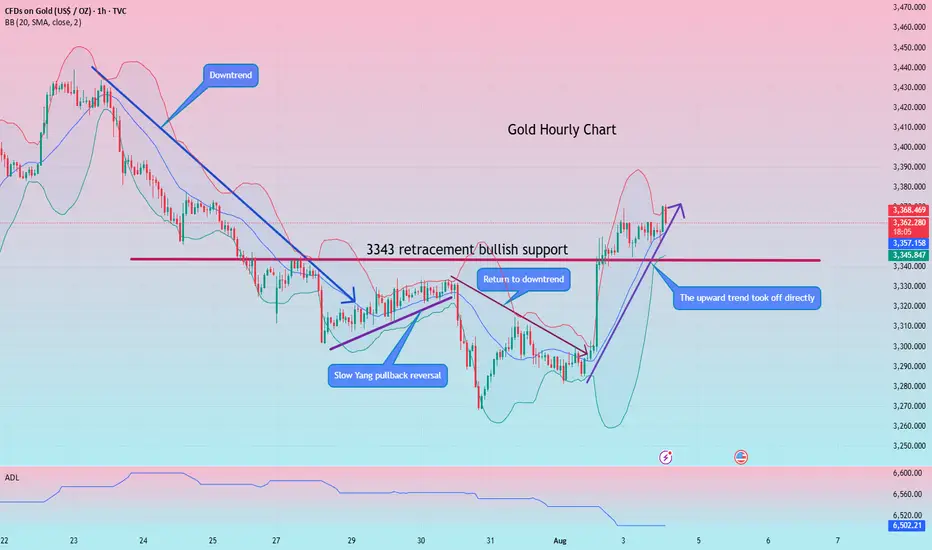
Gold is rising slowly, so can we adjust our direction?
When we first entered the market, we saw slogans everywhere, such as "Investing is risky, enter with caution." However, few people actually put this into practice. In the gold market, risk control comes first, followed by investment mentality, and finally, trading methods and strategies. Only by protecting your principal can you achieve profitability; otherwise, everything is just empty talk.
A logical explanation for gold's medium-term upward trend!
Gold rebounded sharply last Friday due to the weaker-than-expected US non-farm payroll report, and the market quickly adjusted its expectations for the Federal Reserve's policy direction, shifting to a more dovish stance. Although the market reaction seemed to indicate very weak data, the overall situation was not as bad as expected. The problem is that the market had previously bet on strong data, and pricing in a more hawkish outlook following the Fed's interest rate meeting has led to even weaker data, so even slightly weaker data could trigger a rapid repricing.
Next, the market's focus will turn to key economic data and speeches by Federal Reserve officials, particularly in the run-up to the September FOMC meeting. As long as incoming data remains benign, Fed Chairman Powell is expected to open the door to a September rate cut at the Jackson Hole annual meeting. From a broader perspective, gold is expected to maintain its upward trend as real interest rates are expected to continue declining. However, a short-term correction is still possible if interest rate expectations become hawkish.
A Gold Trend Perspective!
Unfortunately, gold prices only reached a low of 3350 today before rising again. With no signs of a pullback near the US market close, our bullish dip buying opportunity at 3343 is somewhat difficult to enter. It appears that the upward trend will continue to test the key resistance level of 3380. If there are no dip buying opportunities, consider shorting!
The current hourly chart has broken through the support level, leading to a choppy morning session. The upward trend is likely to test the resistance level of 3380, while the support level of 3350 is key today. For the time being, we will use this range for range trading in the evening session. If there are any further market fluctuations, we will provide a new strategy in real time!
Gold: Short around 3380-82, defend at 3390, target at 3352-55! If it retreats back to around 3350 but does not break through, you can enter a long position!
Gold long: Completion of Cycle degree Wave 4Hello, in this video, I go through Gold Elliott Wave structure on a cycle level (again) before zooming in on the latest 5-waves structure that is Cycle level wave 4. I talk about using existing broken trendlines and how that allows me to determine the strength of a move when there are false breakouts, whether to the upside or the downside.
Lastly, I discuss on how to trade this on the short-term using lower timeframe and price action. Most importantly, where to set the stop and the rationale for it.
Good luck!

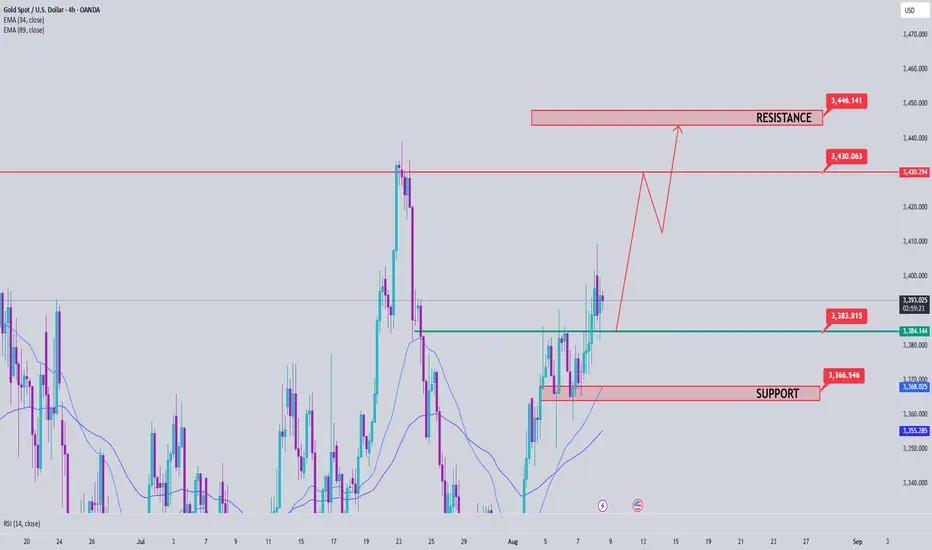
XAUUSD 4H SMART MONEY CONCEPT ANALYSIS Market Structure Overview:
Price recently swept sell-side liquidity below the 3280s area and reacted from a 4H demand zone. We are now seeing a bullish retracement into a higher time frame premium zone (red supply area).
🔍 Key SMC Concepts Applied:
✅ Liquidity Sweep – Price grabbed liquidity below the 3280 support (equal lows), then aggressively pushed up.
✅ Breaker Structure (BOS) – Minor bullish BOS formed as price broke short-term highs after the liquidity sweep.
✅ Market Inefficiency – There’s a fair value gap and imbalance between 3,380 and 3,420.
✅ Supply Zone in Premium – Red zone (3,400–3,430) marks a previously unmitigated 4H supply area. Ideal zone for smart money to re-enter shorts.
📌 Current Expectation:
We expect price to tap into the red premium zone, where:
Liquidity above recent highs will be engineered and swept.
Institutional orders are likely resting for short entries.
Price may reverse sharply from that level, targeting the unmitigated green demand zone at 3,200–3,220.
💡 Entry Plan (Sell Setup):
🔼 Wait for price to trade into 3,400–3,430 supply.
🔁 Look for change of character (CHOCH) on lower timeframes (15M or 1H).
🔻 Enter short on confirmation.
🛑 SL: Above 3,435 (just beyond the liquidity).
🎯 TP1: 3,280 (structure level).
🎯 TP2: 3,200 (discount demand zone).
🕒 Timeframe Reference:
4H for overall structure, confirmation on 15M/1H after supply tap.
🧲 Liquidity Map:
Buy-side liquidity above 3,390s (target for bulls before reversal).
Sell-side liquidity resting below 3,250 and deeper around 3,200.
🔑 Summary:
"Smart money is driving price back into premium for efficient distribution. Bears are likely to step in after liquidity is swept above recent highs. Patience is key—let price reach your area of interest before executing."
#XAUUSD #SMC #SmartMoneyConcepts #LiquiditySweep #SupplyAndDemand #GoldAnalysis #InstitutionalTrading #PremiumToDiscount #TradingView

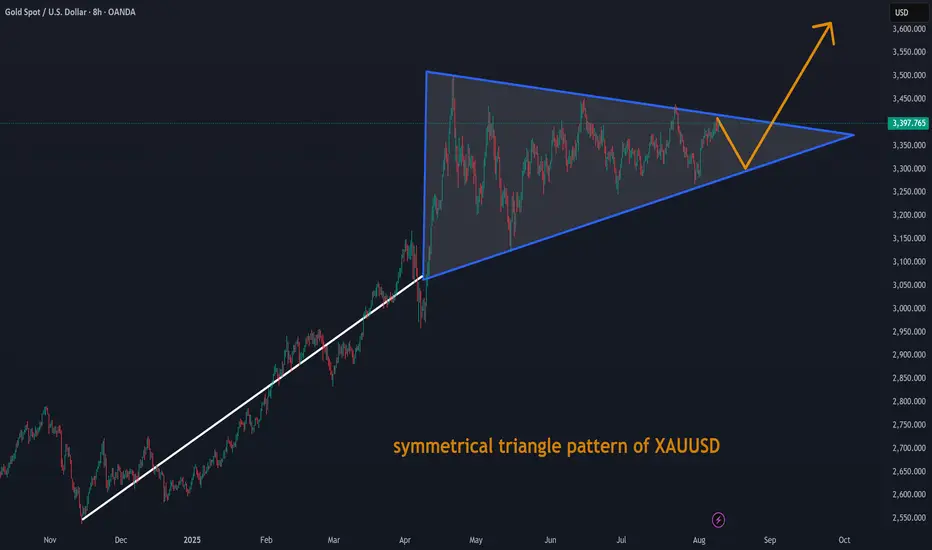
symmetrical triangle pattern of XAUUSDsymmetrical triangle pattern of XAUUSD. It is consolidating in narrow area within Trangle.
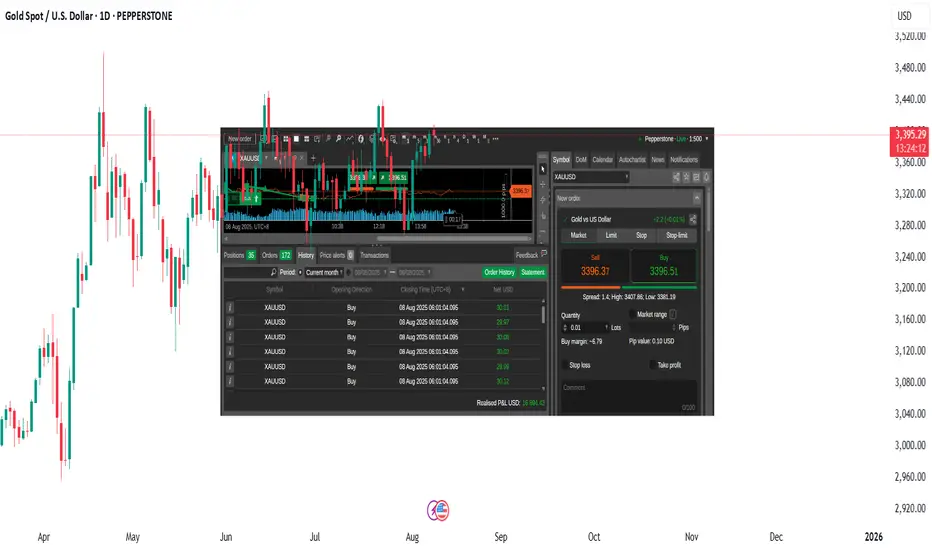
Up 16K USD Profit For The Month On XAUUSD Momentum TradingXAUUSD is again making these ranges as it goes up. If you can identify these ranges then you can do a short trade on the resistance levels and a long trade on support levels. XAUUSD is trending up overall but if you are a trend-follower then you will have a hard time timing your entries just because of the ranges XAUUSD is making. It will go up to 3,400 then go back down to 3380 then back again to 3,400 then down again to 3375. Momentum trading is the best approach. You short the tops. Go long on bottoms. Get in, get out. I currently have 16,894 usd realized profit on XAUUSD this month doing momentum trading. I'm trading a live account. FED will probably cut rate soon and there will be a lot of bullish predictions on XAUUSD but I highly suggest to just trade the chart. Do not have any opinion on where the market or the price will go. Let the price move and just react. No one can predict the market. Trade your chart. May you trade well.
Gold Consolidates at High Levels. Waiting for a New Trend?Gold barely held the 3360 level on Wednesday and will remain in the 3360-3380 consolidation range outlined by Quaid.
Quaid considers Thursday to be a more important day. From a timing perspective, today may impact whether gold can continue its upward trend. However, it is possible that the market could continue its consolidation today. One thing is that the daily line must close above 3360, then the subsequent rise in gold will continue.
On the contrary, if it closes below 3360, then the rise will definitely not be able to continue in the short term. In the short term, gold may remain above 3370 today.
We can see that 3375-3370 is an important support, but the daily line has not yet stabilized above 3380, so the upward space has not yet been opened. If the daily chart can stabilize above 3380, then a test of 3400-3410 is in the cards.
Trading strategy:
Buy between 3365-3370, stop loss at 3355, profit range 3380-3390-3400.
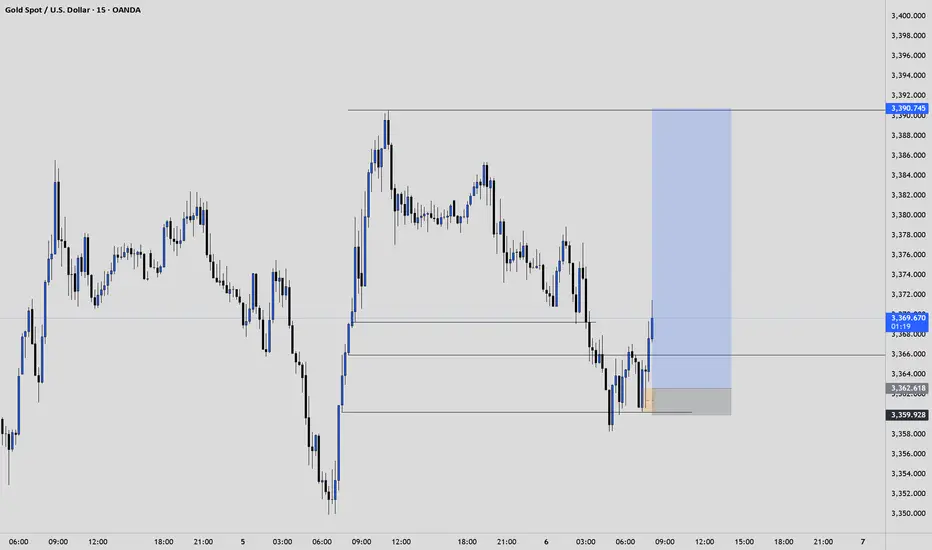
Gold XAUUSD Analysis 06.08.2025Entry: 3373–3378 (on retracement into 1H supply zone)
Stop Loss: 3385 (above recent swing high)
Take Profit: 3352 (targeting previous low / 1H demand)
Bias: BearishRRR: ~2.5:1
Analysis:
Price showed strong rejection from the 3373–3378 supply zone. Expecting a pullback into this area before continuation lower. Bearish structure remains intact with clean lower highs. Plan is to sell the retracement, with SL above 3385. Targeting 3352, which aligns with prior demand and liquidity.
Kindly show support by following liking and commenting your favourite pair for analysis.
