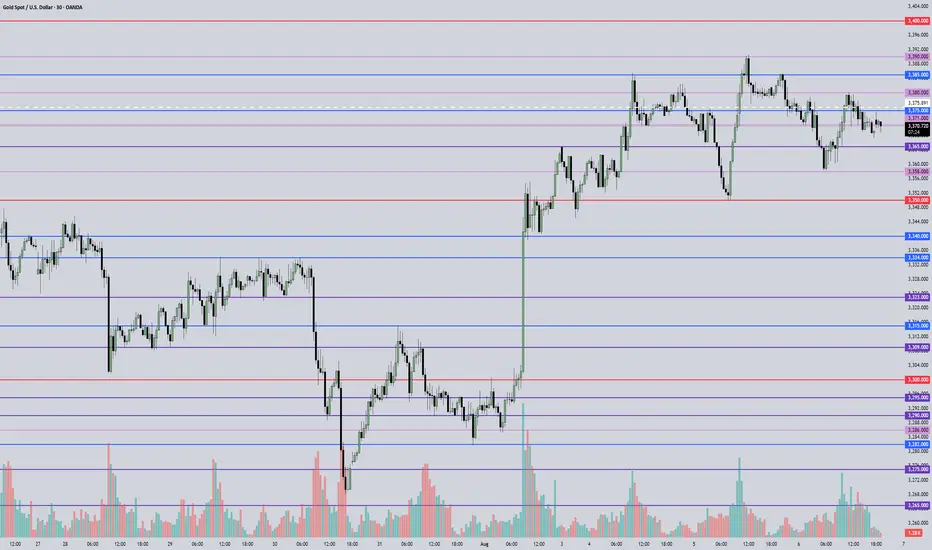
XAUUSD Gold Trading Plan – Monday, 4th August 2025 (M30 TF)Strategy Type: Intraday Trend Trading (Buy-the-Dip)
Timeframe: 30-Minute (M30)
Market Bias: Bullish
Execution Style: Step-Ladder Scaling into Strength
🧠 Market Outlook
Gold remains in a bullish trend structure, supported by geopolitical risk, moderate inflation sentiment, and the weakening US Dollar. While Friday showed signs of short-term exhaustion, price is still forming higher lows on the 30-minute chart, suggesting intraday momentum remains to the upside.
Based on current price action and Fibonacci retracement levels, I expect a healthy pullback early Monday before a push towards new short-term highs. I will be trading in phases — buying on dips and scaling out at each resistance zone.
✅ Phase 1: Buy on Dip at 3352 (Key Support Zone)
Entry Zone: 3352
Reasoning:
3352 lines up with M30 demand zone (previous accumulation area)
61.8% Fibonacci retracement of the last M30 bullish swing
Likely to act as intraday support if price retraces from current levels
Confirmation:
Strong bullish candlestick reversal (e.g. bullish engulfing, hammer, or rejection wick) on M30
Volume uptick or bullish divergence on RSI preferred
Stop Loss:
Just below 3346 (below the last valid swing low to protect the trade)
🎯 Target 1: 3361
Why: This is the first intraday resistance and previous minor high on M30
Action:
Secure partial profits (~50%)
Move SL to breakeven or +5 pips to protect capital
Wait for next retracement
✅ Phase 2: Wait for Pullback After 3361
Retracement Zone: Expected dip to 3356–3358 area (new higher low)
Re-Entry Condition:
Retest of breakout level with strong bullish candle on M30
Maintain bullish market structure
🎯 Target 2: 3370
Why: This is the next resistance zone and price magnet based on Friday's volume profile
Action:
Secure additional 30% profit
Trail SL below structure (~3362)
✅ Phase 3: Wait for Final Dip Before Final Push
Retracement Zone: Around 3364–3366 (support flip area)
Re-Entry Condition:
Rejection of this zone with continuation pattern (bullish flag, ascending triangle)
🎯 Target 3: 3379
Why: 3379 is near the top of current intraday channel and strong resistance on 4H/M30
Action:
Close all remaining positions
Assess for potential breakout above 3380 only if momentum is strong
⚠️ Risk Management Plan
Max Risk: 1.5% account risk split across 3 phases (0.5% per entry)
All SLs defined before entry — no averaging down
Trades invalidated if price breaks and closes below 3346 on M30
🔁 Summary Table
Entry Level Target Action
Buy @ 3352 TP1 = 3361 Secure partial profit, trail SL
Re-buy ~3356–3358 TP2 = 3370 Secure partial profit, trail SL
Re-buy ~3364–3366 TP3 = 3379 Close full position
🧭 Other Key Watch Points
DXY: Watching for rejection below 104.60 – bullish for Gold
News Events: Low-impact day; watch for any unscheduled Fed speakers
RSI + Volume: Using RSI (14) and OBV to confirm entry strength on M30
XAUUSD trade ideas

Gold scalpWell, considering the Sharpe decline we had, it is likely that this channel will break and we will fall to the specified level.

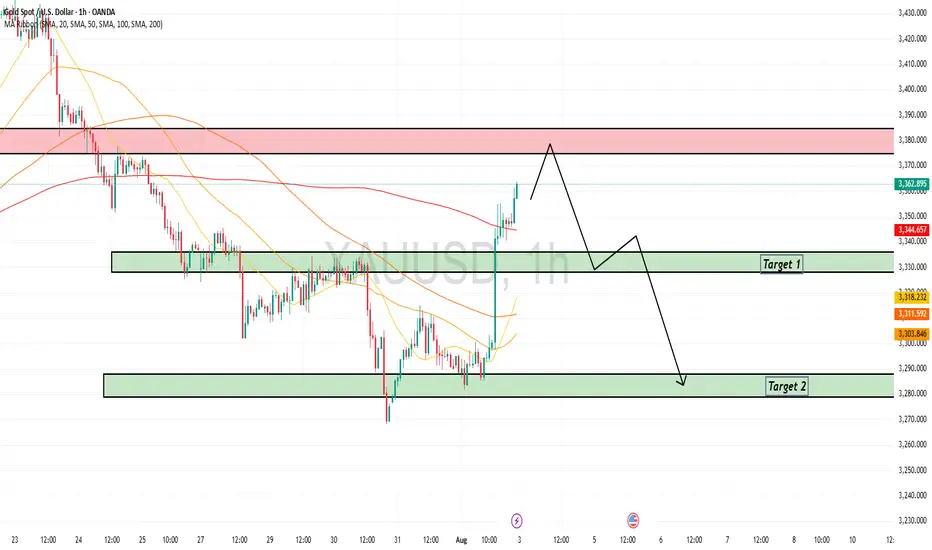
GOLD BEARISH BIAS RIGHT NOW| SHORT
GOLD SIGNAL
Trade Direction: short
Entry Level: 3,377.31
Target Level: 3,327.89
Stop Loss: 3,409.93
RISK PROFILE
Risk level: medium
Suggested risk: 1%
Timeframe: 9h
Disclosure: I am part of Trade Nation's Influencer program and receive a monthly fee for using their TradingView charts in my analysis.
✅LIKE AND COMMENT MY IDEAS✅

August 7, 2025 - XAUUSD GOLD Analysis and Potential OpportunitySummary:
Price action today is likely to stay within the 3358–3385 consolidation zone. Inside this range, the strategy is to sell near the top and buy near the bottom. Watch 3365 — if it breaks, look for short opportunities on pullbacks; if 3375 holds, look for long setups on dips. Overall, the support and resistance levels are cluttered, suggesting potential choppy moves. I’ll only act on very clean setups near key levels. If they don’t form, I’ll stay on the sidelines. Protect your capital and trade smart — good luck!
📍 Key Levels to Watch:
• 3405 – Resistance
• 3400 – Psychological resistance
• 3390 – Key intraday resistance
• 3375 – Resistance
• 3365 – Support
• 3350 – Psychological support
• 3345 – Support
• 3334 – Support
📈 Intraday Strategy
SELL below 3365, targeting 3358, then 3350, 3345, 3340
BUY above 3375, targeting 3380, then 3385, 3390, 3394
👉 If you find this helpful or traded using this plan, a like would mean a lot and keep me motivated. Thanks for the support!
Disclaimer: This is my personal view, not financial advice. Always use proper risk control.
GOLD 8/7/25Head and shoulders pattern forming. Waiting for price to create LLs and LHs before taking an entry. Once we get a bearish indication, we will wait for a correction to take an A+ entry.

XAU/USD 06.08.25XAU/USD: Fresh Bullish Impulse Targeting $3,440 — Entry Point Confirmed
Market Overview:
After a corrective pullback to the EMA 144 and key support near $3,350, gold has confirmed a new bullish leg from point B. The recent rejection from the lows suggests a continuation toward the $3,440 target within the ABCD harmonic structure.
Technical Signals & Formations:
— 1H EMA(144) acted as dynamic support
— Strong bounce from $3,350 support zone
— Price is moving within an ascending channel
— ABCD pattern projects target around $3,440
— Breakout above $3,374 will validate further upside
Key Levels:
Support: $3,350, $3,374
Resistance: $3,440 (D1)
Scenario:
Primary: Bullish continuation to $3,440
Alternative: Short-term range between $3,360–$3,374 followed by upside breakout

Gold Price Setup – Potential Rejection & Long ScenariosPrice is currently consolidating below the H4 Supply Zone after rejecting the ascending trendline twice.
Two key scenarios are in focus:
✅ Scenario 1 – Deeper Pullback to Demand Zone
A retracement into the 1H + 30M Order Block (OB) and liquidity zone near 3,341–3,355 (marked with $$$) could attract buyers.
If bullish momentum confirms, look for a continuation toward 3,388 and possibly the upper trendline near 3,400+.
✅ Scenario 2 – Immediate Push Higher
If price holds above the moving average and fails to break below 3,355, bulls could step in earlier, driving price back to test the trendline resistance.
Breakout of the trendline could target the higher supply region.
🔍 Key Levels to Watch:
H4 Supply Zone (3,440 area) for potential reversal.
3,341 OB Zone for liquidity sweep and reaction.
Trendline Resistance capping the upside.

8/6: Watch for a Potential Double Top FormationGood morning, everyone!
Yesterday, gold experienced its first significant supply pressure around the 3386 level, but with support near 3350—helped by positive data—prices rebounded and climbed back toward 3390, resulting in solid overall gains.
From the 1-day chart (1D) perspective, the technical structure remains bullish, with MA20 providing firm support. Although short-term moving averages are currently converging, the overall bias remains towards a bullish divergence, suggesting further upside potential. There's a possibility for price to test the 3400–3420 zone in today’s session.
That said, the 3386–3398 region may still pose minor selling pressure, although it is not expected to be particularly strong. Key intraday support is seen in the 3378/3372–3362 range. If the market encounters another wave of heavy selling that damages the daily bullish setup, then the 3343–3348 area will become a critical battleground between bulls and bears.
📌 Trading Strategy for Today:
Maintain a sell-on-strength approach, especially if prices approach the 3418–3438 resistance area, where short opportunities become more attractive;
If a pullback occurs, monitor the aforementioned support zones for potential buy-on-dip opportunities, contingent on stability.
⚠️ Market Risk Reminder:
There will be key economic speeches during the US session, which could trigger heightened volatility. Ensure proper risk management and stop-loss settings are in place.

XAUUSD Analysis todayHello traders, this is a complete multiple timeframe analysis of this pair. We see could find significant trading opportunities as per analysis upon price action confirmation we may take this trade. Smash the like button if you find value in this analysis and drop a comment if you have any questions or let me know which pair to cover in my next analysis.

XAUUSD NEW OUTLOOKAccording to H1 analysis gold market going in buying pressure from last 2 day
now market break the resistance zone and make it RBS (RESISTANCE BECOME SUPPORT) so now market close at support level market will touch the Support zone IF you want to buy gold then you have to best chance to buy from SUPPORT level dont be greedy use money management
TRADE AT YOUR OWN RISK
Gold Market Opens Bullish — Eyes on 3390’sGold market opens during the Asian session, maintaining bullish momentum following the previous job data report. Price action shows intent to mitigate the 3390's, though 3350’s demand zone may require attention first for a clean continuation.
🔍 Key Levels:
3390’s – Target supply zone
3350’s – Demand zone likely to be revisited
💡 Sentiment:
Bullish continuation expected
Watch for reaction at 3350 before the next leg up. follow for more insight , comment for more opinionsand boost idea

Gold soaring with NFP debacle as an catalystQuick update: Gold is Trading on NFP fuelled relief rally and Bearish Technicals are invalidated once again (I announced lately that this might happen if NFP delivers downside surprise / debacle). The Hourly 4 chart's Ascending Channel increases it's gains towards Overbought levels as #3,352.80 benchmark is showcasing strong durability. Both Weekly chart (#1W) and Monthly (#1M) are on mild gains (# +0.65% and # +0.71% respectively) and with ranging candles (Gold consolidating above the Support for the fractal) I do not see any rebound (to the downside) possibility yet.
My position: As discussed above, I will keep Buying every dip on Gold and will not Sell Gold throughout today's session (if I do, will be aggressive in & out Scalp only). Gold remains very sensitive to every Bullish development while Bearish ones are still on second place.

Gold Continues Its Upward Momentum Despite Short-Term Pullback📊 Market Summary
• Spot gold slipped slightly by ~0.1% to around $3,354–$3,361/oz due to profit-taking after last week’s sharp rally following weaker-than-expected U.S. job data
• The U.S. added only 73,000 jobs in July, boosting expectations of a Federal Reserve rate cut in September, with a current market probability of around 81%
• Ongoing geopolitical risks, trade tensions, and robust central bank and ETF gold demand continue to support the long-term bullish outlook
________________________________________
📉 Technical Analysis
• Key resistance: ~$3,360–$3,370/oz (short-term highs, potential profit-taking zone).
• Nearest support: ~$3,330/oz (watch for buying interest on pullbacks).
• EMA09: Price is currently hovering around the short-term EMA (~EMA09), still below EMA50, indicating a mild sideways bias. According to Economies.com, gold hasn’t confirmed a stable uptrend above EMA50 yet
• Candlestick / volume / momentum:
o Today's candle shows mild profit-taking, but momentum remains bullish from the prior session. Volume shows light distribution, not strong selling.
________________________________________
📌 Outlook
• Gold may continue rising slightly in the short term if the upcoming U.S. inflation data (due August 12) remains soft, reinforcing the likelihood of a Fed rate cut
• Conversely, if the U.S. dollar strengthens unexpectedly or new data comes out more robust, gold could retreat back to the $3,330 zone.
________________________________________
💡 Suggested Trading Strategy
SELL XAU/USD : $3,370–$3,373
🎯 TP: 40/80/200 pips
❌ SL: $3,377
BUY XAU/USD : $3,330–$3,333
🎯 TP:40/80/200 pips
❌ SL: $3,327

XAUUSD (SHORT)
Price broker the trendline and had to come back to retest it to confirm breakout. We expecting bears to come in for fither sells.
NB:DXY correlating with GOLD direction as extra confirmation,

Short position is expected As price reacted to demand area, we expect that the price will continue to move in uptrend.
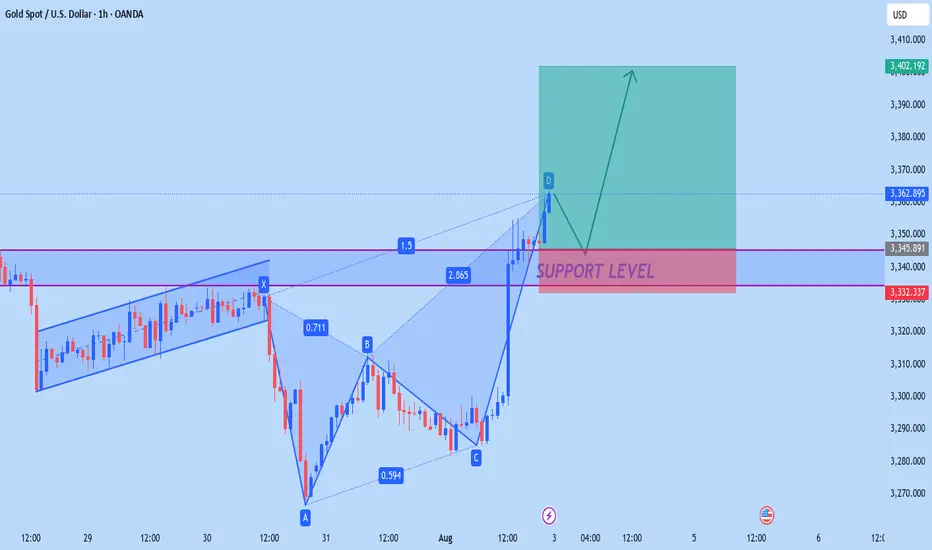
Smart Money / Price Action 5min scalping road map# 📈 ABC Pattern Explained for TradingView (Smart Money / Price Action)
The **ABC pattern** is a 3-leg corrective move in market structure, commonly used in price action, Elliott Wave, and Smart Money trading. It's mainly used to identify **pullbacks** or **correction zones** before a continuation of the main trend.
---
## 🔹 Structure of the ABC Pattern:
- **Point A**: The beginning of the move — often the end of a strong impulsive wave.
- **Point B**: The first retracement or pullback from Point A.
- **Point C**: The second corrective move that often goes beyond A, forming the completion of the correction phase.
The ABC legs can be:
- **A to B**: Impulsive or corrective.
- **B to C**: Generally a counter-trend retracement.
---
## 🔸 How to Identify on Chart:
1. **Find a strong trend** (uptrend or downtrend).
2. **Look for the first correction** — mark it as Point A to B.
3. **Next wave** that attempts to continue the trend but fails — mark the end as Point C.
4. **Use Fibonacci tools** to measure:
- **B retracement of A** (typically 50%–78.6%)
- **C extension** of AB (typically 127.2%–161.8%)
---
## 🔧 How to Draw on TradingView:
> You can use the `Trend-Based Fib Extension` tool or draw manually using the `Path` or `ABC pattern` tool.
### Step-by-Step:
1. Select the `ABC Pattern` tool from the **left toolbar** under “Prediction and Measurement Tools”.
2. Click on **Point A** (3320$).
3. Click on **Point B** (3350$).
4. Click on **Point C** (final corrective wave 3300$ ).
5. TradingView will automatically plot the shape with labels.
---
## 🧠 Pro Tips:
- Look for **liquidity sweep** or **order blocks** near Point C.
- Entry opportunity is often **after C**, targeting a **continuation** of the main trend.
- ABC is often part of **larger structures** like **complex pullbacks** or **smart money retracements**.
---
## ✅ Example Use:
- **Buy Scenario**:
- Strong uptrend → Price drops from A to B (retracement).
- Then price rises to C, failing to break above A → Possible new higher low formed.
- Enter long if price breaks above Point B again.
- **Sell Scenario**:
- Strong downtrend → A to B is a pullback.
- C attempts new high, fails → short entry after break of B.
---
## 📌 Settings Tip for Mobile Users:
- Zoom in for better point control.
- Use “Lock” feature to prevent accidental move.
- Customize color and label visibility in the style tab.
---
## 🔍 Keywords:
`ABC Pattern`, `Elliott Correction`, `Smart Money`, `Liquidity Grab`, `Break of Structure`, `Trend Continuation`, `Price Action Trading`, `Market Structure`
---
Gold is in the Bearish Direction after Formation ManipulationHello Traders
In This Chart GOLD HOURLY Forex Forecast By FOREX PLANET
today Gold analysis 👆
🟢This Chart includes_ (GOLD market update)
🟢What is The Next Opportunity on GOLD Market
🟢how to Enter to the Valid Entry With Assurance Profit
This CHART is For Trader's that Want to Improve Their Technical Analysis Skills and Their Trading By Understanding How To Analyze The Market Using Multiple Timeframes and Understanding The Bigger Picture on the Charts
Go long on gold at low prices, targeting above 3400.Go long on gold at low prices, targeting above 3400.
Gold 4-Hour Chart:
As shown in the chart, from a macroeconomic perspective, despite the rise in gold prices, it remains trapped within a trend channel.
Currently, gold prices are under pressure in the 3370-3380 range.
On Friday, driven by risk aversion, gold prices briefly rose to $3363. With the Federal Reserve resuming its rate hikes over the weekend, expectations for a September rate hike have risen to 80%.
The most robust strategy for gold prices next week: enter long at low prices and manage your position accordingly.
Going long at current prices is not recommended. Instead, watch for potential declines due to profit-taking after the price dips.
Upward resistance lies near 3370 and 3380, where previous reversals occurred.
Every waterfall pattern offers a buying opportunity on the decline.
Although gold is currently strong, if we are bullish, we should not chase the gains. Simply wait patiently for prices to fall back to lower levels before going long.
Short-term intraday trend
Upside focus: Resistance at 3372-3385
Downside focus: Support at 3345-3340 and 3315-3320.
Gold Strategy:
1: Buy on the first dip into the 3338-3343 range, with a small stop-loss and a target price of 3370-3380.
2: Go long at low prices and control position size. This is definitely the most stable trading strategy. Patiently maintain a swing strategy. Target 3400+.
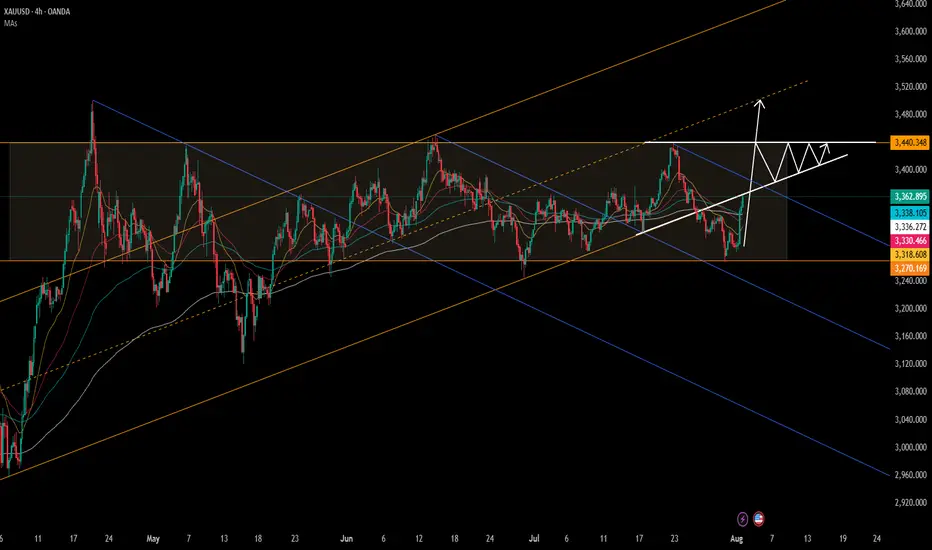
3: Continue to monitor resistance near 3440 next week. As shown in the chart, a converging triangle pattern may form.
XAUUSD - Daily | More Consolidation??Gold is back in the upper range of this consolidation zone. You can see the high of the range is 3430, and the low is 3240 roughly.
Bulls:
Gold is pulling back into an Inverted FVG. If the price is bullish, then we should clear the gap with ease. Gold has just eliminated 4 days' worth of choppy bearish price action. Look for gold to give clear signs to enter a buy.
**A new daily candle should appear, creating a new FVG showing buyers are winning
Bears:
So with that said... If Gold fails to remain bullish after Friday's (Aug 1st) 700-pip jump, then the iFVG may have the price react bearishly. Watch for gold to give a clear sign of rejection before entering a sell
**Price may drop to cover Friday's gap. Doesn't mean it's bearish

Risk aversion is intensifying. Is gold poised for a breakout?Gold prices fell slightly in Asian trading on Friday, retreating from a two-week high of $3,409 hit the previous day as most investors chose to take some profits before the weekend.
Nevertheless, trade-related uncertainties continue to support gold. US President Trump announced this week that he would impose additional tariffs on Indian imports as a "punishment" for its purchase of Russian oil, raising the total tariff to 50%. He also plans to impose additional tariffs on semiconductors and pharmaceutical products next week.
In addition, the Federal Reserve’s policy expectations are also positive for gold prices. US non-farm payroll data for July was weak, with unemployment claims rising for the second consecutive week, signaling a weakening labor market. Data from the US Department of Labor showed that initial jobless claims rose to 226,000 in the week ending August 2, the highest level since early July.
Technically, gold prices encountered resistance near the upper limit of the daily rising channel and retreated after testing $3,410. Previously, the price of gold effectively broke through the resistance area of $3,380, showing that bulls still have momentum.
The momentum indicators in the daily chart: MACD and RSI remain upward, but the short-term rise has slowed down, indicating that the market has entered a consolidation phase.
If the gold price can regain its footing above $3,409, it is expected to test the $3,420 resistance area, and further targets will point to the historical highs of $3,434 or even $3,500.

Up 16K USD Profit For The Month On XAUUSD Momentum TradingXAUUSD is again making these ranges as it goes up. If you can identify these ranges then you can do a short trade on the resistance levels and a long trade on support levels. XAUUSD is trending up overall but if you are a trend-follower then you will have a hard time timing your entries just because of the ranges XAUUSD is making. It will go up to 3,400 then go back down to 3380 then back again to 3,400 then down again to 3375. Momentum trading is the best approach. You short the tops. Go long on bottoms. Get in, get out. I currently have 16,894 usd realized profit on XAUUSD this month doing momentum trading. I'm trading a live account. FED will probably cut rate soon and there will be a lot of bullish predictions on XAUUSD but I highly suggest to just trade the chart. Do not have any opinion on where the market or the price will go. Let the price move and just react. No one can predict the market. Trade your chart. May you trade well.
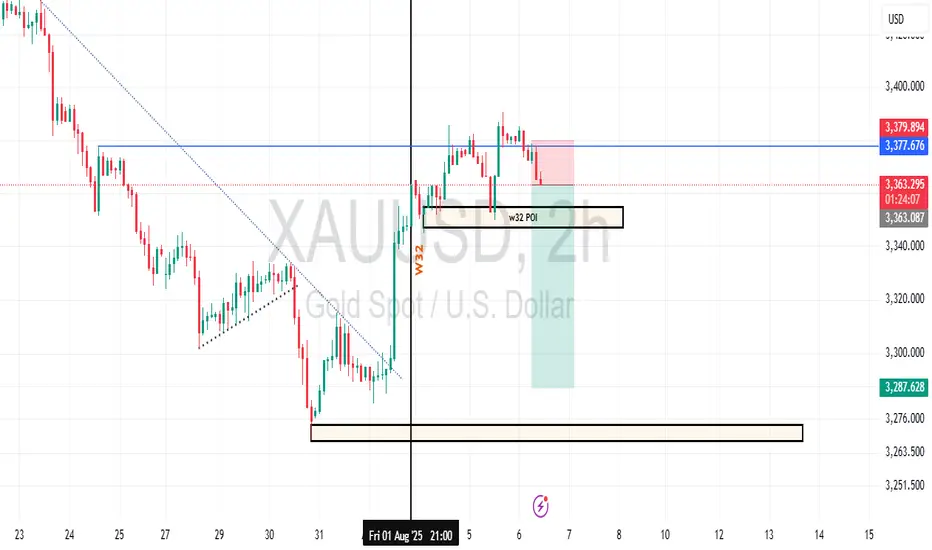
Gold Week 32 Possible reversalGold prices are in a clear downtrend, with critical support at $3,287.628 and resistance at $3,379.874. The 'W32 POI 2H' on Aug 1 highlighted a volatile 2-hour period with a sharp drop and recovery, signaling potential support strength. Fibonacci retracement levels could play a key role in identifying retracement targets. Stay disciplined with risk management as you navigate these levels.
GOLD BUY INTACTFinal bullrun towards 34xx plus is remaining to complete ite wave before goes sideways to decide either going down or ATH
