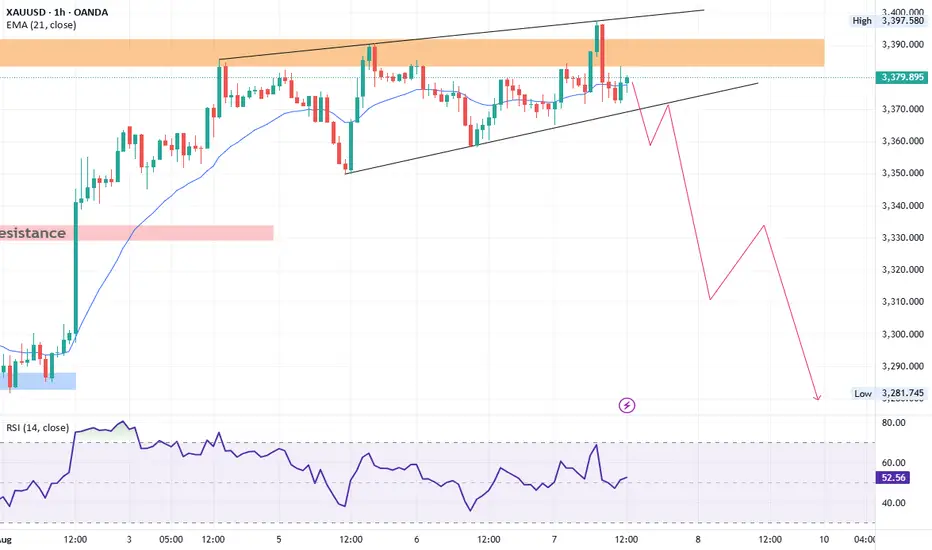
my opinion about next move gold h1 tf let see my opinion about next move gold h1 tf let see if you need any think about our analysis coments right this chart
XAUUSD trade ideas

Risk aversion is intensifying. Is gold poised for a breakout?Gold prices fell slightly in Asian trading on Friday, retreating from a two-week high of $3,409 hit the previous day as most investors chose to take some profits before the weekend.
Nevertheless, trade-related uncertainties continue to support gold. US President Trump announced this week that he would impose additional tariffs on Indian imports as a "punishment" for its purchase of Russian oil, raising the total tariff to 50%. He also plans to impose additional tariffs on semiconductors and pharmaceutical products next week.
In addition, the Federal Reserve’s policy expectations are also positive for gold prices. US non-farm payroll data for July was weak, with unemployment claims rising for the second consecutive week, signaling a weakening labor market. Data from the US Department of Labor showed that initial jobless claims rose to 226,000 in the week ending August 2, the highest level since early July.
Technically, gold prices encountered resistance near the upper limit of the daily rising channel and retreated after testing $3,410. Previously, the price of gold effectively broke through the resistance area of $3,380, showing that bulls still have momentum.
The momentum indicators in the daily chart: MACD and RSI remain upward, but the short-term rise has slowed down, indicating that the market has entered a consolidation phase.
If the gold price can regain its footing above $3,409, it is expected to test the $3,420 resistance area, and further targets will point to the historical highs of $3,434 or even $3,500.

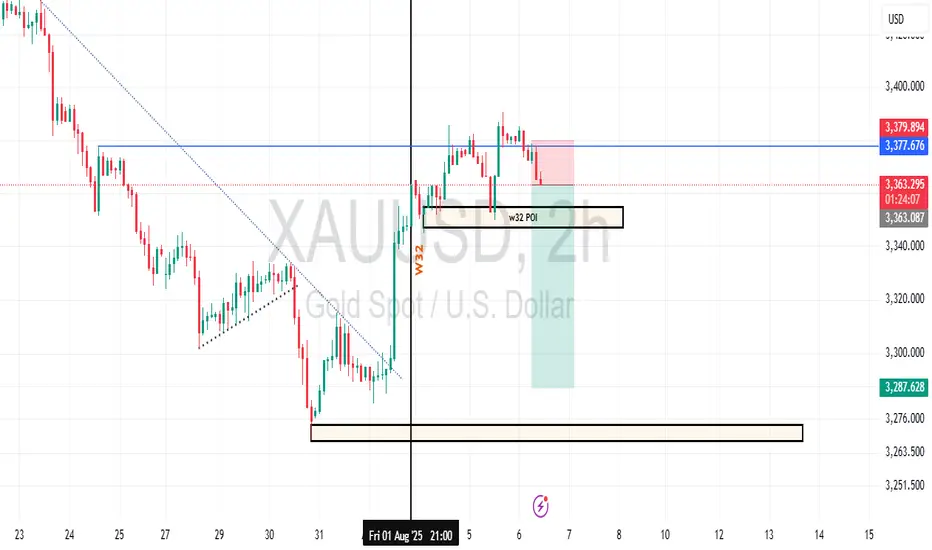
Gold Week 32 Possible reversalGold prices are in a clear downtrend, with critical support at $3,287.628 and resistance at $3,379.874. The 'W32 POI 2H' on Aug 1 highlighted a volatile 2-hour period with a sharp drop and recovery, signaling potential support strength. Fibonacci retracement levels could play a key role in identifying retracement targets. Stay disciplined with risk management as you navigate these levels.
GOLD BUY INTACTFinal bullrun towards 34xx plus is remaining to complete ite wave before goes sideways to decide either going down or ATH

BUY GOLDXAUUSD has a potential bullish movement characterized by a series of supportive bullish pattern , expect the market to rise infact there might be bearish movement to recover the gapos left dude to the friday news push ...
all the best use proper risk management
the market will pay back if u employ consistancy
Report - 5 August, 2025EVENT OVERVIEW & MARKET REACTIONS
Global markets are undergoing a seismic recalibration in response to a series of high-impact developments driven by U.S. policy shifts under President Trump’s administration. The introduction of sweeping tariffs—15% on the EU, 39% on Switzerland, and up to 40% on others—has shocked allies and fractured transatlantic trade relations. Key EU states like Germany and France have publicly denounced the deal, calling it a capitulation and a strategic misstep. Markets responded accordingly: the euro posted its second-largest single-day decline of the year, falling 1.1% against the dollar, while European indices such as Germany’s DAX and France’s CAC 40 closed down 1.1% and 0.4% respectively.
Swiss equities saw strong volatility, with the Swiss Market Index falling as much as 1.9% intraday after the shock 39% tariff announcement. The Swiss franc also weakened 0.6% against the dollar, exacerbating investor anxiety. Conversely, Wall Street remained relatively buoyant with the S&P 500 and Nasdaq Composite climbing 1.3% and 1.8% respectively, driven by expectations of Federal Reserve rate cuts following weak U.S. jobs data. Treasury yields fell, with the 10-year note dipping to 4.21% and similar softening seen in German Bunds and UK gilts.
Crude oil markets were rattled by OPEC+'s surprise decision to increase production by 547,000 barrels/day starting September, marking an end to the group’s multi-year strategy of withholding supply. This triggered fears of a renewed oil glut heading into winter, especially as EV market concerns and Chinese demand weakness persist. Brent crude dipped on the announcement, compounding energy sector volatility.
STRATEGIC FORECASTS
Strategically, the trade realignment driven by the U.S. will lead to increased fragmentation in global commerce. Countries caught off-guard by Trump’s tariff decisions, such as Switzerland, India, and Taiwan, are scrambling to re-engage diplomatically. The EU appears divided, with some members pushing for aggressive countermeasures while others—primarily Germany—seek more calibrated solutions such as quotas and “offset” schemes. Trump’s approach—demanding investment pledges or unilateral concessions—risks a broader breakdown in multilateral trade norms.
We expect increased geopolitical volatility around U.S.-China relations as well. Trump has paused tech export restrictions to China in an attempt to secure a summit with Xi Jinping, temporarily soothing market nerves. However, this has sparked bipartisan backlash within the U.S. security apparatus. As a result, sectors like AI chips, semiconductors, and rare earths are now high-risk zones for both investors and policymakers.
In parallel, Tesla’s $16.5bn AI chip deal with Samsung marks a critical milestone in global tech supply chains, potentially boosting South Korea’s strategic relevance while challenging Taiwan’s TSMC dominance. This also serves as a confidence signal to global markets despite Musk’s ongoing litigation over a $56bn pay award and his volatile relationship with Trump.
FISCAL AND POLITICAL IMPLICATIONS
The tariffs are already triggering fiscal consequences. The Yale Budget Lab estimates U.S. tariffs will reduce disposable income for the bottom 10% of households by 3%, compared to 1% for the top decile. Trump's "One Big, Beautiful Bill" tax plan is exacerbating income inequality, favoring higher-income earners with $12,000/year increases versus a $1,600 hit to the poorest households.
Politically, there is growing unrest both in the U.S. and abroad. Trump’s sacking of the head of the Bureau of Labor Statistics has raised alarms about institutional independence. Germany's finance minister has openly criticized these actions, calling them a breach of democratic norms. Meanwhile, OPEC+'s decision to abandon supply cuts reflects internal cartel tensions and shifting alliances, particularly as U.S., Canadian, and Brazilian production continues to rise.
In the EU, far-right parties are seizing on the trade deal to criticize institutional weakness, while Switzerland faces internal political turmoil after being blindsided by the U.S. tariff rate. Emerging political fractures across the Western alliance could limit coordinated responses to future crises.
RISKS
Tariff Escalation Risk: With tariffs now hitting over 70% of U.S. trade partners, the risk of retaliatory measures remains elevated, particularly from China and the EU.
Institutional Credibility Risk: The politicization of U.S. economic data may erode investor confidence in official statistics, impacting bond and currency markets.
Energy Price Volatility: OPEC+’s return to production growth could overwhelm winter demand and spark a crude oil price collapse if EV adoption outpaces expectations.
Investor Confidence: Emerging market economies, particularly in Southeast Asia, are being caught in the crossfire. New “transshipment” tariffs make offshoring less attractive, compressing corporate margins.
OPPORTUNITIES
Tech Supply Chain Diversification: Samsung’s Tesla contract opens pathways for other U.S. tech firms to reduce reliance on TSMC and hedge geopolitical risk.
Rate-Cut-Driven Equity Rebound: With weak U.S. jobs data fueling Fed dovishness, global equities may benefit in the short term as investors reposition for monetary easing.
European Banks Rebound: European financials continue to outperform U.S. counterparts amid rising net interest margins, creating relative value opportunities.
Energy Exploration Investment: BP’s massive Brazilian discovery signals renewed viability for fossil fuel projects, potentially attracting capital flows back into traditional energy.
ASSET IMPACT OUTLOOK
XAUUSD (Gold)
With rising trade uncertainty, weak U.S. jobs data, and Fed dovishness, gold stands to benefit as a hedge against inflation, geopolitical turmoil, and dollar volatility.
S&P 500
Relieved by Fed dovishness and strong Big Tech earnings, but faces margin compression risks in consumer sectors and potential spillovers from Trump’s policy unpredictability.
USDJPY
Yen has started rebounding slightly, aided by safe-haven flows and a weakening dollar following poor U.S. jobs data. Volatility likely to persist as BOJ policy diverges.
DXY (US Dollar Index)
The dollar's rally has reversed on rate cut expectations and weaker labor prints. Fed's next move is critical—any surprise hawkish tone would re-ignite upside.
Crude Oil (Brent/WTI)
Supply glut fears from OPEC+ hikes, muted Chinese demand, and rising non-OPEC output suggest pressure on crude. Risk of sub-$70 if winter demand fails to materialize.
Dow Jones
Benefiting from rate-cut hopes and strong corporate earnings in financials and tech, but vulnerable to volatility from domestic political interventions and sector rotation.

Technical indicators are bullish across the boardInfluenced by the NFP data, gold prices rose strongly, fully recovering last week's losses. The current gold market has broken the previous bull-bear equilibrium and remains in a strong upward trend. We are currently bullish but will not chase the rise. We will wait for gold to fall back and stabilize before trying to go long. Gold is currently in a sideways consolidation. If gold touches the upper short-term resistance of 3365-3370 again in the European session and encounters resistance and pressure, you can consider shorting with a light position and waiting for a pullback. If the gold price breaks up strongly, pay attention to the key suppression level above 3375-3385.
As the price of gold continues to rise, the support has moved up. Pay attention to the short-term support of 3345-3330 below. If it retreats and stabilizes, you can consider going long. Independent traders must strictly implement trading plans, and those who are not sure about the market must set stop-loss orders.
OANDA:XAUUSD

XAUUSD Outlook – Technical Correction Expected Amid Bullish Fund🧠 Narrative Summary:
Gold remains fundamentally supported by:
🇺🇸 US Factory Orders MoM came in at -4.8% (Forecast -4.8%, Previous 8.2%) – a sharp slowdown signaling weaker manufacturing momentum.
🏛️ Markets now price an 80% chance of a 25bps Fed rate cut in September.
🧑💼 Fed Governor Adriana Kugler’s resignation opens the door for a dovish replacement (possibly by Trump).
🔥 Trump reportedly fired the BLS head over “data manipulation” accusations – raising data credibility risks.
📈 COT data shows speculator sentiment above 50%, confirming a bullish stance.
☑️ All signs point to a supportive macro backdrop for Gold.
🧪 My Bias (Short-Term View):
Despite the strong bullish macro backdrop, I’m watching for a short-term technical correction today (Tuesday):
“Markets often react in advance of data – and after such a strong run, a liquidity grab or pullback could create better entry zones.”
📉 Technical Breakdown:
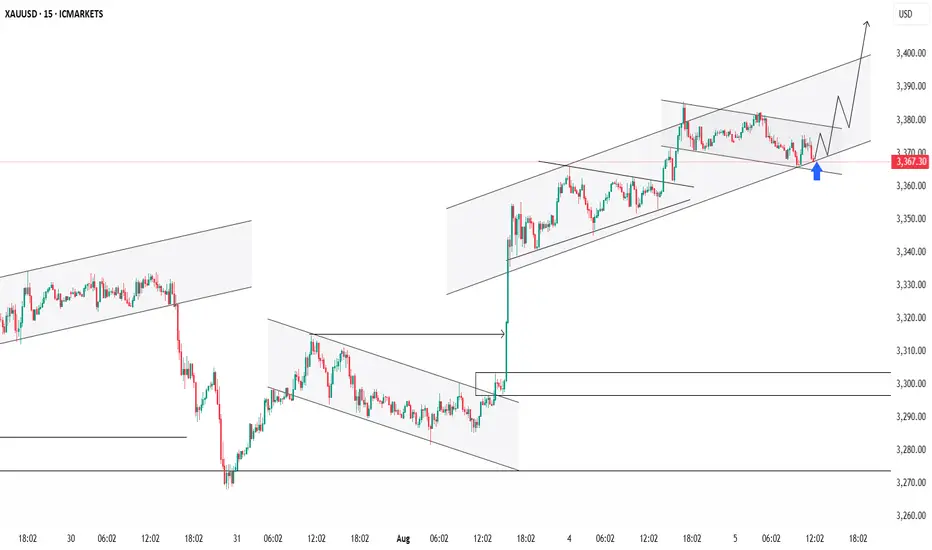
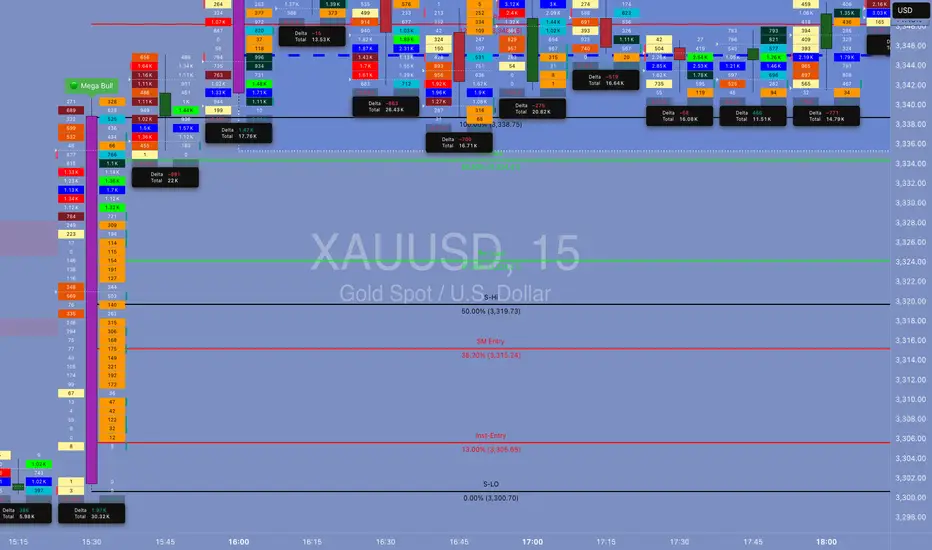
🔹 15-Min Chart:
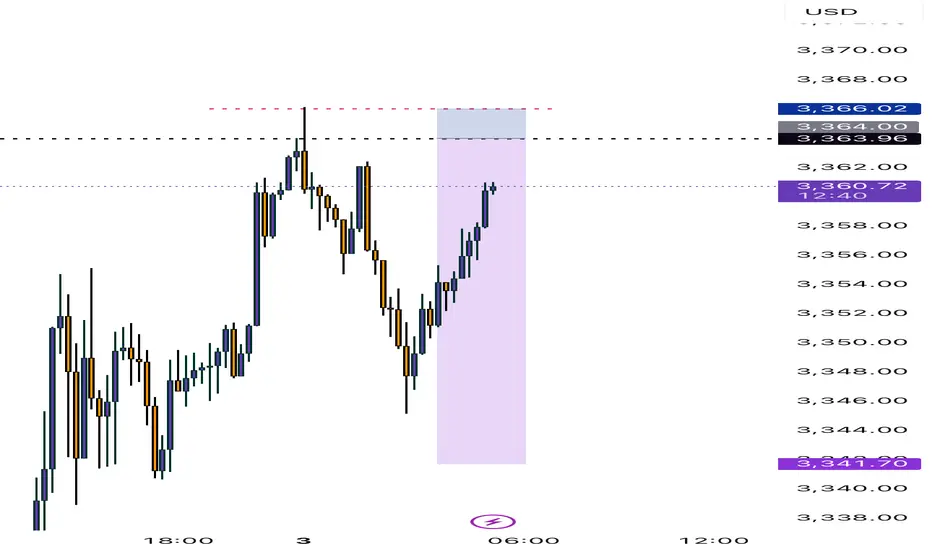
Price is hovering near point of control/resistance, forming potential distribution.
Clean bullish channel, but upside momentum is slowing.
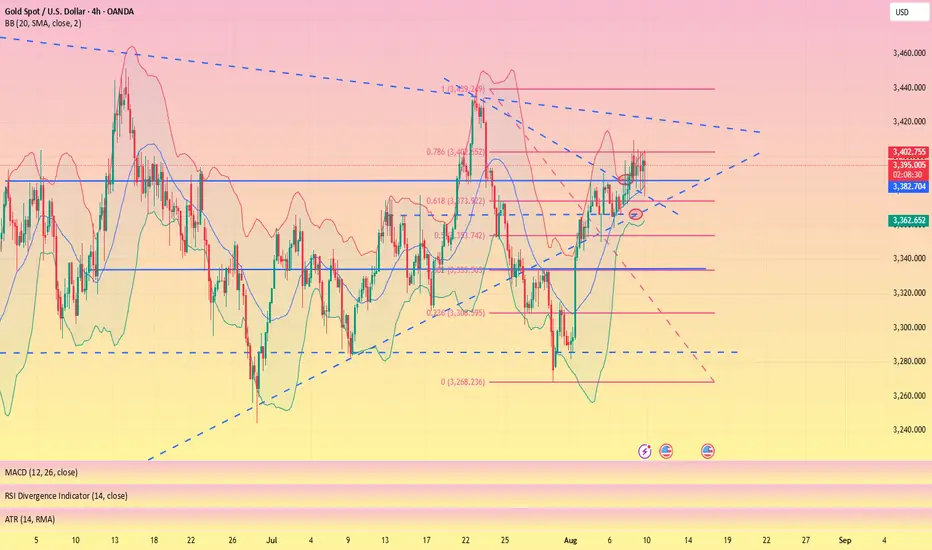
🔹 4H Chart:
Price has reached the upper edge of the descending channel.
No proper retest on the lower channel → room for liquidity sweep below.
RSI nearing overbought zone.
🎯 Trading Plan:
Watching for a short-term sell-off / correction during Tuesday’s session.
Will reassess based on Wednesday’s ISM Services & Fed speaker lineup.
Not chasing highs — waiting for potential re-entry from discounted zones.
📌 Powell Watch:
Despite dovish pricing, remember — Powell has held firm for months. One weak report may not be enough to guarantee a cut. “Slow to hire, slow to fire” still equals a balanced labor market.

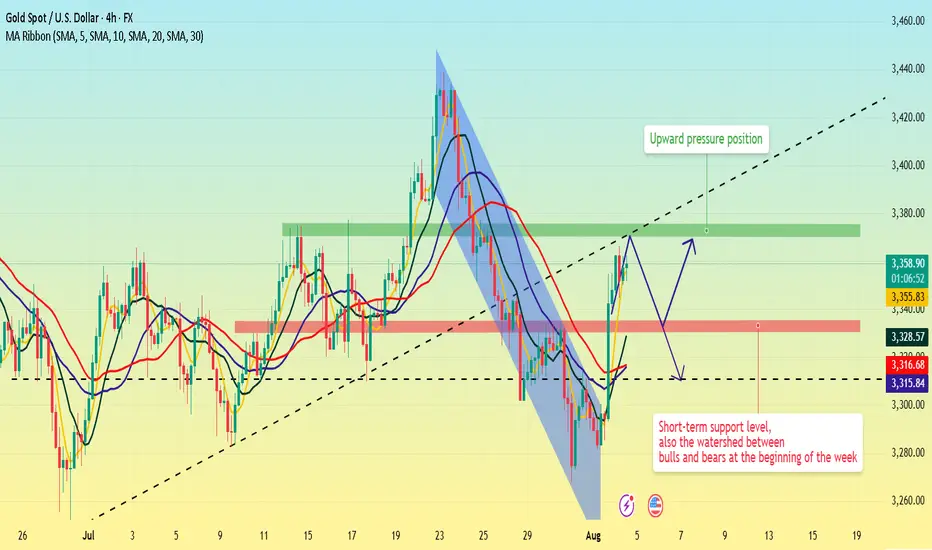
Gold prices fluctuate. Bullish theme?From a technical perspective, gold prices have retraced above key moving averages, and the RSI has turned bullish. Short-term resistance for gold is near 3370. Can gold continue its sharp rise this week? Will there be a new rise? This depends on the performance of risk aversion in the market this week.
Quaid believes that 3330 is the watershed between bulls and bears at the beginning of the week. As long as the market is bullish, this level must not be broken. If it is broken, the gold trend will directly turn weak. Whether this week's daily moving average can continue to rise is key to triggering a bullish trend in gold.
From the 4-hour chart, pay attention to the range pressure position of 3370-3375 on the upper side, and the support on the lower side is around 3330-3335. If the price falls back at the beginning of the week, it can be bullish based on this position. The short-term bullish strong dividing line should pay attention to this range.
Why Did I Lose XAUUSD During NFP Time .... Waiting for a Miracle
Why Did I Lose XAUUSD During NFP Time 😢 While I Was Waiting for a Miracle 😉… and Everyone Else Cashed In? 🤑
Alright, champ. Let’s break down why you lost your short trade around $3,348 per ounce, while the whole world seemed to be printing money. This one’s for the smartest and slickest trader on Egyptian soil—but explained like someone who actually understands market behavior, not someone blindly quoting a textbook. Grab a pen and paper. Let’s dig in.
⸻
🔥 Part 1: “You Faced NFP Like You’re Superman”
❌ What Happened:
• Price shot up hard after the NFP release.
• You said, “That’s too much—it must come down.”
• You went short from the top (around 3,305).
😵💫 Where You Went Wrong:
• NFP isn’t just any move—it’s nuclear fuel for the market.
• The move that follows it is usually an impulse wave—it continues, it doesn’t pull back.
• The market doesn’t drop just because it went up a lot. It drops when:
• Volume dries up.
• Buyers get bored.
• You spot negative delta or divergence.
⚠️ None of that was present when you shorted.
✅ The Smarter Mindset:
“During major news events like NFP, the market doesn’t pull back—it follows through.”
⸻
🔥 Part 2: “Volume Was Screaming in Your Face: I’m Not Done Yet!”
📊 What You Saw:
• Positive delta.
• Increasing volume.
• Big lot sizes hitting the ask side.
❌ What You Ignored:
• No divergence between effort and result.
• Buyers were still strong—no weakness.
• Price wasn’t reacting to resistance; it was smashing through it.
💡 Big Difference Between:
• Absorption = buyers easing the price up slowly.
• Rejection = buyers failing and price slapping back.
You mistook absorption for rejection—classic rookie mistake.
✅ The Real Lesson:
“As long as volume is pushing price, stick with the trend.”
⸻
🔥 Part 3: “You Misused Fibonacci Like a Hammer on a Screw”
❌ What You Did:
• You shorted at the 125%-150% Fibonacci extensions.
• You said, “Price must reverse here.”
📏 What You Should’ve Known:
These levels (138.2%, 150%, 161.8%, 200%) are not sell zones.
They are target zones for buyers, not resistance levels.
✅ The Correct Use:
• Use 125% or 138.2% as breakout buy zones.
• Take profit at 161.8% or 200%.
These are where bulls take profits—not where you blindly short just because “it went up a lot.”
⸻
🎯 Why You Can’t Just Sell There:
Because those zones are:
• Where buying continues.
• Not where it stops—unless momentum fades.
That only happens when:
• Volume drops.
• Delta turns negative.
• Rejection wicks appear.
But what did you do?
You shorted into momentum—while buying was on fire—thinking, “It must stop here!”
⚠️ Nope, bro. That train was still moving—you just stepped in front of it.
⸻
🔥 Part 4: “You Forgot Market Psychology”
🤔 What That Means:
• After NFP:
• Smart money enters early.
• Retail traders wait and watch.
• When price breaks up, retail chases → market moves more.
• Smart money sells into their faces and takes profit.
❌ Your Mistake:
• You tried to be clever and beat the market.
• You didn’t ask:
• Who’s on the market’s side?
• Who’s chasing?
• What will the crowd do next?
When retail feels FOMO, they chase → and that’s what drives continuation.
⸻
🧠 Pro Playbook for NFP-Driven Impulse Moves
✅ Ideal NFP Trade Setup:
1. News release: NFP
2. Price action: Big breakout from range.
3. Confirmation:
• Increasing volume
• Positive delta
• No rejection wicks
4. Entry: Buy Stop above 125% or 138.2%
5. Stop Loss: Below the breakout candle
6. Targets:
• TP1: 161.8%
• TP2: 200%
Now that’s how you use Fibonacci properly, not like people randomly dragging lines around.
⸻
🎯 Where to Draw the Fib Levels From?
✅ The Rule:
From the start of the explosive move to the first clear top right after the news.
🧨 For NFP:
• From: the low of the NFP candle (or the first strong move after the news).
• To: the first visible high with:
• A pause in upward momentum
• A doji candle
• Rejection wick
• Or minor resistance before the move continues
Example:
• Low: around 3,291.50
• Temporary high: around 3,316.00
Draw your Fib from:
• Bottom = 3,291.50
• Top = 3,316.00
⸻
✳️ How to Use the Levels After That:
• 100% = Move ends at the high
• 125% = First extension
• 138.2% = Real ignition point
• 161.8% = Golden target
• 200% = Full wave target
💡 Why Use Buy Stops Above 125%-138.2%?
Because:
• Price breaks above previous highs (lots of traders sell there).
• It creates fake sell traps.
• You enter after the stop-hunt, when the market wipes out sellers and goes higher.
⸻
🔥 How That Looks in Practice:
1. Draw Fib from the start of the NFP impulse move.
2. Wait for price to reach 125% or 138.2%.
3. Place a Buy Stop just above that.
4. Aim for 161.8% or 200% as targets.
XAUUSD Sell setup 09/08/25Bearish reversal (rising wedge/exhaustion): a rising wedge (higher highs + rising lower highs in a narrowing range) on a weekly chart after a big run can be a reversal or deep retracement signal
Follow risk management
Risk no more than 1%

XAUUSD Weekly Plan a Liquidity Clean-Up?XAUUSD Weekly Plan – The Final Bullish Push Before a Liquidity Clean-Up?
Are you ready for a high-volatility week?
Last week, Gold continued to move steadily inside its bullish channel, reaching the FVG High Zone and pushing towards the strong resistance cluster at 3426–3428 (OBS Sell Zone).
The bullish structure on H2–H4 remains intact, but as price enters the distribution zone, candles are tightening, and volume is fading — a clear sign that buying pressure is weakening.
Macro Backdrop – What’s on the Calendar?
This week is packed with high-impact USD data:
CPI (Aug 12) – Major inflation reading, key driver for USD & Gold.
PPI (Aug 14) – Producer inflation, often a leading indicator for CPI trends.
Unemployment Claims (Aug 14) – Short-term labour market indicator.
💡 Expectations:
CPI & PPI are forecast to improve compared to last month.
If confirmed, this could trigger a sharp Gold pullback as USD strengthens.
However, a weak CPI/PPI could give Gold one last bullish spike before reversal.
Technical Outlook
The H2 bullish channel is well-defined.
The top of the channel aligns with the FVG High Zone — a key area for big player sell limits and profit-taking.
Likely scenario:
Price extends to test 3426–3428 Sell Zone.
Bearish reaction → Channel breakdown.
Retest VPOC 3395–3400 → Drop towards liquidity pools below.
Key Trading Levels
SELL Zone: 3426 – 3428
SL: 3434
TP: 3420 → 3415 → 3410 → 3405 → 3400 → 3395 → 3390 → 3380 → 3370 → 3360
BUY Zone: 3330 – 3328
SL: 3322
TP: 3335 → 3340 → 3350 → 3360 → 3370 → 3380
Risk Management Notes
⚠️ This is a high-risk news week — false breaks are highly possible before & after CPI/PPI.
Avoid holding heavy positions during key data releases.
If price breaks above 3434 with strong volume, bearish scenarios are invalid → wait for a new structure.
📌 Summary:
Primary bias → Sell from 3426–3428, target downside liquidity pools.
Secondary play → Buy from 3330–3328 if liquidity sweep occurs.
Stay disciplined. Manage risk. Don’t get caught in the volatility trap.
— MMFlow Trading

gold closed bullishgold is still strong in bullish
hence safest trade is still to look for buys until it shows a clear sign of sell.

True or false? How to Decide Between Long and ShortInfluenced by the news related to tariffs, gold has just completed a fluctuation of nearly $20 in a very short period of time, breaking the silence of the gold market in one fell swoop. Separately, news indicates that the White House is planning to clarify the misinformation surrounding gold bar tariffs.
If there were traders who had rashly entered the market before, in the absence of strict trading system constraints and strict trading discipline, they would inevitably suffer certain losses regardless of whether they chose to go long or short.
This is also the reason why after giving my daily trading strategies, I will repeatedly emphasize the importance of strictly adhering to trading planning and discipline.
For ordinary traders, it's difficult to discern the authenticity of this news. After all, the Trump administration has a history of denying its own statements. Therefore, sometimes it's wise to remain on the sidelines.
This is also what I specifically reminded you to do when publishing my trading strategy this morning: be sure to trade with a small position today and be vigilant to potential unforeseen circumstances.
bearable bear bull waiting for monthly candle retracementhi guys if this gold daily candle will close like a huge red volume candle it is possible that this the first line of this poly line will play, although i am looking for retracement in this coming months i have small short position limit order at 3451 with very close maybe it is like stop hunt entry

buy gold saw liquidity sweep and unmitigated zones. comment for my explanation because I want to teach serious people only
thank you

8/8: Continue to Focus on Selling, Watch Support at 3372–3366Good evening, everyone!
Today, after breaking above the 3400 level, gold experienced a pullback. The current structure shows dense support below, with previous resistance levels at 3378, 3372, and 3366 now turning into support.
On the daily chart (1D), price remains above the MA20, and the MA5 (~3382) serves as key short-term support. The candlestick formation still reflects a bullish structure for now.
However, the 4-hour chart (4H) reveals significant upward resistance, and unless the 4H structure is repaired, the market may favor a corrective or consolidation phase in the near term.
🔍 Trading Outlook:
For the remainder of today’s session and early next week, the strategy should primarily focus on selling into strength.
If the 4H chart corrects via a direct price retracement, gold could potentially test the 3348–3337 support zone.
Prior to that, closely monitor the 3372–3366 area as the primary short-term support and pivot zone.

My #3,400.80 Medium-term Target deliveredAs discussed throughout my yesterday's (and many other analysis) commentary: If you have been Buying every dip as per my suggestion you would be in excellent Profits now. I have been Buying Gold from my #3,357.80, #3,367.80, #3,372.80 and #3,378.80 key entry points (last batch of Buying orders closed with Target late U.S. - early Asian session last night).
Technical analysis: Gold is under unprecedented Volatility (however with Bullish underlying trend) with Gold (Xau-Usd Spot) and the Futures price on a tight spread. This is of course the product of heavy speculation in the Metals market, fuelled by the expectation that the Fed’s new talks will be accepted. Needless to mention, this environment is Gold friendly. Technically I do see current aggressive decline in form of a correction as not sustainable however I cannot approach current configuration Technically since these are Fundamentally driven sessions but I do expect a slight pullback back towards #3,352.80 - #3,357.80 only for Gold to soar even more, as the main Support and Higher High’s High’s / Low’s cluster is nearby (#3,357.80 - #3,367.80). Despite Bond Yields stabilization, the continuous Low’s on DX on parabolic decline are adding Buying pressure on Gold and limiting all Selling advance which I am utilizing to it's maximum with my set of Buying orders.
Technical analysis: Gold is Trading on my predicted values as I really don’t mind current consolidation candles within newly formed Hourly 1 chart's Neutral Rectangle. Price-action has made marginal High's on Hourly 4 chart with #3,409.80 (local High's I mentioned earlier that can stall the uptrend) showcasing strong durability. If #3,400.80 benchmark however gets invalidated on High Volume (the last #3-session horizon had been really strong however ahead of local Resistance zone test very anemic) then I can call a test of the #3,427.80 Higher High's extension which represents my next Short-term Target. Gold is extremely Overbought however there are no signs of uptrend exhaustion as I don’t see any firm reason why #3,400.80 benchmark wouldn’t be re-tested within #2-session horizon. Remember, Weekly chart (#1W) still needs a slightly Lower Price (mentioned on previous remarks) before further uptrend as I mentioned that Gold dips only to rise more (Buying accumulation). DX is testing my Higher Low’s heavy Resistance zone as I haven’t got any reservations or doubts regarding its correlation to Gold.
My position: I have re-Bought Gold from #3,382.80 many times throughout yesterday's session and did final aggressive set of Buying orders on #3,388.80 calling for #3,400.80 benchmark late U.S. session which was delivered. I have closed all on #3,400.80 benchmark utilizing current upside push to it's maximum however Gold extended the rise towards #3,409.80 even. I stayed awake and re-Bought #3,395.80 few times since I knew Price-action will be circling #3,400.80 mark and consolidate. I will call it for this week and take early weekend break as I am more than satisfied with my Profits.

Bullish Outlook with Buying Opportunities Based on various factors, the outlook for gold prices in the medium and long term appears bullish.
- From a technical analysis perspective, gold has the potential to move toward $3,500 and beyond, although the momentum of the recent upward trend has slightly weakened, suggesting a possible short-term price correction. If a correction occurs in the short term, it could reach the $3,346–$3,300 range, but gold is unlikely to fall below $3,268. Any pullback to these support levels could present a buying opportunity, as previously mentioned.
- Economic reports and the likelihood of interest rate cuts by the Federal Reserve (expected 50 basis point reduction by the end of 2025) due to projected global inflation above 5% enhance gold’s appeal as a non-yielding asset. Geopolitical issues, including U.S.-China trade tensions, new tariffs (e.g., 25% tariffs on Indian imports due to oil purchases from Russia), and concerns about an economic recession, have bolstered demand for gold as a safe-haven asset. Forecasts such as Goldman Sachs’ ($3,700 by the end of 2025) and J.P. Morgan’s ($4,000 by mid-2026) further support this bullish outlook.
- In the long term, factors such as the declining value of the dollar, rising investment demand (ETFs saw a 98.54% inflow increase in February 2025), and consistent purchases by central banks make gold an attractive option for investors. Therefore, as previously noted, any price pullback can be considered an opportunity to enter the market, particularly given the potential for investors to flock to gold amid unstable economic and geopolitical conditions.
Note:
This analysis is a personal opinion and not investment advice.
Good luck
NEoWave Chart

XAUUSD Technical AnalysisGold is currently trading within a rising wedge pattern on the 1-hour chart. The price recently touched the upper trendline of the wedge and faced a strong rejection, indicating bearish pressure. If the price breaks below the lower boundary of the wedge, it will likely trigger a sharp bearish move.
Key downside targets after a confirmed breakdown are:
3340
3300
3270
If Gold drops below 3270, the next significant support lies at 3250 on the daily chart. A daily close below 3250 will confirm a shift in the medium-term trend, opening the path toward the 3000 psychological level.
OANDA:XAUUSD
GOLD SHORT SELLGold rose toward $3,380 per ounce on Thursday, recouping losses from the previous session to trade at a two-week high, as renewed US tariff threats and expectations of dovish monetary policy boosted the appeal of non-interest-bearing bullion.
President Trump announced a 100% tariff on imported semiconductors and chips, excluding companies that manufacture within the US. He also confirmed that Indian imports will face an additional 25% tariff, while duties on select Brazilian goods were raised to 50%.

GOLD BUY Gold will be buying soon and keep respecting it’s patterns so , I will keep the trading simple and straightforward
