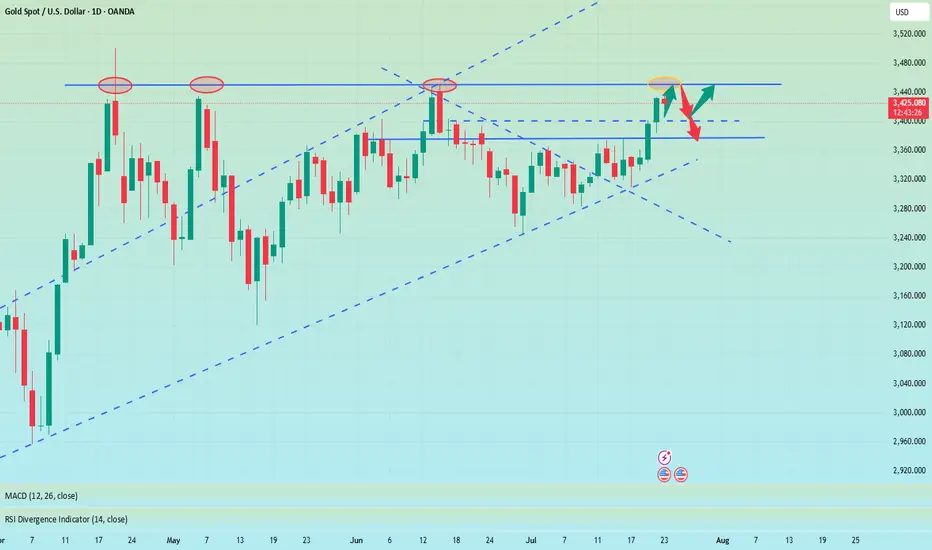
July 22, 2025 - XAUUSD GOLD Analysis and Potential OpportunitySummary:
Currently watching the 3450–3452 zone closely — a key resistance area. Strategy remains to buy on pullbacks, but if price fails to break this resistance, short setups become more favorable. Keep an eye on 3426 support — if it breaks, bearish momentum may strengthen. As always, observe price action at key levels and adjust accordingly.
🔍 Key Levels to Watch:
• 3460 – Resistance
• 3450–3452 – Critical resistance zone
• 3440 – Resistance
• 3435 – Resistance
• 3426 – Key support
• 3405 – Support
• 3400 – Psychological level
• 3375 – Support
• 3364 – Support
📈 Intraday Strategy:
• SELL if price breaks below 3426 → target 3420, then 3415, 3410, 3405
• BUY if price holds above 3434 → target 3440, then 3445, 3450, 3455
👉 If you find this helpful or traded using this plan, a like would mean a lot and keep me motivated. Thanks for the support!
Disclaimer: This is my personal view, not financial advice. Always use proper risk control.
XAUUSD trade ideas
GOLD SELLGold price bears retain control amid fading safe-haven demand, rebounding USD
US President Donald Trump announced late Tuesday that his administration had reached a trade deal with Japan. Furthermore, reports that the US and the European Union are heading towards a 15% trade deal boost investors' confidence and weigh on the safe-haven Gold price for the second straight day on Thursday.
The markets do not expect an interest rate cut from the US Federal Reserve in July despite Trump's continuous push for lower borrowing costs. In fact, Trump has been attacking Fed Chair Jerome Powell personally over his stance on holding rates and repeatedly calling for the central bank chief's resignation.
Moreover, Fed Governor Chris Waller and Trump appointee Vice Chair for Supervision Michelle Bowman have advocated a rate reduction as soon as the next policy meeting on July 30. This keeps the US Dollar depressed near a two-and-a-half-week low and could offer some support to the non-yielding yellow metal.
Traders now look forward to the release of flash PMIs, which would provide a fresh insight into the global economic health and influence the safe-haven commodity. Apart from this, the crucial European Central Bank policy decision might infuse some volatility in the markets and drive the XAU/USD pair.
Meanwhile, the US economic docket features Weekly Initial Jobless Claims and New Home Sales data, which, in turn, would drive the USD and contribute to producing short-term trading opportunities around the commodity. Nevertheless, the fundamental backdrop warrants caution for aggressive traders.
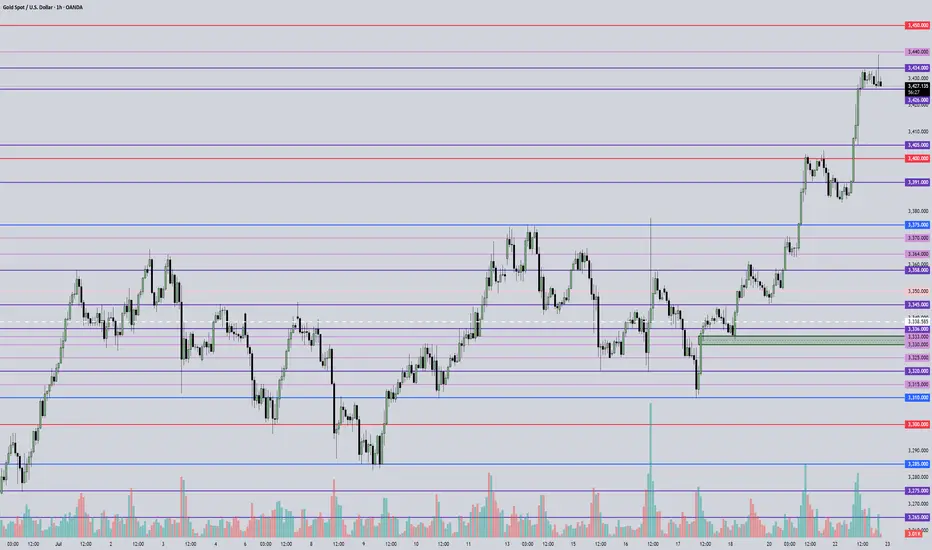
SUPPORT 3,346
SUPPORT 3,322
SUPPORT 3,399
RESISTANCE 3,394
RESISTANCE 3,379
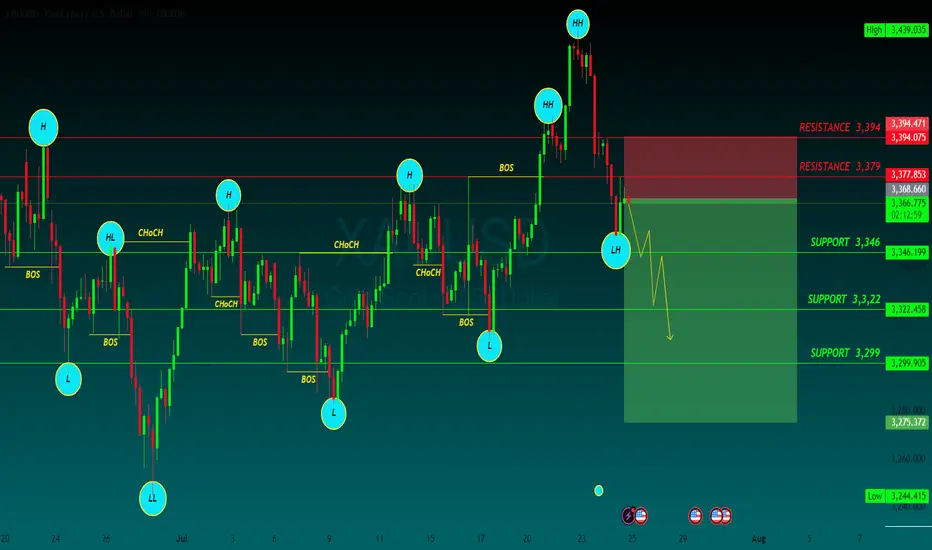
Correction in Play, Long-Term BUY Opportunity Ahead XAUUSD 24/07 – Correction in Play, Long-Term BUY Opportunity Ahead
🧭 Market Outlook
Gold has dropped sharply from the 343x region, exactly as outlined in yesterday’s plan. Price has broken below the ascending trendline on the H1 chart and is now tapping into lower liquidity zones (FVG + OBS), signaling continuation of the short-term bearish move.
Key context to watch:
Traders are awaiting final decisions on US global trade policy agreements.
Next week’s FOMC meeting may confirm expectations of an interest rate cut.
Later today, markets will react to US PMI data and Jobless Claims, which could trigger volatility.
📊 Technical View
While the higher timeframe trend (D1/H4) remains bullish, the short-term structure has broken, and the market is now exploring unfilled liquidity pools below. Once these are swept, we anticipate a strong long-term BUY opportunity.
🎯 Trading Plan for Today
📌 Short-Term Strategy:
Look for short-term SELL setups on retracements toward resistance zones. Wait for clear rejection signals before entering.
📌 Mid/Long-Term Strategy:
Prepare to BUY from major Key Levels once price taps into deep liquidity zones. Ensure confluence and good risk/reward before entering.
🔎 Key Levels to Watch
🔺 Upper Resistance Zones:
3393 – 3404 – 3414 – 3420 – 3428
🔻 Lower Support Zones:
3375 – 3366 – 3352 – 3345 – 3330
🔽 Trade Setups
✅ BUY ZONE: 3352 – 3350
SL: 3345
TP: 3356 → 3360 → 3364 → 3370 → 3375 → 3380 → 3390 → 3400
🔻 SELL ZONE: 3414 – 3416
SL: 3420
TP: 3410 → 3406 → 3400 → 3395 → 3390 → 3380
⚠️ Risk Reminder
No major economic news is scheduled for today, but unexpected political statements or geopolitical tensions could cause price spikes.
✔️ Always follow your SL/TP strictly.
✔️ Avoid entering without solid confirmation.
✔️ Watch how price reacts to the levels above.
📣 Follow MMF on TradingView
If this trading roadmap helps your strategy,
📌 Follow the MMF team on TradingView for daily actionable setups, real levels, and no-nonsense analysis based on real market conditions.
🎯 Real trades. Real zones. Real discipline.

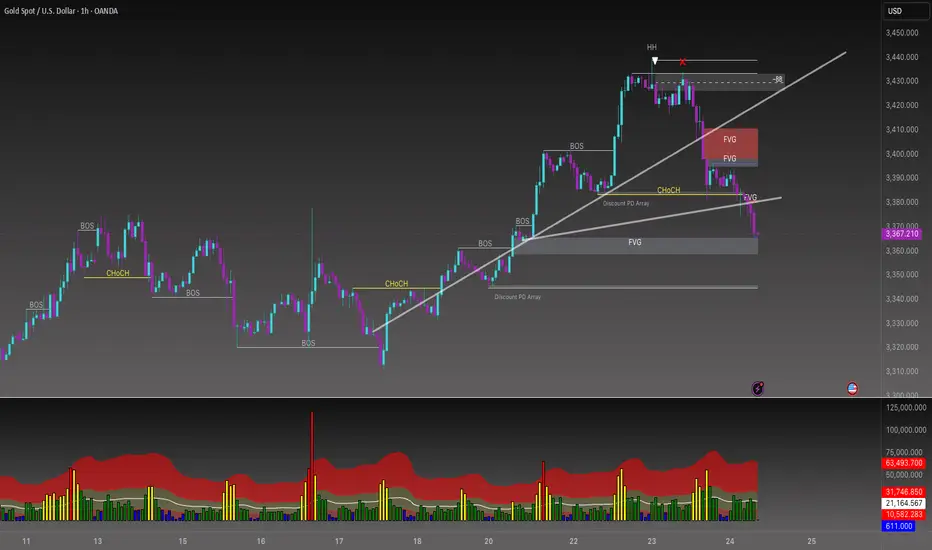
XAUUSD Price Analysis — Support Zone Reaction & Potential XAUUSD Price Analysis — Support Zone Reaction & Potential Bullish Reversal
🔍 Market Structure Overview
The chart shows a clear bullish market structure characterized by multiple Breaks of Structure (BOS) and a strong upward trend that recently corrected into a key support zone around 3360–3340.
This correction phase may be coming to an end as price reaches a high-probability demand area, with bullish reaction forming at the support level.
🧠 Smart Money Concept (SMC) Breakdown
📌 Break of Structure (BOS) confirms institutional activity and directional bias.
🔄 After a strong uptrend and BOS on July 22–23, a healthy retracement has taken place toward a major demand zone.
The support level is aligning with past consolidation and previous BOS zones, providing confluence for a bullish bounce.
📊 Technical Confluence
✅ Volume Profile (VRVP) shows strong buyer activity at current levels.
✅ The price is reacting within the support box with a small bullish candle, indicating potential accumulation.
✅ A clean liquidity sweep may have occurred just below minor lows, shaking out weak hands before a move upward.
🎯 Forecast
If price holds above the 3360 level, and bullish confirmation continues (e.g., break above minor lower highs), we can expect:
Short-term target: 3400
Major target: 3440 (marked resistance zone)
⚠️ Invalidation: A clean break and close below 3340 may lead to deeper correction or change in structure.
📘 Educational Title Suggestion
"Smart Money Reaction at Demand: XAUUSD Poised for Reversal from Key Support"

Gold vs US Dollar (XAUUSD) Technical AnalysisIf OANDA:XAUUSD gives us a strong bearish close below 3,365, I’m expecting momentum to kick in fast. With New York opening up, a swift move to 3,345 is on the table a level we’ve already marked in the Discount PD Array.
But if price holds steady around 3,365 and shows signs of rejection, I’m watching for a sharp bounce. A solid rejection with a spike could send gold back up to fill the imbalance and tag 3,388.
Gold Price Analysis July 23📈 Gold Trend Analysis – Strong Uptrend but Signs of Slowdown
Gold continued to set a new peak for the week when closing the day above 3430 – confirming that the uptrend is still dominant. However, buying power is starting to slow down as the market formed a fairly wide range, around 50 prices in today's session.
Profit-taking pressure at high prices can create a short-term correction, opening up two-way trading opportunities for flexible investors.
🔑 Important technical levels (Key Levels):
🔻 Resistance zone & Sell zone:
3445: Price rejection zone – can consider selling if price fails to break through.
3463: Strong Sell zone – expect increased supply here.
🎯 Sell target:
3405: Nearest support, target for short-term sell orders.
🟢 Buy Setup:
3402: Breakout zone in US session – if price breaks strongly through this support with good volume, consider buying on the next uptrend.

XAUUSD Analysis todayHello traders, this is a complete multiple timeframe analysis of this pair. We see could find significant trading opportunities as per analysis upon price action confirmation we may take this trade. Smash the like button if you find value in this analysis and drop a comment if you have any questions or let me know which pair to cover in my next analysis.

XAUUSD ShortAs Price cont to be bullish, i will be looking yo see how price reacts at the Resistance area in Purple and to secure some profit on a correction/pull back.
The trade will be a scalp and will be taken on a 5min chart IF confirmation is there..
As always Risk managment is key so the stop will trail accroding to my strat.

Gold’s Rapid Surge: A Trap Before the Drop?Gold finally showed signs of retreat. We are still holding a short position near 3400. So far, we have made a profit of 50 pips. However, I will still hold it to see if gold can fall back to the 3385-3375 area as expected. We have completed 2 transactions today, and there is still 1 transaction left to hold.
1. First, we bought gold near 3345 and ended the transaction by hitting TP: 3370, making a profit of 250 pips, with a profit of more than $12K;
2. We shorted gold near 3385 and ended the transaction by hitting SL: 3395, with a loss of 100 pips, a loss of nearly $5K;
3. We are still holding a short gold transaction order near 3400, with a current floating profit of 60 pips and a floating profit of nearly $4K;
The above is the detailed transaction situation today. To be honest, today's rebound strength far exceeded my expectations, and after our first long position hit TP, the market never gave any chance to go long on gold after a pullback, but accelerated to around 3401. But obviously, the accelerated rise of gold is suspected of catching up with the top, and in the short term it faces resistance in the 3405-3410 area, and secondly pressure in the 3420-3425 area. So I don't advocate chasing gold at the moment. On the contrary, I am still actively trying to short gold around 3400, first expecting gold to pull back to the 3385-3375-3365 area.
And I think if gold wants to continue to test the 3405-3415 area, or even sprint to the area around 3425, gold must go through a pullback to increase liquidity to accumulate upward momentum. I think it will at least pull back to the 3385-3375 area.
Very Strong Short!Hello all. as you see market needs a new lower low. a little above we have an Strong level that in throw the market down. be happy and Trade it if your method confirm. (wink)

XAUUSD For Swing Trade It has broken out of a symmetrical triangle and looking good for a swing trade.

Long and short battles to seize the opportunity to enter the mar
Yesterday, the technical aspect of gold formed a high and pierced the 3430 mark, then fell under pressure and fluctuated downward. The US market repeatedly fluctuated and suppressed the operation at the 3420 mark and further fell downward. The gold price accelerated downward to break through the 3400 mark and continued to fall back to around 3380 and then rebounded and closed in a volatile market. The daily K-line closed with a suppressed and adjusted mid-yin. After three consecutive trading days of rebound and upward breaking, the overall gold price finally ushered in a suppressed and adjusted closing in the negative. The daily level fell below the 5-day moving average support, but it was still above the 10-day moving average and the 20-day moving average to form a bullish strong oscillation pattern. The bullish upward pattern has not been destroyed. If your current trading is not ideal, I hope Yulia can make your investment smoother. Welcome to communicate!
From the analysis of the 4-hour line, today's support is at 3376-80. If the daily line stabilizes above this position, it is expected to rebound further. The upper short-term resistance is at 3397-3400. If this position is touched for the first time during the day, short selling can be seen once the shock falls. The overall bullish strong dividing line is at 3370. If the daily line stabilizes above this position, the rhythm of falling back to low and long remains unchanged. Short selling can only enter the market at key points, and fast in and out without fighting.
Gold operation strategy:
Gold falls back to 3370-75 line to buy, stop loss 3360, target 3397-3400 line, break and continue to hold;

Perfect Long Opportunity on Gold? Fibonacci & Price Action AlignThis is a 15-minute chart of Gold (XAU/USD) from TradingView (via Capital.com) with Fibonacci retracement levels and a long trade setup.
Chart Summary:
Timeframe: 15-minute
Instrument: Gold (XAU/USD)
Current Price: $3,390.01
Trade Type: Long (Buy) position
Technical Setup:
Fibonacci Retracement Levels:
0.382 at $3,390.44
0.5 at $3,388.69
0.618 at $3,386.95
0.786 at $3,384.46
Entry Area: Around 0.5 to 0.618 levels (~$3,388–$3,386)
Stop-Loss: Below 1.0 level (~$3,381.30)
Target: Just below the 0 Fibonacci level (~$3,396.09)
This setup suggests a potential retracement-based bounce after a significant drop. The trader is betting on a reversal from the Fibonacci support zone with a tight stop below $3,381 and aiming for a recovery up to $3,396.

The callback continuity is poor, and the bulls are still strong📰 News information:
1. Geopolitical situation
2. Tariff retaliation
📈 Technical Analysis:
Trump continued to lash out at the Fed, but seemed to have backed off on whether to remove Fed Chairman Powell. The continuous rise of the gold index, once close to 3440, also ushered in a new high in more than a month. Next, we need to pay attention to whether gold can reach the 3450 mark.
Judging from the daily chart, there were three times when it touched around 3450 and then fell back. If it breaks through and stabilizes above 3450 this time, the historical high of 3500 may be refreshed. If it cannot effectively break through 3450, the probability of subsequent retracement is still very high.
From the hourly chart, the bottom support is almost at 3405-3400. However, the recent rhythm belongs to the consolidation of the Asian and European sessions, the US session has begun to rise, and the risk of serious overbought data indicators is still there. This is why I told everyone in the morning that we need to be vigilant about the current rise. Waiting for a pullback to go long is relatively more stable. I also explained in the morning that if it falls below 3405-3400, the decline may continue to around 3385. After all, the fundamental purpose of our trading is to make a profit, so we must minimize the foreseeable risks to the greatest extent possible.
On the whole, if there is an obvious stop-loss signal at 3405-3400, you can consider going long and looking at 3450. Once it falls below 3400, don't chase it easily, and pay attention to the possibility of a retracement below 3385.
🎯 Trading Points:
BUY 3405-3400
TP 3440-3450
In addition to investment, life also includes poetry, distant places, and Allen. Facing the market is actually facing yourself, correcting your shortcomings, facing your mistakes, and exercising strict self-discipline. I share free trading strategies and analysis ideas every day for reference by brothers. I hope my analysis can help you.
FXOPEN:XAUUSD OANDA:XAUUSD FX:XAUUSD FOREXCOM:XAUUSD PEPPERSTONE:XAUUSD TVC:GOLD
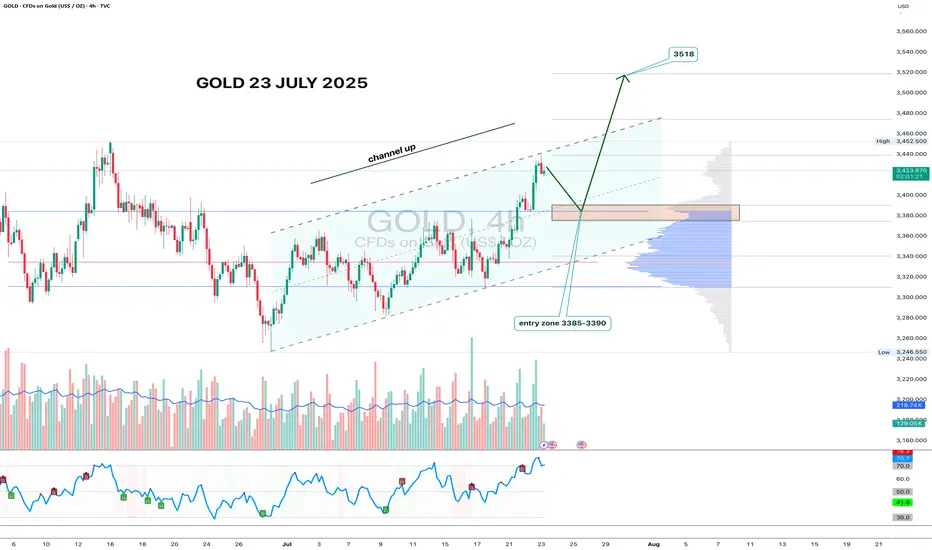
Gold 4H - channel breakout, looking for 3518 nextGold has formed a clean ascending channel on the 4H chart, broke out above resistance, and is now pulling back into the 3385–3390 zone. This area aligns with volume clusters - a perfect entry zone for bulls waiting on the sidelines.
If price holds this zone and prints a reversal candle with volume, the upside target remains at 3518 - the 1.618 Fibonacci extension and historical resistance. Volume increased during the breakout move, confirming interest. RSI still has room to go higher, supporting the bullish continuation.
Fundamentally, gold remains a safe-haven asset amid geopolitical tension, USD weakness, and potential Fed easing. Central bank accumulation further supports the bullish case.
Tactical setup:
— Entry zone: 3385–3390
— Trigger: candle confirmation + volume
— Target: 3518
— Invalidation: break below 3360 without buyer volume
If the plan plays out — gold might shine bright while bears squint in disbelief.
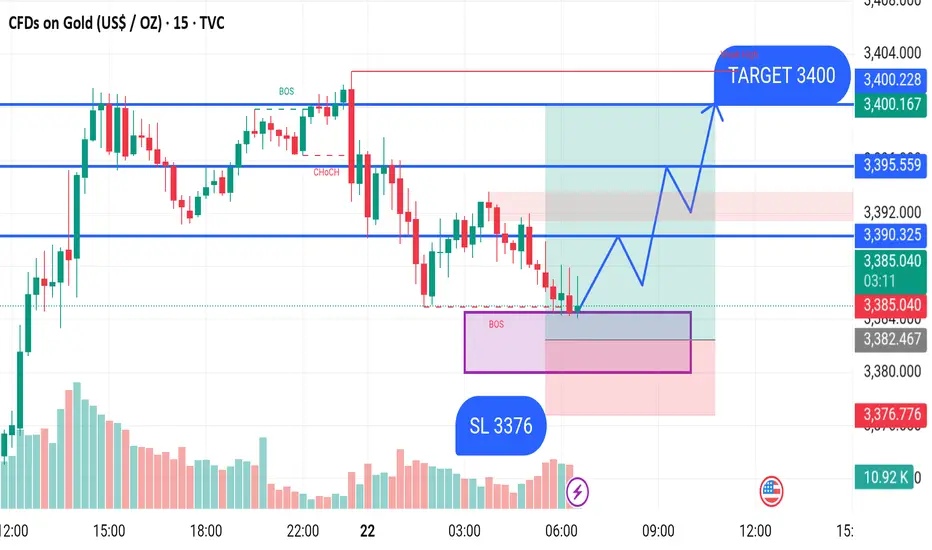
GOLD BUY M15 Gold (XAUUSD) Analysis – 15-Minute Timeframe
Date: July 22, 2025
The chart shows a bullish setup for Gold after a recent market structure shift. The price created a Break of Structure (BOS) followed by a Change of Character (CHoCH) indicating potential bullish momentum.
Currently, price is reacting from a demand zone (highlighted in purple) after a BOS on the lower side, suggesting a possible reversal.
Entry Zone:
Around 3382–3384
Stop Loss (SL):
Below the demand zone at 3376
Target:
3400 (previous swing high / weak high level)
Key Resistance Levels:
3390.32
3395.55
3400.22 (Target zone)
Bias: Bullish
If the price holds above the 3380 support and respects the demand zone, a bullish move toward the 3400 target is expected.
XAUUSD on spike Gold is currently holding rising channel along with the swing moves we took 180 pips On sell trade as I mentioned market has to respect previous BOS
What's possible scanarios we have?
▪️I'm looking for retracement at 3400-3395 for buying only if H4 remains above and my Targets will be 3425-3430.
▪️if H4 candle closing below 3380 my sell activates and Targets will be 3358 then 3345.

Gold 22 July 2025 updateGood afternoon, update to last week's post of 21 July on gold, which worked yesterday, new zone to buy, the chart shows everything in detail, so today with the message "brevity is the sister of talent"
#GOLD
BUY LIMIT ZONE 3365-3370
🎯 TP1: 3385
🎯 TP2: 3400
🎯 TP3: 3412
🎯 TP3: 3428
⛔️ Stop loss: 3355
Regards, Totoshka™


Long XAUUSDElite Analysis
30m Bullish BOS
Broke away from structural liquidity
Targeting highs
This is an A set up (Not A+)
Executed on the 15m TF.
SellRejection Level
Daily Volume
Market Structure Shift
London Session
Trend Line Break
Untapped Order Point

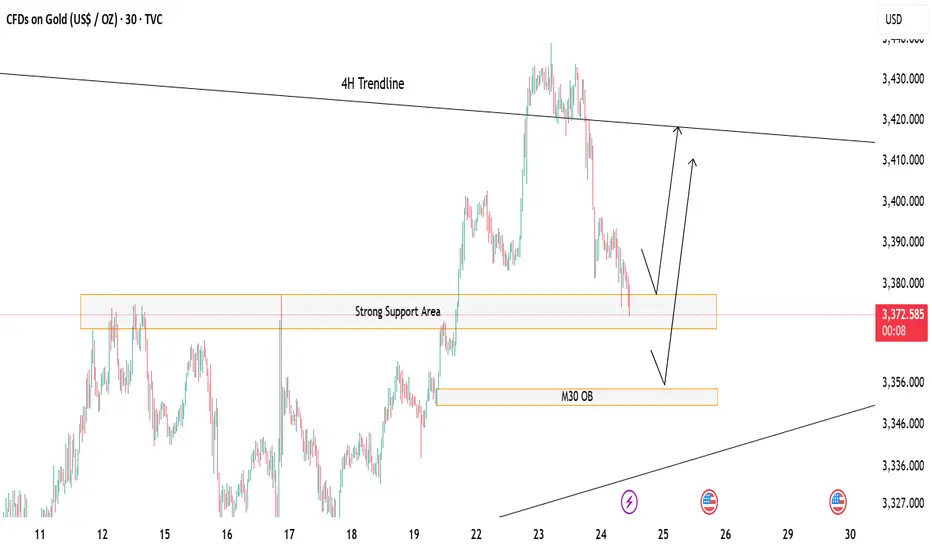
Gold at Key Decision Zone – Bounce or Break?Price is currently hovering above a strong support zone, showing potential for a short-term bounce. 🔁
If this zone holds, we could see a bullish reaction toward the 4H trendline resistance above. 📈
However, a break below may lead price to drop and tap into the M30 Order Block (OB) for a deeper mitigation before any move up. ⚠️
If this happen we could look for potential sell till the OB test otherwise the buying opportunity should focused more
🎯 Watch these key zones carefully – market is at a decision point!
Both buy and sell setups possible depending on how price reacts at these levels.
Gold------sell near 3392, target 3370-3350Gold market analysis:
Yesterday, gold in the European and American markets plunged directly. It is cold at high places. Gold has already experienced four big plunges above 3435. From the perspective of form, there is a super pressure there. We also reminded in the analysis yesterday that the rhythm of gold daily lines in the past two days has changed very quickly, and it is all shocks and then quickly pulls up and ends directly. It is basically difficult to follow its rhythm without direct pursuit. The big negative line of the daily line has destroyed the strong support near 3402-3404. This position has been converted into a new strong pressure. Today's idea is to adjust the bearish trend and continue to sell on the rebound. The adjustment of the daily line is not sure whether it is an adjustment of the wave structure, but it can be determined to sell in the short term. We are just a trend follower. Today, gold will not rebound above 3402 and is basically weak.
Gold plunged directly in the Asian session, and the selling force is still relatively strong. At present, the new low strong support of the daily line has not appeared. The next moving average support of the daily line is around 3366. I estimate that there will be a rebound at this position. If the hourly Asian session does not fall and rebounds first, consider continuing to sell it at 3395 and 3402. Gold likes to convert quickly recently. If it stands on 3404, it will be reconsidered.
Support 3374, 3366 and 3350, suppress 3395 and 3402, and the weak watershed before the market is 3395.
Fundamental analysis:
Tariffs have not affected the market recently, and there is no major news released. The market is relatively calm.
Operation suggestion:
Gold------sell near 3392, target 3370-3350
