Gold Analysis and Trading Strategy | July 25✅ Fundamental Analysis:
🔹 Political Pressure on the Federal Reserve Increases Safe-Haven Demand
President Trump made a rare visit to the Federal Reserve, pressuring it to cut interest rates. At the same time, his political allies filed a lawsuit against Fed Chair Jerome Powell, demanding a public meeting. These events have raised concerns over the Fed’s independence and the outlook for U.S. monetary policy, increasing long-term uncertainty. This serves as a medium- to long-term bullish factor for safe-haven assets like gold.
🔹 Rising Geopolitical Tensions Fuel Safe-Haven Demand
The U.S. has withdrawn from the Doha ceasefire negotiations, accusing Hamas of insincerity. Meanwhile, military tensions between Thailand and Cambodia have escalated, with cross-border clashes intensifying. Should the conflict broaden, safe-haven buying of gold could be triggered, further supporting prices.
✅ Technical Analysis:
🔸 On the daily chart, gold has closed lower for two consecutive sessions, forming a “two black crows” pattern—an indication that bearish momentum is gradually taking control and market sentiment is turning pessimistic. Although a short-term consolidation or rebound is possible, the broader trend remains bearish.
🔸 The $3340 level on the daily chart is a key support zone. It marks not only a crucial dividing line for the previous uptrend but also a critical battleground for bulls and bears. If this level holds, a technical rebound could follow; if it breaks, gold may continue its decline toward the $3310 area.
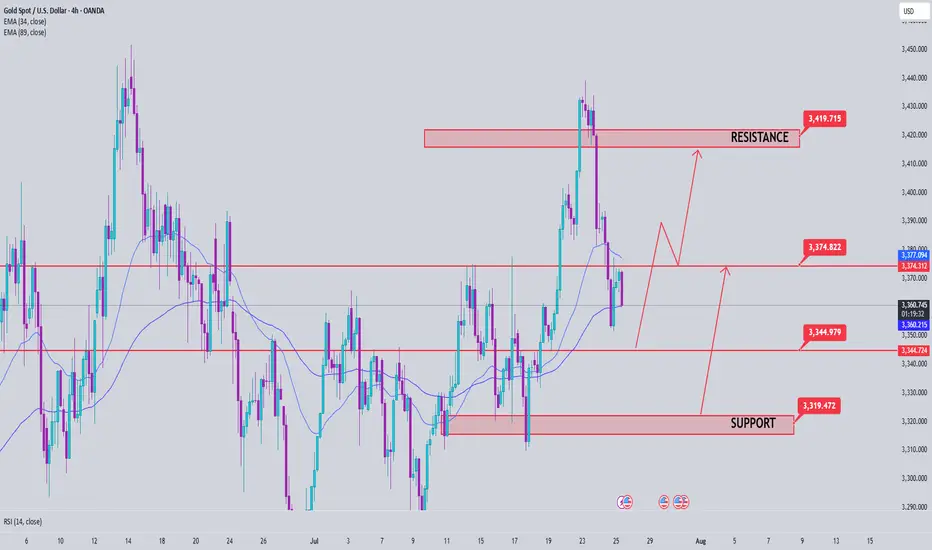
🔴 Resistance Levels: 3373–3375 / 3382–3390
🟢 Support Levels: 3340–3335 / 3330–3310
✅ Trading Strategy Reference:
🔻 Short Position Strategy:
🔰Consider entering short positions in batches if gold rebounds to the 3365-3370 area. Target: 3355-3345;If support breaks, the move may extend to 3340.
🔺 Long Position Strategy:
🔰Consider entering long positions in batches if gold pulls back to the 3335-3340 area. Target: 3365-3375;If resistance breaks, the move may extend to 3380.
🔥Trading Reminder: Trading strategies are time-sensitive, and market conditions can change rapidly. Please adjust your trading plan based on real-time market conditions. If you have any questions or need one-on-one guidance, feel free to contact me🤝
XAUUSD trade ideas

GOLD (XAUUSD) Intraday Idea LongGold been keeping falling on both Asian and European sessions.
Most probably likely to pullback to London high after the New York session open.
Let's see if this plays out!
Good Luck!

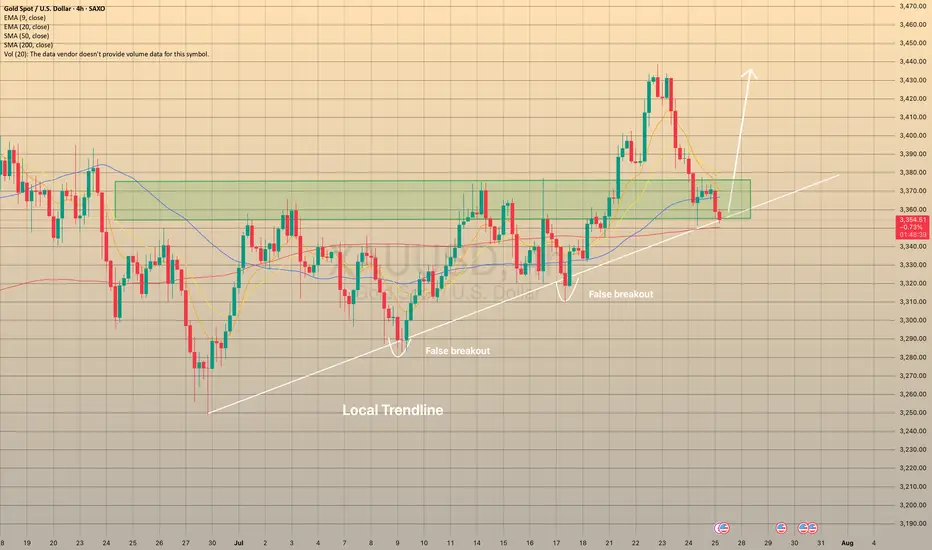
XAUUSD REACHED THE LOCAL TRENDLINEXAUUSD REACHED THE LOCAL TRENDLINE
On July 24 the U.S. Manufacturing PMI report came out way below forecasted (49.5 actual vs 52.6 forecasted). A number below 50 causes concerns among investors and could be a sign of an overall economic slowdown or recession. So, as a result, it could lead to an increase in demand for safe assets like gold.
However, today the price, despite the recent rebound from the trendline after report, came to the trendline once again. There is a high possibility that the price will rebound in nearest future: besides the local trendline we may observe the sma200 on 4-h chart. Additionally, we entered the price zone of 3,350.00-3,375.00, which used to be a resistance zone, now may play out as a support. In case of rebound, the price may go to local highs of 3,440.00 at least.
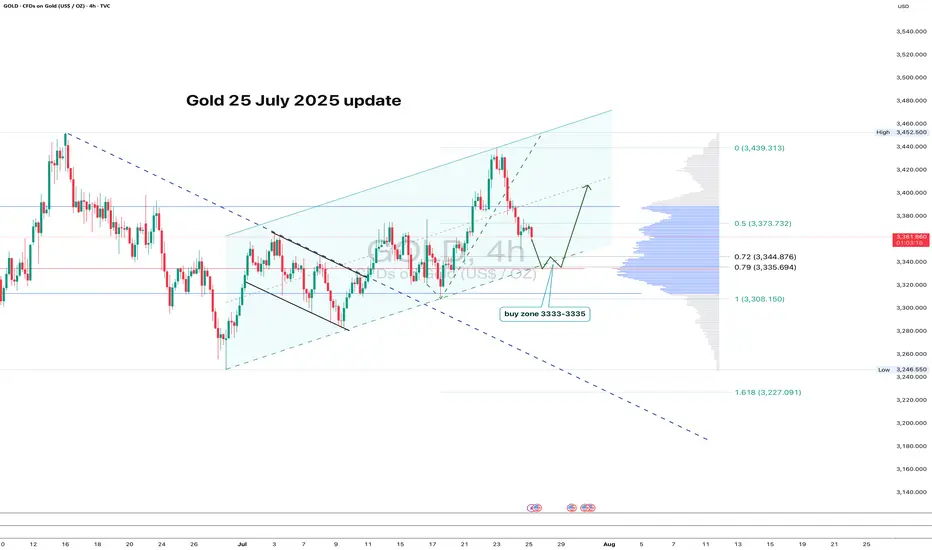
GOLD: clean pullback - now let’s see if support holdsGold continues to trade within an ascending channel on the 4H chart. After a local high, the price pulled back and is now approaching the key zone at 3333–3335. This area lines up with the 0.79 Fib retracement, the lower channel boundary, and a major volume cluster — a classic confluence zone.
If buyers show up here and we get a bullish reversal candle, this becomes a valid long setup with a tight stop just below the level. First target is 3373 (0.5 Fib), followed by a potential retest of the high near 3439.
The structure remains intact, the pullback is orderly, and volume supports the move. As long as the channel holds - the bias stays bullish.
Gold price analysis July 25Gold Analysis – D1 Uptrend Still Maintains, But Needs New Momentum
Yesterday’s trading session recorded a D1 candle closing above the Breakout 3363 zone, indicating that buying power in the US session is still dominant. This implies that the uptrend is still being maintained, although the market may need a short-term technical correction.
In today’s Tokyo and London sessions, there is a possibility of liquidity sweeps to the support zone below before Gold recovers and increases again in the New York session.
Important to note:
The uptrend will only be broken if Gold closes below the 3345 zone on the D1 chart.
In this case, the 3320 level will be the next support zone to observe the price reaction and consider buying points.
For the bullish wave to continue expanding towards the historical peak (ATH) at 3500, the market needs stronger supporting factors, which can come from economic data or geopolitical developments.
📌 Support zone: 3345 – 3320
📌 Resistance zone: 3373 – 3418
🎯 Potential buy zone:
3345 (prioritize price reaction in this zone)
3320 (in case of breaking through 3345)
🎯 Target: 3417

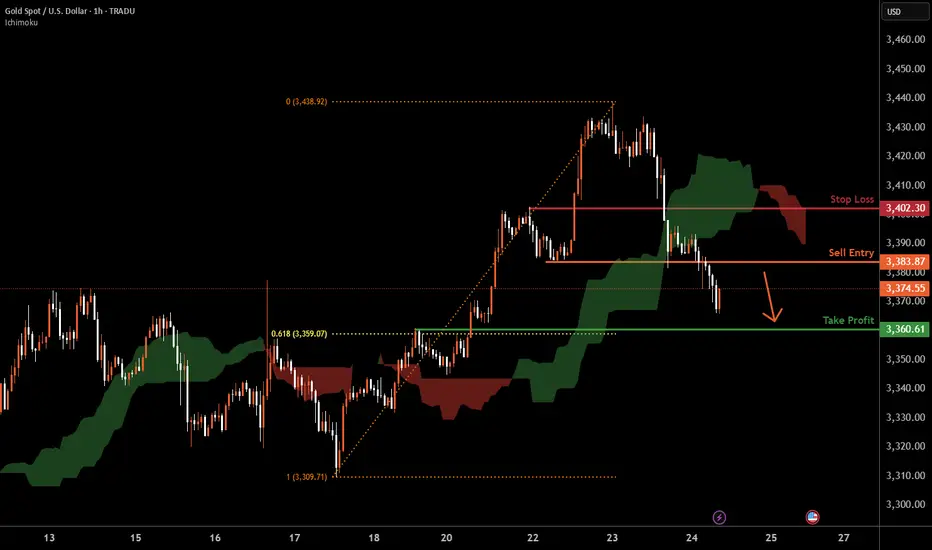
XAUUSD H1 I Bearish Reversal Based on the H1chart, the price is approaching our sell entry level at 3383.87, a pullback resistance.
Our take profit is set at 3360.61, a pullback support that aligns with the 61.8% Fib retracement.
The stop loss is set at 3402.30, a pullback resistance.
High Risk Investment Warning
Trading Forex/CFDs on margin carries a high level of risk and may not be suitable for all investors. Leverage can work against you.
Stratos Markets Limited (tradu.com ):
CFDs are complex instruments and come with a high risk of losing money rapidly due to leverage. 63% of retail investor accounts lose money when trading CFDs with this provider. You should consider whether you understand how CFDs work and whether you can afford to take the high risk of losing your money.
Stratos Europe Ltd (tradu.com ):
CFDs are complex instruments and come with a high risk of losing money rapidly due to leverage. 63% of retail investor accounts lose money when trading CFDs with this provider. You should consider whether you understand how CFDs work and whether you can afford to take the high risk of losing your money.
Stratos Global LLC (tradu.com ):
Losses can exceed deposits.
Please be advised that the information presented on TradingView is provided to Tradu (‘Company’, ‘we’) by a third-party provider (‘TFA Global Pte Ltd’). Please be reminded that you are solely responsible for the trading decisions on your account. There is a very high degree of risk involved in trading. Any information and/or content is intended entirely for research, educational and informational purposes only and does not constitute investment or consultation advice or investment strategy. The information is not tailored to the investment needs of any specific person and therefore does not involve a consideration of any of the investment objectives, financial situation or needs of any viewer that may receive it. Kindly also note that past performance is not a reliable indicator of future results. Actual results may differ materially from those anticipated in forward-looking or past performance statements. We assume no liability as to the accuracy or completeness of any of the information and/or content provided herein and the Company cannot be held responsible for any omission, mistake nor for any loss or damage including without limitation to any loss of profit which may arise from reliance on any information supplied by TFA Global Pte Ltd.
The speaker(s) is neither an employee, agent nor representative of Tradu and is therefore acting independently. The opinions given are their own, constitute general market commentary, and do not constitute the opinion or advice of Tradu or any form of personal or investment advice. Tradu neither endorses nor guarantees offerings of third-party speakers, nor is Tradu responsible for the content, veracity or opinions of third-party speakers, presenters or participants.
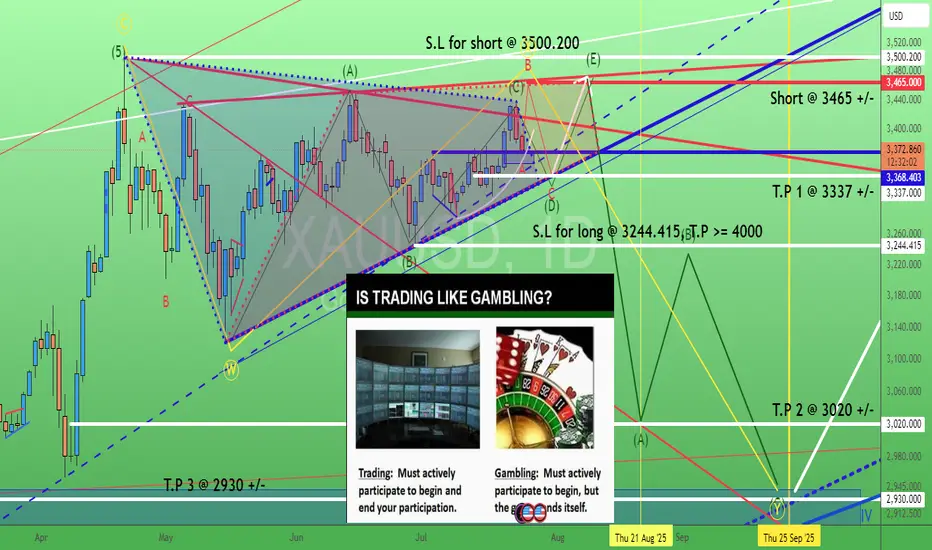
Gold. How to "kill" bull or bear (triangle)? 24/July/25XAUUSD. are you betting (gambling) OR trading for bull/bear triangle? With or without "active lost/cut lost"?.. No stop lost = passive (cut) lost = Let the "gambling" games end for you. Not you end the "trading" any time actively. The "happy ending" always come with good risk management with good risk/reward ratio where ONLY happened when we have T.P and S.L plans.
Gold’s Next Move: Bounce or Breakdown?Gold is pulling back after breaking the 3,360 USD resistance on the 6-hour chart. Price is currently testing the nearest fair value gap (3,370–3,380), but upside momentum is stalling, partly due to unfilled supply zones above.
A retest of the lower FVG near 3,340 will be key. Holding above this level could trigger renewed buying, while a break below may invalidate the bullish structure.
Traders should closely monitor whether downside gaps continue to fill and how price behaves near support zones. Lack of strong liquidity could lead to a false breakout.

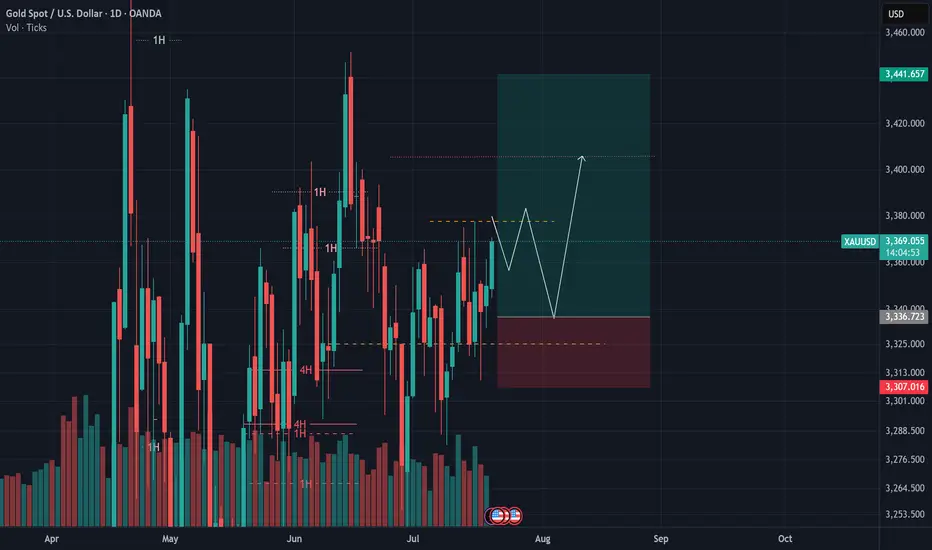
Gold Pulls Back to Support Zone📊 Market Overview:
• Gold price fell sharply to $3,385/oz, after previously testing the $3,430 zone.
• Short-term profit-taking and anticipation of upcoming U.S. economic data (PMI, durable goods orders) caused a mild USD rebound, pressuring gold lower.
• Overall sentiment remains cautious as the Fed has yet to clearly signal a rate cut path.
📉 Technical Analysis:
• Key Resistance: $3,430 – $3,445
• Nearest Support: $3,382 – $3,368
• EMA 09: Price just broke below the 9 EMA, suggesting a potential deeper correction unless it rebounds quickly.
• Candlestick/Volume/Momentum: Bearish engulfing candle with rising volume – indicates strong selling pressure and momentum currently favoring the bears.
📌 Outlook:
Gold is undergoing a short-term correction, currently testing the strong technical support zone at $3,382 – $3,385. If this zone holds, we may see a rebound toward $3,410 – $3,420. If it fails, gold could slide further toward $3,368 – $3,350.
💡 Suggested Trade Strategies:
🔻 SELL XAU/USD at: 3,395 – 3,400
🎯 TP: 3,375
❌ SL: 3,405

GOLD LOCAL LONG|
✅GOLD went down from
The resistance just as I predicted
But a strong support level is ahead at 3380$
Thus I am expecting a rebound
And a move up towards the target of 3400$
LONG🚀
✅Like and subscribe to never miss a new idea!✅
Disclosure: I am part of Trade Nation's Influencer program and receive a monthly fee for using their TradingView charts in my analysis.

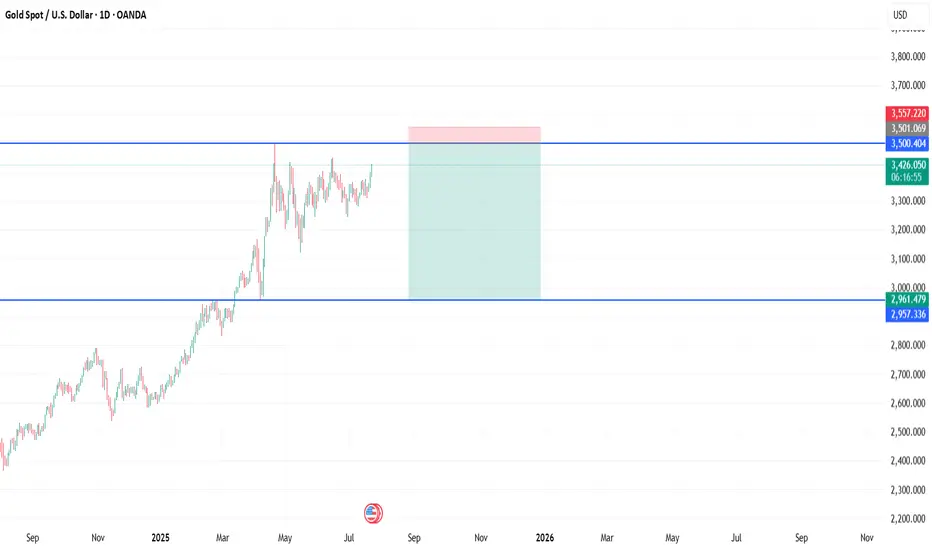
XAU / USD Daily ChartHello traders. I posted a weekly chart last night. Looking at the Daily chart, I have shown my areas of interest to watch. I will post a 4 hour / lower time frame chart in a bit. We have the NY market opening in half an hour. Let's see how things play out. Big G gets my thanks. Be well and trade the trend.

Long towards 3450.00Bullish Rally continues, Expecting it from 3418 area.
This is not a financial advice. Just my trade idea for small 3 positions
XAU / USD 1 Hour ChartHello traders. I am gonna post this quick to get back to the chart. I am looking at trying to ride this push up, but I can also see a pullback as a potential trade as well. Watching the 30 min chart as well. Let's see how things play out. Big G gets my thanks. Be well and trade the trend.
I had to edit this and put that my buy entry was $3407.55 Kaboom.. I have already secured and closed 75% of the trade's profit after 40 pips. My Stop Loss is at my entry point and my runner(the remaining 25% of the trade) is running. All done for the day, just like that.

SellRejection Level
Daily Volume
Market Structure Shift
London Session
Trend Line Break
Untapped Order Point

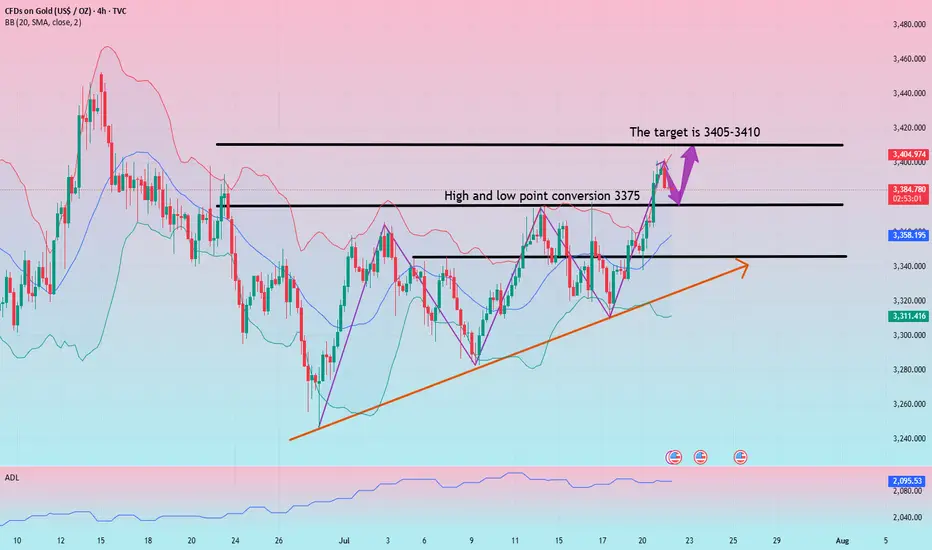
Can gold continue to fall slowly sideways? Focus on the 3375 wat
On Tuesday, spot gold fell back mildly after yesterday's surge. The current gold price is around $3,384/ounce. Spot gold prices surged more than 1% on Monday and hit a five-week high. The main reason was that the US dollar and US bond yields plummeted, and investors were uneasy about the approaching deadline for tariff negotiations on August 1. The market is facing various uncertainties, which does provide support for gold.
Views on today's gold trend!
After more than a month of volatile trends, gold once again broke through the integer mark of 3,400 on the first trading day of this week. Under the current bullish sentiment of creating a new high, the previous short-term downward trend ended. From the daily chart, gold is still in an upward trend in the long term. The previous market rebounded effectively after touching the downward trend line, and the rebound force was considerable. With the restart of the bullish force, the main idea can carry the trend and buy on dips.
From the 4-hour chart, the continuous rise of gold and the turning of the moving average have made the market bulls more aggressive, which means that the previous short-term downward trend has ended. At present, a new trend is opening up in the 4-hour chart. The rise of gold has also established an upward trend line. You can consider buying on dips against the 3375 watershed.
Gold: Buy near 3375, defend 65, and target 3405-3410!
XAUUSD H1 I Bearish Reversal Based on the H1 chart analysis, we can see that the price is testing our sell entry at 3392.84, which is a pullback resistance.
Our take profit will be at 3377.57, a pullback support level.
The stop loss will be placed at 3411.50, which is a swing high resistance level.
High Risk Investment Warning
Trading Forex/CFDs on margin carries a high level of risk and may not be suitable for all investors. Leverage can work against you.
Stratos Markets Limited (tradu.com ):
CFDs are complex instruments and come with a high risk of losing money rapidly due to leverage. 66% of retail investor accounts lose money when trading CFDs with this provider. You should consider whether you understand how CFDs work and whether you can afford to take the high risk of losing your money.
Stratos Europe Ltd (tradu.com ):
CFDs are complex instruments and come with a high risk of losing money rapidly due to leverage. 66% of retail investor accounts lose money when trading CFDs with this provider. You should consider whether you understand how CFDs work and whether you can afford to take the high risk of losing your money.
Stratos Global LLC (tradu.com ):
Losses can exceed deposits.
Please be advised that the information presented on TradingView is provided to Tradu (‘Company’, ‘we’) by a third-party provider (‘TFA Global Pte Ltd’). Please be reminded that you are solely responsible for the trading decisions on your account. There is a very high degree of risk involved in trading. Any information and/or content is intended entirely for research, educational and informational purposes only and does not constitute investment or consultation advice or investment strategy. The information is not tailored to the investment needs of any specific person and therefore does not involve a consideration of any of the investment objectives, financial situation or needs of any viewer that may receive it. Kindly also note that past performance is not a reliable indicator of future results. Actual results may differ materially from those anticipated in forward-looking or past performance statements. We assume no liability as to the accuracy or completeness of any of the information and/or content provided herein and the Company cannot be held responsible for any omission, mistake nor for any loss or damage including without limitation to any loss of profit which may arise from reliance on any information supplied by TFA Global Pte Ltd.
The speaker(s) is neither an employee, agent nor representative of Tradu and is therefore acting independently. The opinions given are their own, constitute general market commentary, and do not constitute the opinion or advice of Tradu or any form of personal or investment advice. Tradu neither endorses nor guarantees offerings of third-party speakers, nor is Tradu responsible for the content, veracity or opinions of third-party speakers, presenters or participants.

Gold (XAU/USD) Bullish Outlook Based on Price ActionGold (XAU/USD)**, showing a bullish outlook based on price action and support zones.
**Chart Analysis:**
* **Current Price:** \$3,359
* **EMA Signals:**
* EMA 7: \$3,353
* EMA 21: \$3,345
* EMA 50: \$3,341
**Bullish EMA alignment** (short EMAs above long) signals upward momentum.
* **Support Zones:**
* **S1**: \~\$3,345 (strong short-term demand area)
* **S2**: \~\$3,325 (deeper support zone)
* **Volume:** Spikes in green bars signal strong buyer interest near support, especially during the bounce.
* **Projected Move (Green Arrow):**
* A potential retest of the breakout zone (\~\$3,350) could happen before gold targets the **next key resistance** near **\$3,410**.
**Summary:**
Gold broke above a consolidation range supported by EMA alignment and strong volume. As long as the price stays above S1 (\$3,345), the trend remains bullish with upside potential toward \$3,400–\$3,410. A pullback may occur first, offering re-entry opportunities.

Gold Analysis – July 20, 2025In our previous updates, we highlighted the 3350–3360 zone as a critical resistance that could trigger a pullback toward the 3200 level.
📉 Over the past week, price tested this zone multiple times, and each time we saw a sharp rejection of 400–500 pips.
This behavior clearly indicates that liquidity has been absorbed in this area, and short sellers have likely hit their targets.
📈 Now, the market dynamics are shifting.
With sellers exiting and the zone losing its bearish pressure, we could be looking at the beginning of a new bullish leg. The first key resistance on the upside is 3400.
⚠️ However, considering the number of high-impact events expected this week, I personally prefer to wait for a low-risk entry closer to 3320–3330 rather than chasing the move early.
Stay alert — this week could bring high volatility and major trend moves.
Gold next target According to analysis Gold next target around 3377 /3400 possible move next week if you satisfied with analysis you play

XAUUSD buy when touched the black trendlinethis is a high possible scenario which means the Gold will still be on a bullish cycle

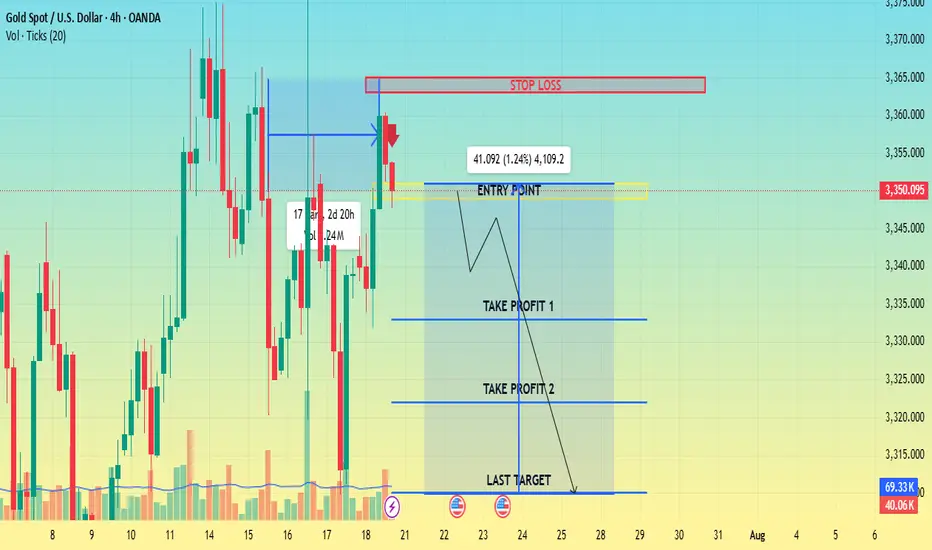
CHECK XAUUSD SIGNAL READ CAPTAIN
Entry Point: Around 3351.000 3349.000
Stop Loss: Around 3365.000
🎯 Target Levels
Take Profit 1:
3333.000
Take Profit 2:
3322.000
last target
3310.000