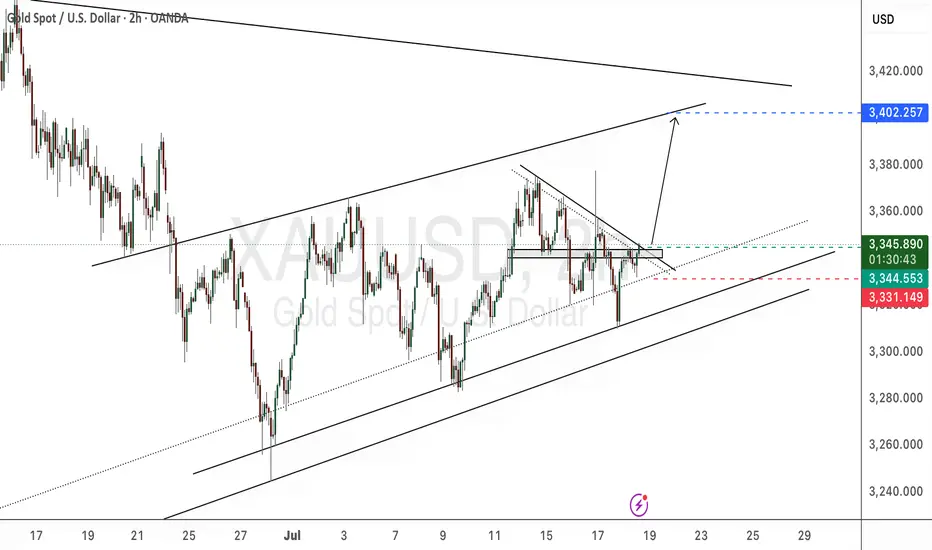
Continue to go long after bottoming outYesterday, the Trump and Powell incident caused gold to rise strongly to around 3377. The rise in gold was only short-lived. In the end, gold closed positively on the daily line, but it closed with a super long upper shadow line. In the end, the gold price quickly rose and broke through the 3377 mark, but fell back under pressure and closed in a volatile market. The daily K-line closed high and fell back in a volatile market. Although the overall gold price repeatedly fluctuated and washed out under the stimulation of news, it ultimately failed to break through the recent large box oscillation range. Today we continue to pay attention to the support line of 3318-25 below, and we will continue to go long if it falls back!
From the 4-hour analysis, the short-term support below continues to focus on around 3318-25, the short-term suppression above focuses on the 3340-45 line, and the key pressure above focuses on the 3380 line. Relying on this range as a whole, the main tone of high-altitude and low-multiple cycles remains unchanged. In the middle position, watch more and do less, be cautious in chasing orders, and wait patiently for key points to enter the market.
XAUUSD trade ideas

Gold is Moving Sideways – A Potential Triangle Formation?Gold is currently trading in a sideways pattern, potentially forming a triangle consolidation. This type of setup often precedes a strong breakout. At the moment, price action is showing hesitation near key resistance. Traders should wait for a confirmed breakout above the upper boundary of the triangle to validate a bullish continuation.
Patience is key—wait for the breakout before taking action.

XAUUSD Analysis : Gold's Bullish Comeback + Target📊 Chart Overview:
Gold has shown a technically strong structure on the 4-hour time frame, respecting multiple layers of support, while slowly shifting momentum in favor of buyers. What stands out most in this chart is the parabolic curve formation at the bottom, labeled the "Black Mind Curve Support" — a key psychological zone that has guided price action back to the upside.
Let’s walk through the key elements and why this current setup deserves your attention:
🧠 1. Black Mind Curve Support – Bullish Base Formation:
This curved structure at the bottom is no ordinary pattern. It reflects gradual accumulation and buyer dominance, often seen in textbook rounded bottom formations. The market printed multiple higher lows along this curve, suggesting a deliberate and patient entry by smart money.
Whenever price touched this curve, it found strong demand — a clear sign that the bulls are defending their territory.
🧱 2. Channel Support + SR Interchange – Historical Demand:
Zooming into the left side of the chart, you’ll notice how price dropped into a converging zone where a descending channel support intersected with a historical support/resistance (SR) level. This confluence created a high-probability buy zone — the very origin of the current bullish wave.
This channel breakout also represents a structural shift, marking the beginning of bullish control.
🔁 3. Major SR – Interchange Zone:
One of the most critical areas in this chart is the Major SR Interchange zone, where former resistance was broken and later retested as support. This is a classic support-resistance flip — the type of zone institutional traders watch closely.
This level currently acts as a launchpad for bulls, reinforcing bullish structure and offering low-risk long opportunities when respected.
⚔️ 4. Minor BOS (Break of Structure):
Recently, the price broke above a short-term lower high, indicating a minor bullish break of structure. This is confirmation that momentum has shifted in the short term. Such BOS events are powerful signals, especially when backed by curve support and SR flips.
This also paves the way for the price to push into the next liquidity pocket above.
🧭 5. Central Zone – 50% Equilibrium:
The horizontal line drawn around the $3,330 level marks the central 50% zone — the midpoint of this entire price range. This acts as a natural equilibrium zone where buyers and sellers usually fight for control.
Price is now trading above this zone, giving the upper hand to bulls. Holding above the 50% line increases the probability of continuation to higher resistance levels.
🧨 6. Target Area – "Next Reversal Zone":
Looking ahead, the $3,370 – $3,380 range is labeled as the Next Reversal Zone. This is where sellers previously stepped in and rejected price hard. However, if momentum remains strong and bulls can push price into this zone again, we might witness either:
A sharp pullback (if bearish reaction occurs), or
A major breakout above toward the $3,400 key resistance (if buyers overpower).
This is the zone to watch for either short-term profit taking or potential trend continuation setups.
📌 Key Technical Levels:
Immediate Support: $3,330 – $3,315 (Central + Retest Zone)
Major Support: $3,290 (Mind Curve Base)
Short-Term Resistance: $3,370 – $3,380 (Reversal/Reaction Zone)
Bullish Continuation Target: $3,400+
📒 Conclusion & Strategy Insight:
This chart presents a textbook bullish reversal setup with clean structural progression:
Price formed a rounded base
Broke out of previous range resistance
Retested multiple key SR zones
Now targeting liquidity above
The bulls are in control as long as the price remains above the curve and the major SR zone. A retracement into $3,330 could offer an ideal long entry, targeting the $3,370–$3,380 zone with tight risk.
✅ Suggested Trading Approach:
Buy Opportunities: On pullbacks toward $3,330–$3,315 with confirmation
Sell Watch: Near $3,375–$3,380 if bearish divergence or strong rejection appears
Invalidation: Break and close below $3,290 curve support
🧠 Final Thoughts:
Gold continues to build a strong bullish base. The parabolic nature of the support curve suggests rising demand. As long as support holds, the bulls may take price to fresh highs in the coming days.
Keep an eye on how price behaves around the Next Reversal Zone — that will reveal whether this bullish rally is ready for a breakout or a cooldown.

XAU AnalysisIf the price reaches the lower pips and confirms, you can consider buying for 300 to 500 pips.

Gold Price Analysis July 18XAUUSD Analysis
Gold has just had a deep sweep to 3310 before bouncing back within the trading range. Currently, the price is reacting at the Trendline area around 3344. This is an important level - if broken, gold can return to the uptrend, with the nearest target at 3373.
🔹 Key Levels
Support: 3332 - 3312
Resistance: 3344 - 3357 - 3373 - 3389
🔹 Trading Strategy
BUY trigger: when price breaks 3344
BUY DCA: when price surpasses 3353
SL: below 3332
Target: 3373
💡 Note:
The 3332 area plays an important role in the bullish wave structure, suitable for placing Stop Loss for BUY orders.

GOLD SELLERS WILL DOMINATE THE MARKET|SHORT
GOLD SIGNAL
Trade Direction: short
Entry Level: 3,337.24
Target Level: 3,283.55
Stop Loss: 3,372.93
RISK PROFILE
Risk level: medium
Suggested risk: 1%
Timeframe: 9h
Disclosure: I am part of Trade Nation's Influencer program and receive a monthly fee for using their TradingView charts in my analysis.
✅LIKE AND COMMENT MY IDEAS✅
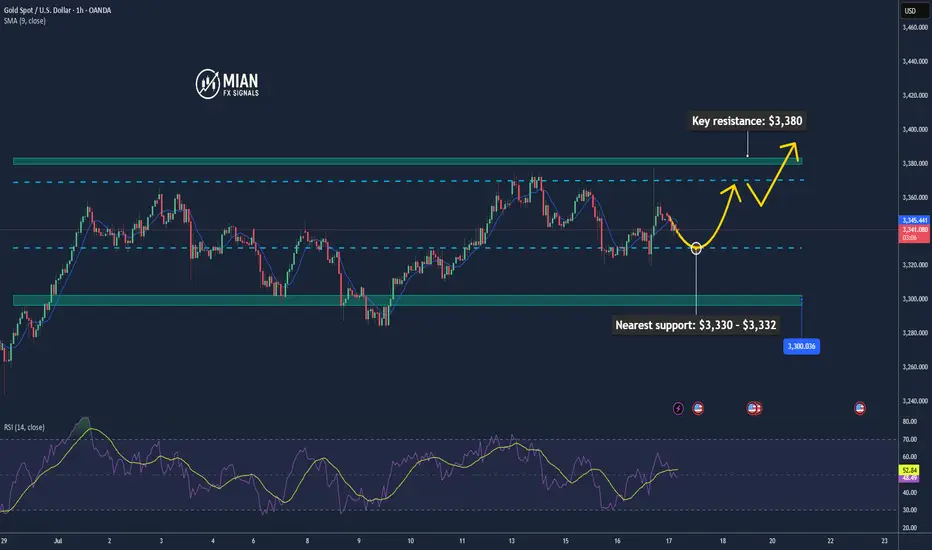
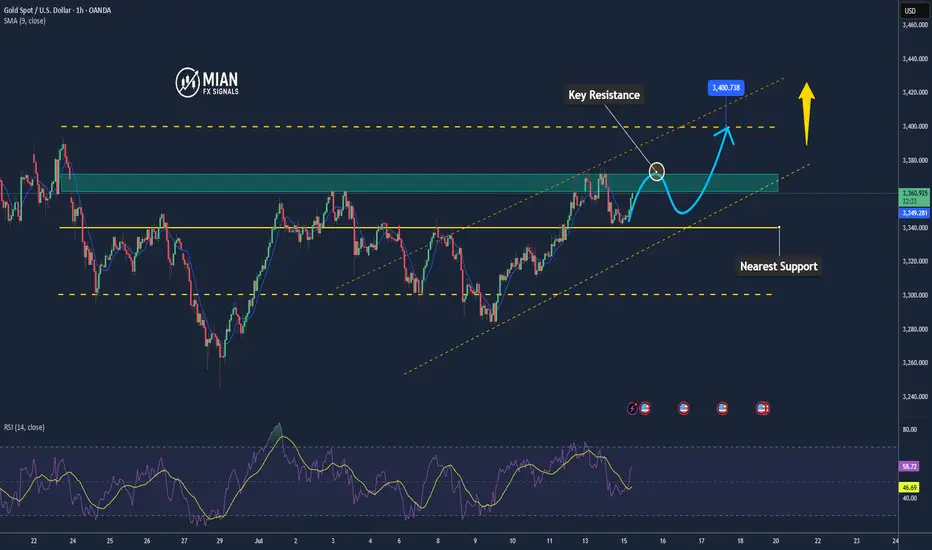
Gold Continues Short Term Uptrend📊 Market Overview:
💬Gold is currently trading around $3,340 – $3,352/oz, down slightly (~0.25%) on the day but still consolidating near recent highs around $3,500.
🌍 Geopolitical tensions (trade wars, Middle East conflicts) and strong central bank gold purchases continue to support long-term demand.
📅Markets are awaiting key U.S. inflation data and Fed signals, which may trigger volatility in the short term.
📉 Technical Analysis:
🔺Key resistance: $3,360 – $3,380, with the psychological zone at $3,400–$3,420.
🔻Nearest support: $3,330 – $3,332, followed by a firmer zone at $3,300–$3,326 (based on Fibonacci and moving averages).
• EMA/MA:
✅ Price is trading above the 50-day MA ($2,862), confirming a medium-term uptrend.
⚠️ While no specific EMA 09 data is noted, current price action suggests bullish momentum.
• Momentum / Candlestick / Volume:
📏RSI (14) is near 50–55, signaling positive momentum without being overbought.
🔄MACD is slightly negative but the overall structure remains bullish.
📌 Outlook:
Gold may continue to rise in the short term if it holds above the $3,330–$3,332 support zone, with potential to test resistance at $3,360–$3,380 and possibly revisit the $3,400 level.
A break below $3,330 could open the path toward deeper support around $3,300.
💡 Suggested Trading Strategy:
SELL XAU/USD: 3,367–3,370
🎯 TP: 40/80/200 pips
❌ SL: 3,374
BUY XAU/USD: 3,330–3,333
🎯 TP: 40/80/200 pips
❌ SL: 3,326
Up then Down!Hello all. price probably (Probably) will make a new High then Collapse to break the Low. be happy (wink)

Gold (XAU/USD) 4-hour chart4-hour chart of Gold (XAU/USD)** showing a key technical setup near the \$3,344 level. Price action is testing a significant **resistance zone** highlighted in grey, with two possible scenarios unfolding from this level.
**Chart Analysis Overview:**
* Gold has been in a **bullish short-term trend**, forming higher lows and pushing above the **EMA 7, 21, and 50**, all converging near the \$3,324–\$3,331 area (acting as dynamic support).
* Price is now approaching a **multi-tested resistance zone** near \$3,360–\$3,390, where it has previously faced selling pressure.
* Volume is rising, supporting the current bullish momentum.
**Scenario 1: Bullish Breakout (Green Path)**
**Conditions:**
* Price breaks and holds above the \$3,360–\$3,390 resistance zone.
* Continued bullish momentum supported by trade tensions, safe-haven demand, and Fed uncertainty.
**Target:**
* First target: \$3,400
* Extension: \$3,420–\$3,440 zone if momentum strengthens.
**Invalidation:**
* Failure to hold above \$3,360–\$3,390 range could limit upside potential.
**Scenario 2: Bearish Rejection (Red Path)**
**Conditions:**
* Price gets rejected from the resistance zone (\$3,360–\$3,390).
* Fails to establish support above the breakout level and drops back below \$3,330.
**Target:**
* Immediate support at \$3,310–\$3,290
* Deeper correction towards \$3,260–\$3,220 if bearish pressure increases.
**Confirmation:**
* Look for bearish candlestick patterns near resistance (e.g., shooting star, bearish engulfing).
* Drop below EMA cluster (\$3,324–\$3,331) to confirm weakness.
**Conclusion:**
Gold is at a decision point near major resistance. A breakout above \$3,390 could extend the bullish rally, while failure to break this level may invite sellers and trigger a correction. Watch price action around this resistance for confirmation of the next move.

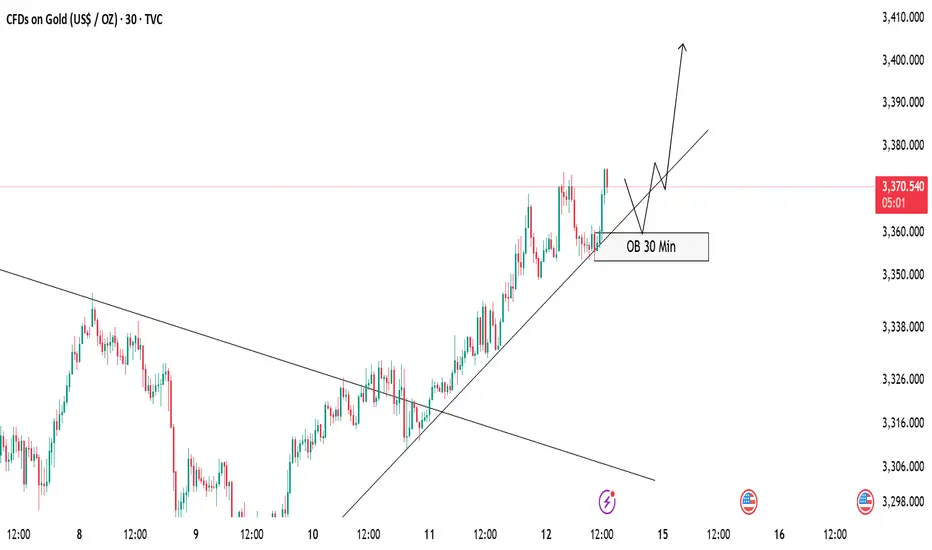
GOLD Buy Setup – OB Zone in FocusCurrently, gold is respecting the ascending trendline and maintaining a bullish structure 🟢. Price hasn’t tapped into the 30 Min Order Block (OB) yet, but we are expecting a potential pullback into this OB zone 📍.
✅ Our Plan:
We will wait patiently for price to mitigate the OB.
After the tap, we will look for bullish confirmation (rejection wick, bullish engulfing, or break of minor structure) before entering a buy position 🚀.
As long as the trendline holds, we remain bullish on gold.
📝 Invalidation:
If price breaks and closes below the trendline and OB zone, we will stay out or re-evaluate the setup ❌.
Stay disciplined and follow the plan! 💪
GOLD LONG TERMGold made a good push from 3250 and back up over 1000 pips.
Additionally, a break above 3340 failed, making a lower low below, opening up opportunity for further drops.
Also a perfect equal lows at 3250. Let's see if price sets up retracement sells from 3360-70 zone.
#XAUUSD Buy 3342.06#XAUUSD Buy 3342.06
Stoploss 3333.06
Breakeven 3343.06
TakeProfit 1: 3352.06
TakeProfit 2: 3362.06
TakeProfit 3: 3372.06
TakeProfit 4: 3382.06
TakeProfit 5: 3392.06
Trade at your own risk
Protect your capital
The Wizard 🧙♂️ FDT
Fri 18 Jul ‘25 08:00 AM NGN

Stronger U.S. Data Pressures Gold PricesGold remained below $3,340 per ounce on Friday and was on track for its first weekly decline in three weeks. The metal faced pressure after stronger U.S. data, including a rebound in retail sales and a sharp drop in jobless claims, reduced the immediate need for Federal Reserve rate cuts. Fed Governor Adriana Kugler backed keeping rates steady for now, pointing to economic resilience, while San Francisco Fed President Mary Daly maintained her outlook for two cuts in 2025.
Resistance is at $3,370, while support holds at $3,320.
XAUUSD critical area, both sides are possiblecorrection waves are always complicated and messy often changes direction too often, goes up and down in a wide range either triangle, wedge or some sort of zigzag, internal waves usually goes as abc, wxy, wxyxz type of correction waves and it may seem like ended many times in the subwaves. so often confused with many other ideas. i believe correction continues yet criticals levles to watch 3307-3419 brake side will determen the future of gold.
my 3250 target already achieved but i expect another one, shor term targets 3250-3205 mid term targets 3119-3070-3050
daily candle body above 3420 invalidates short ideas.

Gold Builds Up to 3370’s — Bullish Stance ReclaimedGold market price builds up to the 3370’s, reclaiming its bullish stance after a successful mitigation at 3340’s. This move signals a likely continuation of bullish momentum, with further upside projections in play. follow for more insights , comment , and boost idea

Gold Trap at 3,377 | XAUMO Thursday Setup💥🔥 Let’s Crush the Market – Updated Zones for Thursday & Friday, July 17–18, 2025
Based on the latest explosive move to 3,377.25 followed by a sharp rejection.
🔥 Current Market Status – XAUUSD
Gold made a violent breakout to the upside, reaching 3,377.25 and triggering a massive wave of stop orders above.
Then it snapped back quickly, confirming this was likely a distribution trap, not a clean breakout.
⸻
🎯 Updated Zones Based on Price Action & Volume Profile
⸻
🟢 Support / Demand Zones (Buy Zones)
Zone Reason
3,334.00 – 3,330.00 POC + clear buyer defense + strong rejection in volume
3,324.70 – 3,319.69 Strong demand + last visible accumulation wick
3,313.00 – 3,308.00 VAL + base of a long trap zone
3,288.87 – 3,282.58 Classic stop hunt zone – last defense before trend reversal
⸻
🔴 Resistance / Distribution Zones (Sell Zones)
Zone Reason
3,360.90 – 3,365.99 Initial supply zone after breakout – partial distribution occurred
3,372.36 – 3,377.25 Fake top / clear sell-side stop hunt – do not buy here
3,386.01 – 3,400.84 Expansion targets – only valid if price confirms breakout above 3,377
⸻
📉 Base Trading Plan for Thursday & Friday:
⸻
✳️ Scenario 1: Failed Breakout (Bearish Reversal)
• 🔻 If price remains below 3,355 – 3,350
• ✳️ Bearish targets: 3,334 > 3,319 > 3,308
• 📌 Confirmation = H1 candles close below 3,334 with negative delta
⸻
✅ Scenario 2: Breakout Confirmation (Not a Trap)
• ✅ Need 4H candle close above 3,377.25
• 📈 Bullish targets: 3,386 > 3,400 > 3,408
• ✳️ Must have: Positive delta + rising volume on each new high
⸻
📍 Expected Stop Hunt Zones
Direction Trap Level Notes
🔻 Downside 3,319.00 – 3,313.00 Fast wicks without volume = Buy trap zone
🔺 Upside 3,377.25 – 3,386.00 Breakout without strong candles = distribution, not real breakout
⸻
💎 “Scalper’s Gold” Trade for Thursday
✅ Buy Setup
• Entry: 3,330.12
• Stop Loss: 3,319.00
• TP1: 3,350.00
• TP2: 3,365.00
• Confidence: 🔥 85%
⸻
❌ Sell Setup (If Price Reverses Above)
• Entry: 3,377.00
• Stop Loss: 3,384.00
• TP1: 3,355.00
• TP2: 3,334.00
• Confidence: 🧠 65%
⸻
“If you’re buying after the breakout, you’re buying from those who loaded up at the bottom and are selling to you at the top…
Be the one accumulating, not the one getting dumped on.”

7/15: Watch for Long Opportunities Around 3343 / 3332–3326Good morning, everyone!
Yesterday, gold rose into the resistance zone before pulling back, testing support around 3343. After today’s open, the price continues to consolidate near this support level.
On the 30-minute chart, there is a visible need for a technical rebound, while the 2-hour chart suggests that the broader downward movement may not be fully completed. The MA60 support area remains a key level to watch.
If support holds firm, the price may form a double bottom or a multi-bottom structure, potentially leading to a stronger rebound.
As such, the primary trading strategy for today is to look for long opportunities on pullbacks, with key levels as follows:
🔽 Support: 3343, and 3332–3326 zone
🔼 Resistance: 3352–3358, followed by the 3372–3378 upper resistance band

Gold Likely to Extend Gains as USD Weakens, but Faces Resistance📊 Market Move:
Gold surged to a three-week high near $3,370/oz, driven by safe-haven demand amid renewed trade tensions between the U.S. and EU/Mexico and threats of a 100% tariff on Russian imports.
Investors are now focused on upcoming U.S. CPI data, which could trigger sharp moves if inflation comes in below expectations.
📉 Technical Analysis:
• Key Resistance: ~$3,365–$3,372; a breakout could open the way to $3,400–$3,440
• Nearest Support: ~$3,340 (S1), then ~$3,326 (SMA50), and deeper at $3,300–$3,320 (Fibonacci zone)
• EMA: Price remains above short-term EMAs (20/50/100), suggesting a continuing bullish bias
• Candlesticks / Volume / Momentum:
• RSI is neutral-to-bullish around 54; MACD shows strengthening bullish momentum
• Bollinger Bands are narrowing, signaling potential for a breakout
📌 Outlook:
Gold may continue edging higher or consolidate around the $3,365–$3,372 resistance zone if no new geopolitical shocks occur. However, if U.S. CPI comes in below expectations or if USD/Yields weaken, gold could rally further toward $3,400–$3,440.
________________________________________
💡 Suggested Trading Strategy
🔻 SELL XAU/USD at: $3,370–3,373
🎯 TP: 40/80/200 pips
❌ SL: $3,376
🔺 BUY XAU/USD at: $3,340–3,337
🎯 TP: 40/80/200 pips
❌ SL: $3,334
GoldWe have a strong bullish move and again we are moving on a bullish flag,price had just retested previous resistance turned into support so now I'm expecting buys till previous HOD

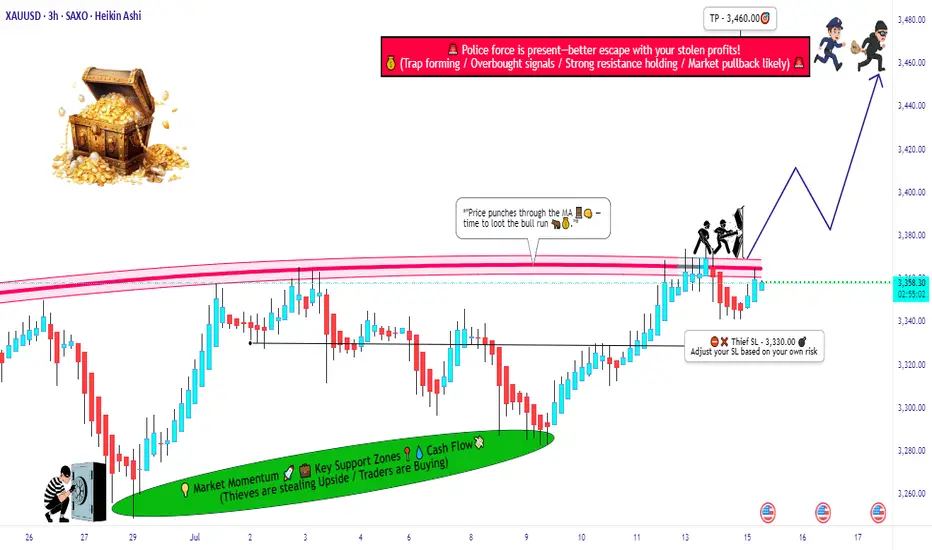
GOLD (XAU/USD) MA Breakout – High-Probability Long Setup!💰🚨 GOLD HEIST ALERT! XAU/USD MASTER PLAN (Thief Trading Style) 🎯
🔥 Steal Pips Like a Pro – High-Probability Gold Breakout Strategy! 🔥
🎯 Thief Trading’s GOLD Heist Strategy (Swing/Day Trade) �💸
👋 Hey there, Market Pirates & Profit Snatchers! 🌍✨
Based on our 🔥Thief Trading Style🔥 analysis, we’re plotting a major heist on XAU/USD (GOLD). The plan? Buy the breakout, escape before the cops (resistance) arrive! 🚔💨
📈 ENTRY ZONE: The Heist Begins!
🚀 "Wait for the MA Breakout (3400) – Then Strike!"
Bullish Confirmation: Enter on a 15M/30M pullback after MA breakout.
Thief’s Trick: Use Buy Stop above MA or Buy Limit near swing lows for best risk-reward.
DCA/Layering Strategy: Deploy multiple limit orders to maximize gains.
🔔 Set an ALERT! Don’t miss the breakout – thieves move fast! ⏳
🛑 STOP LOSS: Protect Your Loot!
📍 Thief’s SL Placement: 3330.00 (4H Swing Low) – Adjust based on your risk & lot size.
⚠️ WARNING: If using Buy Stop, DO NOT set SL until after breakout – unless you love unnecessary losses! 🔥
🎯 TARGET: Escape with the Gold!
🏴☠️ Take Profit Zone: 3460.00 (or Exit Early if Bears Show Up!)
Scalpers: Only trade LONG side – use trailing SL to lock in profits.
Swing Traders: Ride the wave but watch for resistance traps!
📰 MARKET CONTEXT: Why This Heist?
Neutral Trend (But Bullish Potential! 🐂)
Key Factors: Geopolitics, COT Data, Macro Trends, Sentiment Shift
🚨 News Alert: Avoid new trades during high-impact news – trailing SL saves profits!
💥 BOOST THIS HEIST! (Like & Share for More Pips!)
💖 Hit the 👍 Boost Button to strengthen our Thief Trading Crew!
🚀 More Heist Plans Coming Soon – Stay Tuned!
⚠️ DISCLAIMER (Stay Safe, Thieves!)
This is NOT financial advice. Do your own analysis & manage risk.
Markets change fast! Adapt or get caught.
🎯 Happy Trading, Pirates! Let’s Steal Some Gold! 🏴☠️💛