Gold rises continuously and then moves unilaterally? 3375 is the
At the beginning of this week, international gold prices rose, benefiting from the weaker dollar, while investors paid attention to news on trade progress before the US tariff deadline on August 1. As US inflation data was lower than expected and the market may have some defensive bets against tariffs, gold finally rebounded from the main upward trend line again. The lower-than-expected US inflation data did not trigger the market to re-price more hawkish rate hike expectations.
From a larger perspective, as the Fed's easing policy progresses, real yields may continue to fall, and gold should maintain an upward trend.
Views on today's trend!
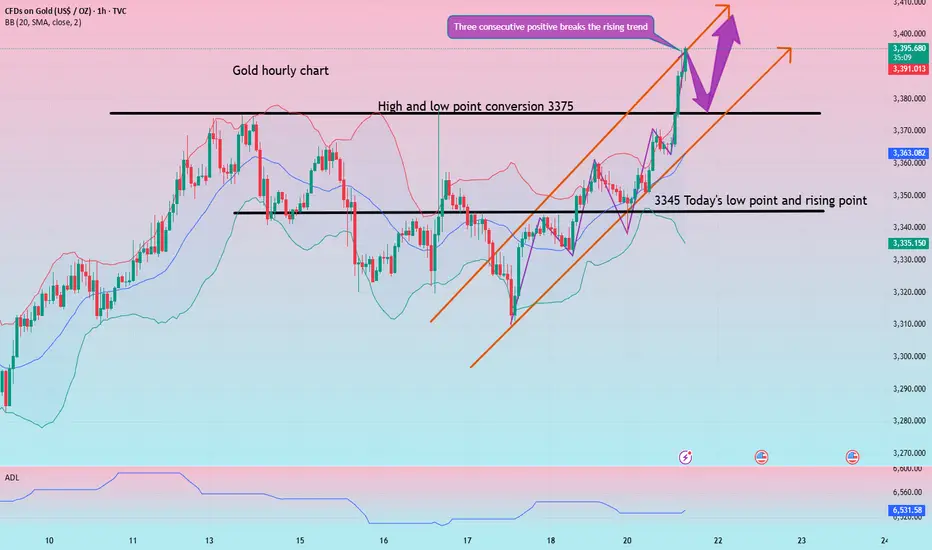
Today, gold is rising slowly, and basically there is no chance of a correction, so it also led to our opening directly chasing a wave of gains, and the market has actually had some risks after the rebound to above 3370. After all, the 3373-75 line was a dense pressure area before.
From the current hourly chart, gold has been moving along the upper track of the moving average and has accelerated since breaking through the 3375 line. It is possible that it will test the 3410 line today. After all, it is already at the 3395 line, and today's strength and weakness watershed has actually shifted from 3340 to 3375. After all, the top and bottom conversions are raised synchronously!
Gold: Long around 3375, defend 3365, and target 3395-3405!
XAUUSD trade ideas

XAUUSD clean to dropXAUSD CLEAN TO DROP for the next 3 weeks
I will bee waiting for this set up and now all that we need is patience


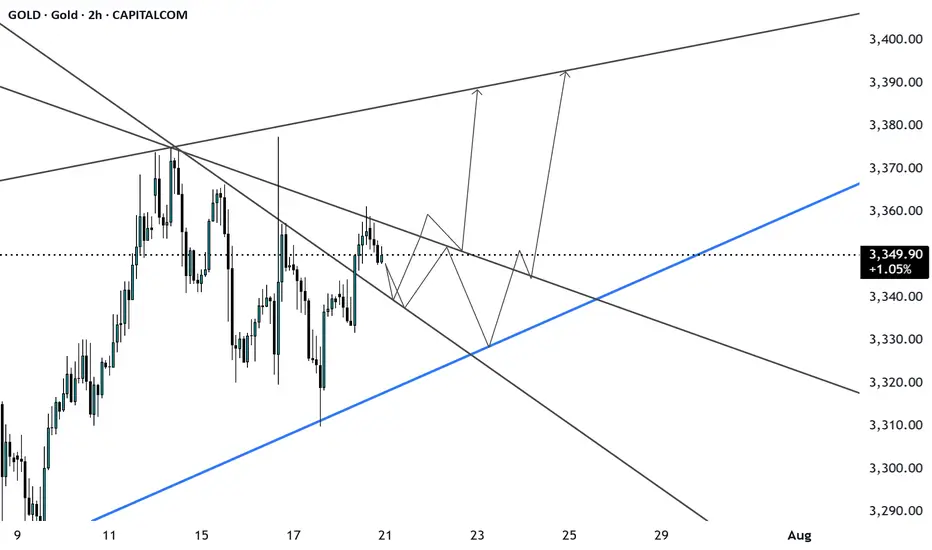
Gold is weak. Beware of lows.On Thursday, the dollar index ended a four-day losing streak thanks to the progress of the fund between the United States and its trading partners.
As signs of easing global trade tensions curbed demand for safe-haven assets, gold fell for the second consecutive trading day, and yesterday it hit the 3350 bottom support level.
From the 4-hour chart
although it rebounded to the 3370-3380 range after hitting 3350. But it can be found that the current rebound is actually weak, and it is still maintained at 3360-70 for rectification. At present, the bottom of the 4-hour bottom is absolutely supported at 3340-3335. The rebound high is around 3375. As of now, gold has not rebounded above 3375, and gold is actually in a weak position.
Secondly, from the hourly chart, the weakness is even more obvious. The high point on Thursday was around 3395. Today's current high point is around 3375. It can be seen that if the bottom falls below the 618 position 3350 again, it will directly touch around 3335. It coincides with the target position of 3340-3335 in the previous 4-hour chart.
Therefore, it is not possible to buy the bottom and go long today. Be alert to the possibility of further touching 3340-3335.
Gold forming triangle patterenGold is currently consolidating within a symmetrical triangle pattern, signaling a potential breakout setup as price coils tighter between converging support and resistance trendlines.
CMP: Around $ 3370 (adjust based on your exact chart)
Lower highs & higher lows = compression zone
Volume declining, typical before breakout
Break above upper trendline could signal continuation toward 4000
Break support may lead to retest of $2985
This setup reflects indecision in the market — waiting for a decisive breakout with volume to confirm direction.

XAUUSD INTRADAY BUY OPPORTUNITY A buy opportunity is envisaged from the current market price as price rebounds around 3344.78 we’re looking forward to seeing buyers take price back to resistant level of $3,418.04 Take advantage of this opportunity.

Expecting Gold bullish Movement Gold (XAU/USD) has exhibited a strong bullish reversal from the key support zone near 3325 marked by the red area on the chart The price formed a series of higher lows indicating bullish momentum buildup before breaking out sharply above the descending channel and resistance zone around 3340
Following this breakout, the market is now consolidating above the broken resistance, which is acting as new support signaling a potential continuation of the upward trend
Key Levels
Target 1 3365 3370 grey resistance zone
Target 2 3385 3390 major resistance zone
If price holds above the support at 3340 and continues forming higher lows, we expect bullish continuation toward Target 1 and eventually Target 2 if momentum sustains Traders should monitor price action closely at each target zone for potential reactions or reversals

xauussWe will probably have a minor correction in this direction. We will wait for the trend line to break, if it breaks, the targets will be touched in order.


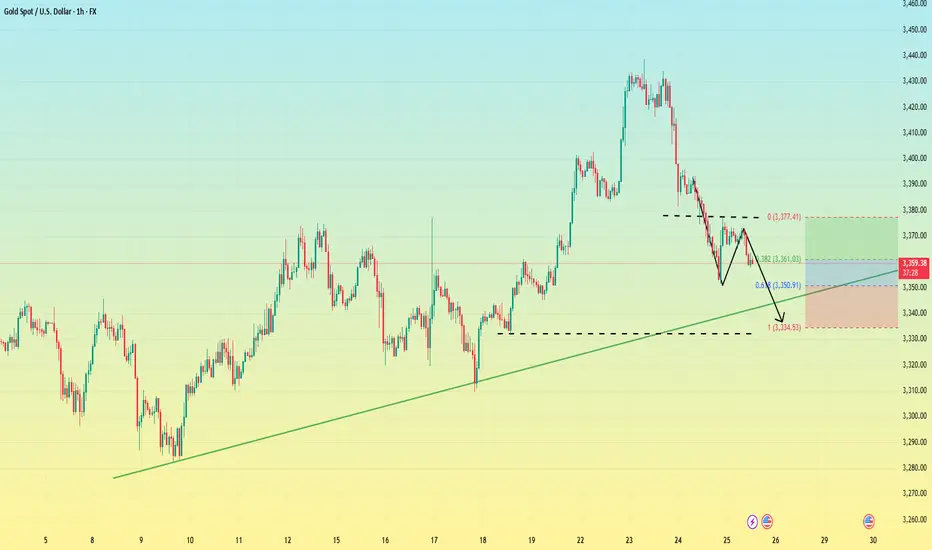
Gold Weekly Summary and Forecast 7/19/2025Gold has been very choppy these two weeks. As the 2W closes, the falling line indicated in the 2W chart still interacts. As long as this line is not broken, gold could retrace further.
In weekly chart on the right, we are seeing a head and shoulder pattern has been formed. And the rejection level is aligning with 61.8% Fibo level retracement.
From the above two analysis, I am expecting gold to drop heavily next week to at least 3250 or even 3192.
Let's enjoy the weekend and I will come back with intraday analysis every day next week.

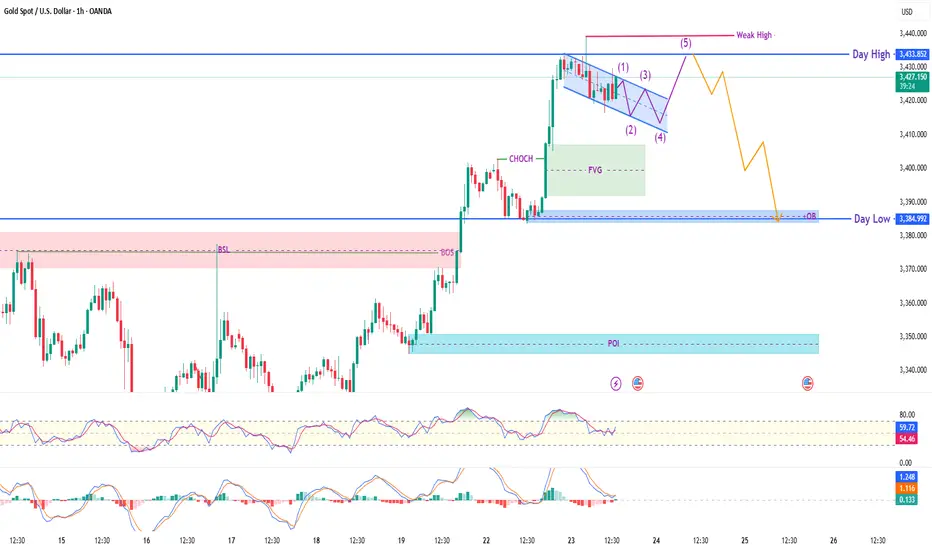
XAU/USD (Gold) – Smart Money Reversal Setup | 1H Breakdown🔹 Current Price: $3,423.98
🔹 Session Range: Day High $3,433.85 | Day Low $3,384.99
🔍 Smart Money Narrative:
Clean bullish impulse followed by CHoCH + Fair Value Gap (FVG) creation
Price forming Ending Diagonal / Rising Wedge (5-wave structure) into weak high
Expecting liquidity sweep above the weak high followed by bearish reversal
📐 Key Technical Highlights:
🟣 CHoCH confirms potential reversal
🟩 FVG + OB Zone acting as mitigation base
🔻 Day Low + 1H OB marked as key bearish target
🔺 Day High = weak liquidity likely to be swept before drop
📈 Trade Idea (Bearish Plan):
Let price complete wave (5) and sweep the weak high
Look for confirmation (MSS, FVG, lower TF BOS)
Short entry target: OB near $3,385 (Day Low zone)
Optional swing target = $3,360–3,345 POI zone
⚠️ Risk Note:
This is a smart money concept-based idea focused on liquidity, CHoCH, and mitigation logic. Use lower timeframe confirmations before entry. Manage risk wisely.
#XAUUSD #SmartMoney #ICT #LiquiditySweep #CHoCH #FVG #MarketStructure #ForexGold #ReversalSetup
Gold Potential UpsidesHey Traders, in today's trading session we are monitoring XAUUSD for a buying opportunity around 3,336 zone, Gold is trading in an uptrend and currently is in a correction phase in which it is approaching the trend at 3,336 support and resistance area.
Trade safe, Joe.

GOLD tests $3,310 then recovers, continues sidewaysInternational OANDA:XAUUSD fell to the support level of 3,310 USD, then recovered and continued to stabilize sideways due to the stronger US Dollar and market tensions eased after US President Trump said it was "extremely unlikely" to fire Federal Reserve Chairman Powell.
As of the time of writing, spot OANDA:XAUUSD was trading at 3,339 USD/oz.
Reuters reported on Wednesday that Trump is still open to the possibility of firing Powell. However, Trump said on Wednesday that he has no intention of firing Powell at this time, but did not completely rule out the possibility and reiterated his criticism of the Fed chairman for not lowering interest rates.
Data showed US producer prices unexpectedly held steady in June, as the impact of higher import tariffs on goods was offset by weakness in the services sector.
The unchanged US PPI in June showed wholesale prices were stabilising, suggesting the economic impact of tariffs may be smaller than initially feared.
The lower-than-expected core CPI and core PPI data did not provide the boost that was expected, which could mean that the market is focusing on other aspects. More broadly, as the Fed gradually eases policy, real yields could continue to fall, and gold will maintain its upward trend. However, if the market continues to reprice expectations for a hawkish rate cut, this could trigger a short-term correction.
SPDR Gold Trust, the world's largest gold-backed exchange-traded fund (ETF), said its holdings rose 0.33% to 950.79 tonnes on Wednesday from 947.64 tonnes in the previous session.
Technical Outlook Analysis OANDA:XAUUSD
On the daily chart, gold rebounded after falling and tested the support level noted by readers in yesterday's edition at 3,310 USD. The recovery brought gold prices back to work around the EMA21, continuing the sideways accumulation trend.
Structurally there is no change, as for gold to qualify for an upside move it needs to break resistance at the 0.236% Fibonacci retracement level then the short term target is the raw price point of $3,400. Meanwhile for gold to complete its bearish cycle it needs to sell below the 0.382% Fibonacci retracement level then the short term target would be around $3,246, more than the 0.50% Fibonacci retracement level.
The relative strength index (RSI) is also unchanged with the RSI activity around 50, indicating a hesitant market sentiment without leaning towards any particular trend.
Intraday, the technical outlook for gold prices continues to be a sideways accumulation trend, and the notable positions will be listed as follows.
Support: 3,310 – 3,300 – 3,292 USD
Resistance: 3,350 – 3,371 USD
SELL XAUUSD PRICE 3386 - 3384⚡️
↠↠ Stop Loss 3390
→Take Profit 1 3378
↨
→Take Profit 2 3372
BUY XAUUSD PRICE 3276 - 3278⚡️
↠↠ Stop Loss 3272
→Take Profit 1 3284
↨
→Take Profit 2 3290

Gold Possible ScenarioGold is trading in a channel pattern now and may take support at 3340-3330 and rebound again to reach the target of 3390.the possible price movements are indicated here.
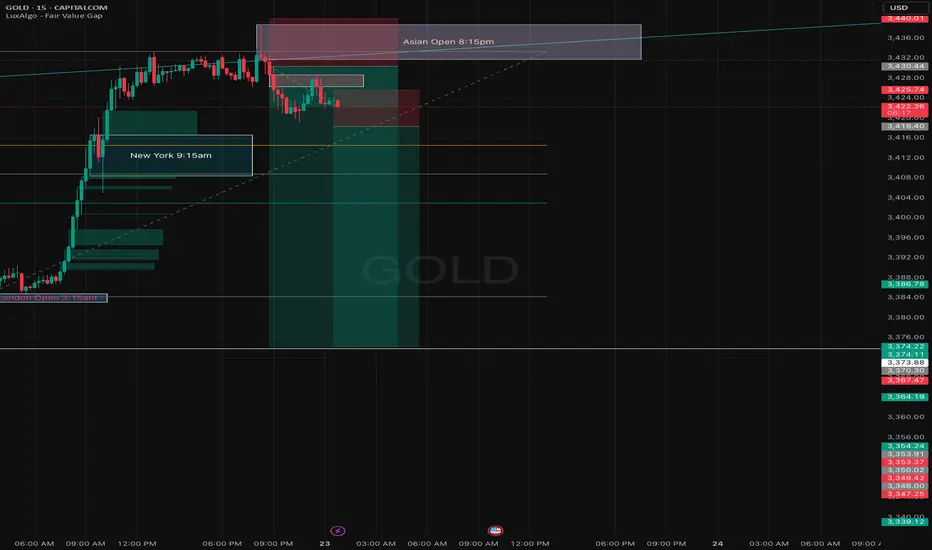
GOLD 4H CHART ROUTE MAP UPDATEHey Everyone,
Great start to the week with our chart idea playing out as analysed.
We started the week with our Bullish target 3364 HIT, followed with no ema5 lock confirming the rejection. Bearish target remains open and may complete with the rejection.
We will continue with our plans to buy dips, utilising the support levels from the bearish targets and/or Goldturns. Also keeping in mind our 1h chart, although gave a nice push up , the full Bullish gap remains open.
We will keep the above in mind when taking buys from dips. Our updated levels and weighted levels will allow us to track the movement down and then catch bounces up.
We will continue to buy dips using our support levels taking 20 to 40 pips. As stated before each of our level structures give 20 to 40 pip bounces, which is enough for a nice entry and exit. If you back test the levels we shared every week for the past 24 months, you can see how effectively they were used to trade with or against short/mid term swings and trends.
The swing range give bigger bounces then our weighted levels that's the difference between weighted levels and swing ranges.
BULLISH TARGET
3364 - DONE
EMA5 CROSS AND LOCK ABOVE 3364 WILL OPEN THE FOLLOWING BULLISH TARGETS
3429
EMA5 CROSS AND LOCK ABOVE 3429 WILL OPEN THE FOLLOWING BULLISH TARGET
3499
EMA5 CROSS AND LOCK ABOVE 3499 WILL OPEN THE FOLLOWING BULLISH TARGET
3561
BEARISH TARGETS
3297
EMA5 CROSS AND LOCK BELOW 3297 WILL OPEN THE SWING RANGE
3242
3171
EMA5 CROSS AND LOCK BELOW 3171 WILL OPEN THE SECONDARY SWING RANGE
3089
3001
As always, we will keep you all updated with regular updates throughout the week and how we manage the active ideas and setups. Thank you all for your likes, comments and follows, we really appreciate it!
Mr Gold
GoldViewFX

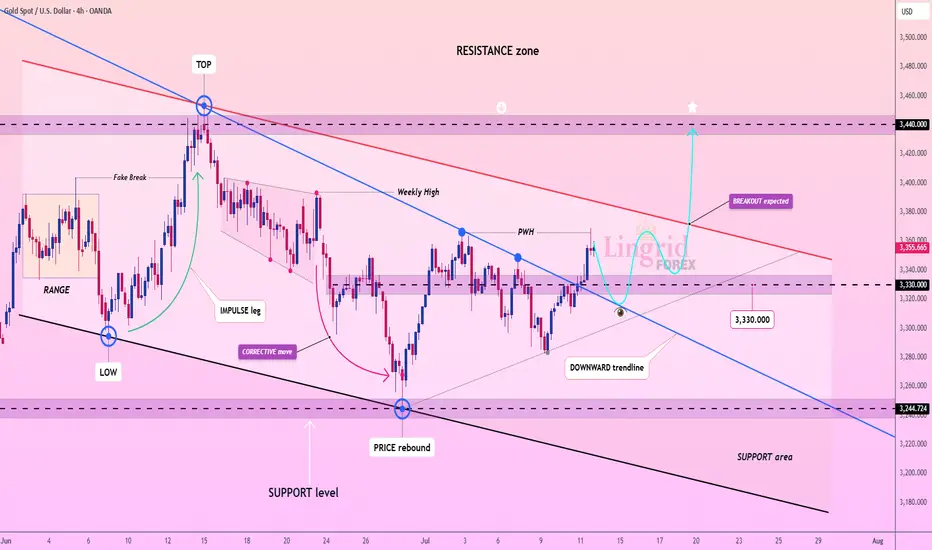
Lingrid | GOLD Weekly Market AnalysisOANDA:XAUUSD markets are navigating through a technical consolidation phase following the recent rally, maintaining underlying bullish momentum despite current volatility. The precious metal is trading between critical levels that will determine the next major directional move.
4H chart reveals a complex structure with a retest of the resistance zone around $3,440, gold has initiated a corrective move along the descending channel. The current setup suggests a healthy pullback toward the support zone near $3,330. Breaking above the downward trendline will constitute an important technical signal for bullish continuation.
The higher timeframe provides a broader perspective with an A-B pattern currently forming. Equal tests at resistance levels indicate significant institutional accumulation. The rising trendline (HL) continues to support prices, confirming the long-term bullish structure. The target zone above $3,600 remains viable if gold can successfully break through the current resistance cluster.
Key levels to monitor include the $3,330 support and $3,440 resistance. A decisive break above previous week high could trigger the next leg toward $3,400-$3,450, while failure to hold support might see a deeper correction toward $3,250. The overall technical picture suggests this consolidation represents a continuation pattern within the broader uptrend. If this idea resonates with you or you have your own opinion, traders, hit the comments. I’m excited to read your thoughts!
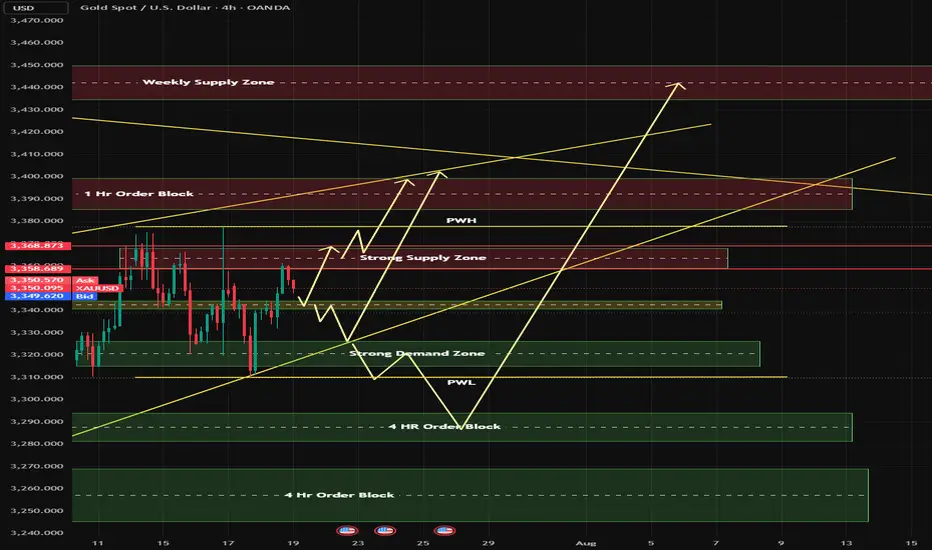
Gold - Week of 21st JulyWelcome to a new trading week. Price is compressing within a premium structure, boxed between clean supply and demand zones. While the overall trend remains bullish, momentum is clearly fading — so structure takes priority this week.
🟨 Weekly Bias: Neutral | Range-Bound Conditions
There’s no clear directional conviction on the weekly timeframe — we’re in a consolidation phase.
📊 Technical Overview & Strategy
We’re currently range-locked between:
Main Supply: 3380–3405
Main Demand: 3275–3250
Until either breaks decisively, we treat this as a two-sided market.
🔹 Weekly Key Zones
🔸 3365–3390 (Primary Supply)
Why it matters: Price was rejected cleanly from a previous weekly high (3377), aligning with a fresh Order Block (OB) and Fair Value Gap (FVG) from June.
Context: No bullish Break of Structure (BOS) above 3375. Repeated wick rejections indicate strong supply.
Game plan: If price returns, monitor M15–H1 for reaction. Consider shorts only if there's no BOS above 3390.
🔸 3430–3450 (Final Supply Barrier)
Why it matters: Unmitigated OB from a macro swing high — the final ceiling before bullish continuation.
Context: A clean BOS through this zone flips the larger structure bullish again.
🔸 3285–3260 (Key Demand Base)
Why it matters: Last untouched bullish OB + FVG combo from early July.
Context: No downside BOS yet. If price pulls back sharply, this zone offers a potential clean long from discount.
🔹 HTF Structure Summary
Trend: Still bullish (no BOS down), but compression under key resistance
Structure Range: 3390–3260
EMA Flow: Bullish, but extended — watch for pullbacks
RSI: Bearish divergence above 3350 — potential retracement brewing
🕯️ Daily Zones
🔸 Supply Zones
3380–3405 – Main Daily Supply / Liquidity Pool
Top of current range. Multiple upper wicks = rejection zone. Unless we get a daily close above 3405, this remains a trap for breakout buyers.
3355–3375 – Internal Supply / Inducement Block
Acted as a consistent ceiling post-CPI. Often triggers fake breakouts and quick reversals — ideal for fading strength.
🟢 Demand Zones
3312–3300 – Mid-Range Internal Demand
Reactive level post-CPI and NY session. Often used for stop hunts and intraday bounces.
3275–3250 – Main Daily Demand
Held firm as support all month. Every dip here has resulted in strong rallies. A daily break below flips the HTF bearish.
⏱ H1 Execution Map
🚩 SELL ZONES
3358–3370 – Primary Intraday Supply
Site of last week’s failed breakout. If price taps this and shows M15/M5 bearish momentum — it’s a sniper entry short.
3380–3395 – Upper Liquidity Trap
Classic fakeout zone. If breakout fails with a sharp reversal, it’s prime territory for “fade and dump” trades.
⚪ DECISION ZONE (Neutral / Pivot)
3335–3345:
A choppy, indecisive area. No clear OB or FVG. Avoid trading here — only observe and wait for clean setups on the edges.
🟢 BUY ZONES
3326–3332 – Primary Intraday Demand
Strong evidence of absorption + sharp reversals. Look for clean M15/M5 snapbacks — a reactive long setup.
3311–3320 – Deep Demand / Fear Zone
Sits below recent lows — ripe for liquidity sweeps. Only consider longs if a strong impulsive bounce follows. High risk, high reward.
Disclaimer: For educational context only.
Weekly Analysis on GOLDFor next week trading session i will wait for buy set up since market structure is still in a bullish trend. There might be a selling opportunity but still i will wait for a great buy set up.

XAU/USD (1H) – Smart Money Bearish SetupPrice is currently breaking below the Breaker Block and showing rejection from the FVG zone, confirming bearish strength. Market structure has shifted after BOS, with momentum favoring a move toward the POI demand zone.
🔍 Key Observations:
🔻 Breaker Block + FVG rejection confirms supply pressure.
🔵 Bearish Bias active below $3,382.50
🎯 Targeting POI zone: $3,345–$3,355
RSI & MACD indicators confirm bearish momentum.
🚩 Market Structure Flow:
BOS confirmed → Breaker Block retest → Continuation
Day High ($3,438) protected by strong BSL
Lower highs and FVG break confirm institutional selloff.
📚 Bias: Strong Bearish
🧠 Confluence: SMC + Breaker Block + Fair Value Gap + Liquidity Sweep
⚠️ Note: Wait for clean POI reaction before considering countertrend plays.

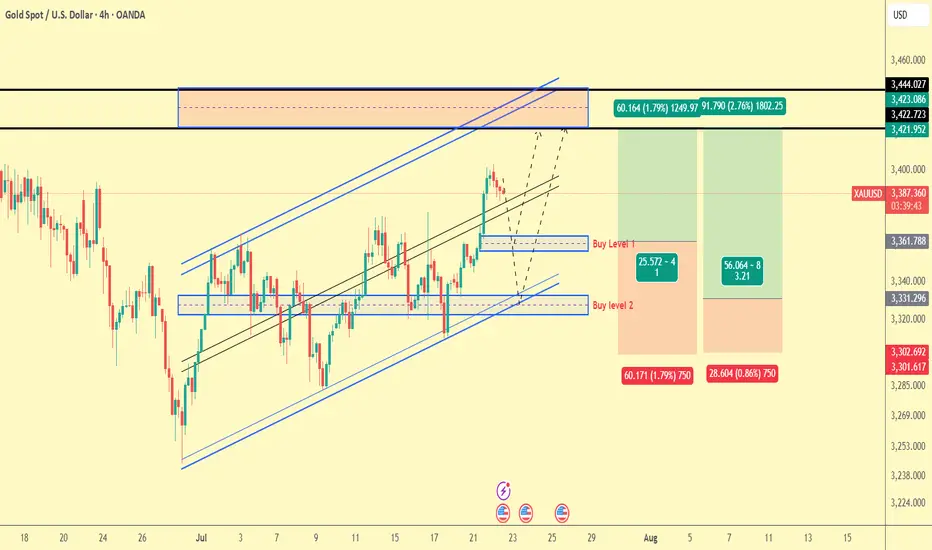
Gold Trade plan 22/07/2025Dear Traders,
The price is currently moving towards the upper boundary of the channel. The areas where it could potentially rise again are the 3360 zone and the 3320 zone, which is the lower boundary of the upward channel. The first area I have in mind is the 3360 zone, and the second area, 3325-3330, which is more attractive for buying. In the first area, there is a high likelihood that the price will react, but the risk-to-reward ratio is better in the second area.
Regards,
Alireza!
GOLD LONG LONGGold has broken the daily symmetric triangle. If we can get an FVG on daily chart today, tomorrow can give us a great chance, catching this big move on pullback. Look for inverse FVGs on m5 in this gap, if made.
Target: 3900
