Gold (XAU/USD)Gold (XAU/USD) — price rejected resistance zone (~3380), potential move towards 3223 support.
#XAU
XAUUSD trade ideas

Gold (XAU/USD) Technical Analysis:Gold began a corrective move with today’s market open and is currently testing the $3,350 support zone, with further downside potential toward $3,310.
🔹 Bearish Scenario:
If the price breaks below $3,350 and holds, a continued correction toward $3,310 is likely.
🔹 Bullish Scenario:
If the price breaks above $3,365 and sustains momentum, it could open the way toward $3,390, and with further bullish pressure, extend to $3,430.
⚠️ Disclaimer:
This analysis is not financial advice. It is recommended to monitor the markets and carefully analyze the data before making any investment decisions.

XAU / USD 4 Hour ChartHello traders. I just figured while I am at the computer to post the 4 hour chart now. We can see that we are coming into an area where we will either reject if support forms, or keep pushing down a bit more. We have ISM news here in the US at 10am est. I will update / post any scalp trade set ups on a lower time frame in a bit. Be well and trade the trend. Shout out to Big G. Happy Tuesday

uptrend for GOLD ?According to the chart, we have an ascending channel and the RSI indicator is also in the ascending channel.
Considering the data on the tension between China and Taiwan and the tariff and oil wars between the United States and China, Russia, India, etc., the possibility of gold growth is not far from imagination.

8/5: Watch for Short Opportunities Near 3400Good morning, everyone!
On Wednesday, gold held above the key support area at 3343–3337, and subsequently broke through the 3372–3378 resistance zone, leading to a strong bullish move and solid long-side gains.
Today, attention should shift to the major resistance around 3400. If bullish momentum continues, price may approach the secondary resistance near 3420. However, from a technical perspective, signs of bearish divergence have begun to emerge. Should price continue rising while momentum weakens, the risk of a short-term correction increases accordingly.
Key levels to monitor:
Primary resistance zone: 3404–3416
Intermediate supply area: around 3398
Crucial support zone: 3372–3363 (a hold here could support further upside)
⚠️ Cautionary Note:
The US PMI data release during the New York session could introduce volatility. Be sure to maintain strict risk management and stop-loss discipline during periods of increased uncertainty.
🔁 Trading Bias for Today:
Prefer selling into strength near resistance, while cautiously considering buying on dips near support.
The 3343–3337 area continues to serve as the primary support zone, and price action around this level will be critical in determining the next directional move

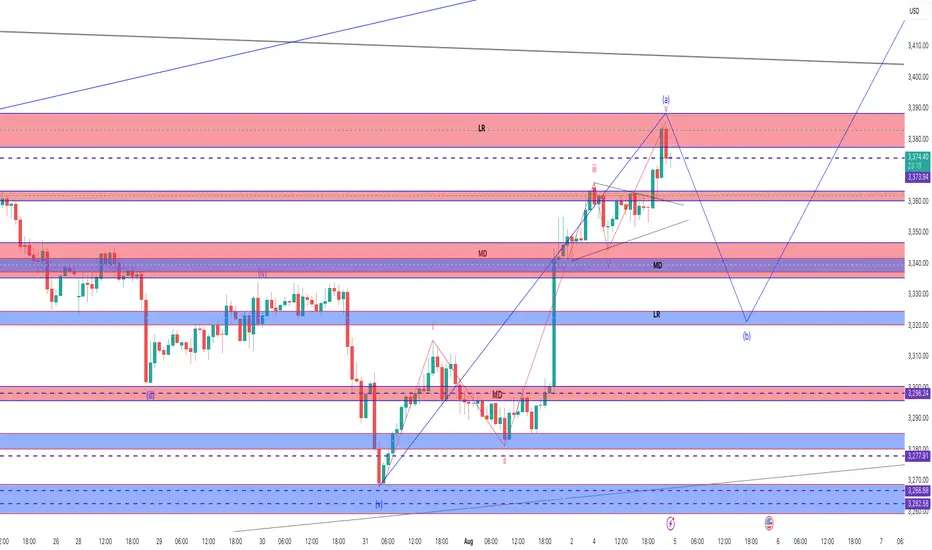
Letting the Pullback Happen – Lining Up for the Next BuyPrice just hit that tough resistance at 3,373–3,380 and started to drop—pretty much what I expected for wave (a) top. Now waiting for a wave (b) pullback. Not chasing here, just being patient.
Game plan:
Waiting for price to drop into the 3,330–3,325 support zone.
If I see a nice bounce or bullish candle in that area, I’ll look to go long.
First target: Back to the 3,373–3,380 resistance. If price smashes through, will hold a small portion for a bigger run.
Stop loss: Just below 3,320 or the latest swing low—keeping it tight.
If price goes lower, next buy zone is 3,298, then 3,278. I’ll repeat the same idea.
If price dumps below 3,262, I’m out. No interest in holding longs if support fails.
XAUUSD Signal Today | Do you think Gold will retest $3400XAUUSD Buy Sell Signal Today | Do you think Gold will retest $3400 resistance? Every gold trader should watch today! In this video, we have the latest XAUUSD technical analysis and provide clear buy and sell levels for scalpers and swing traders. If you want to know if Gold will retest $3400 resistance, stay tuned until the end for exclusive insights, real chart breakdowns, and the best price action strategies. This video will help both new and professional traders make smart trading decisions with live examples and updated gold signals.
#GoldPrice
#XAUUSD
#GoldSignal
#GoldTrading
#TechnicalAnalysis
#GoldForecast
#BuySellSignal
#GoldResistance
#ForexTrading
#livegoldanalysis

Elliott Wave Perspective: Triangle Completion in Sightrom the Elliott Wave viewpoint, the current pattern suggests a potential completion of the triangle formation.
To confirm this scenario, a breakout above the bd trendline is required.


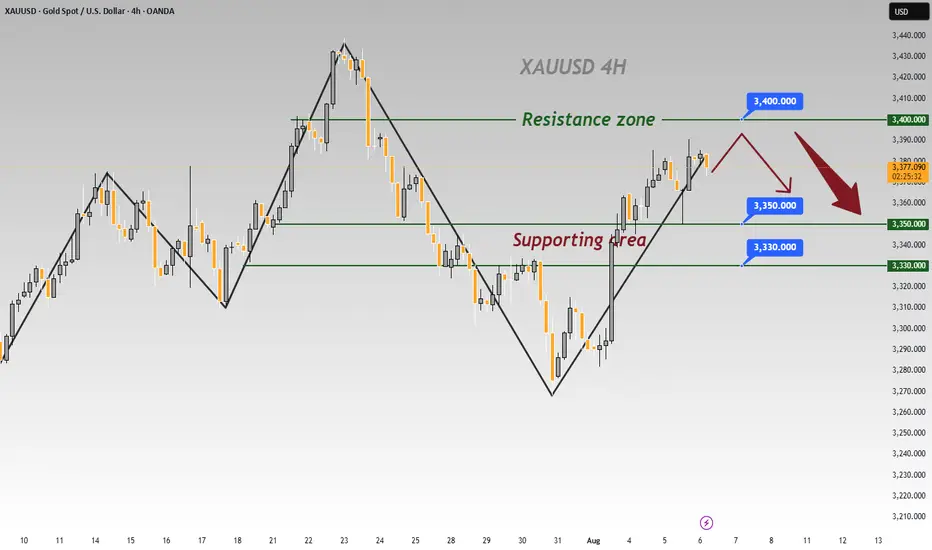
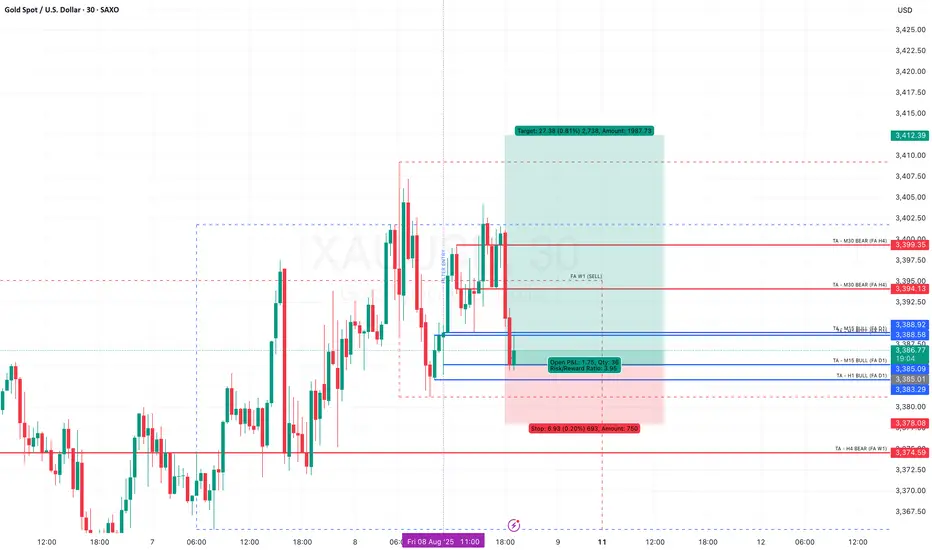
Gold (XAU/USD): Supply Zone Rejection & Bearish Breakdown Chart Breakdown:
Supply zone rejection: Gold revisited the “supply zone” (light green/grey area) and failed to break above — a classic signal of seller dominance.
Uptrend invalidated: A sharp rise (steep black trendline) ended with a peak marked by the green arrow, followed by a decisive breakdown.
Ichimoku Cloud test: Prices slipped through the Ichimoku components, reinforcing the shift to bearish sentiment.
Potential targets: The red/green risk‑reward box highlights a short position, targeting ~3,347 then ~3,318 levels (blue labels) as initial support zones.
Strong supply base: The extensive grey zone below marks a "stronger supply zone" — this could cap any modest bounce and keep the downtrend intact.
🔍 Interpretation:
Bias: Bearish — sellers have taken control after a failed breakout.
Strategy: Short on rallies toward the mid‑green/red box (~3,373–3,380), targeting ~3,347 first and then ~3,319. Watch for support at the strong supply region (~3,292) for potential reversal or consolidation.
Risk management: Keep stop above the red zone—above recent highs (~3,380+) to limit risk.
🚀 In a nutshell: After failing to break supply and losing its short‑term uptrend, gold appears poised for a pullback. The next key levels to watch are ~3,347 and ~3,319—where buyers might step back in, or the downtrend continues toward the deeper supply base.

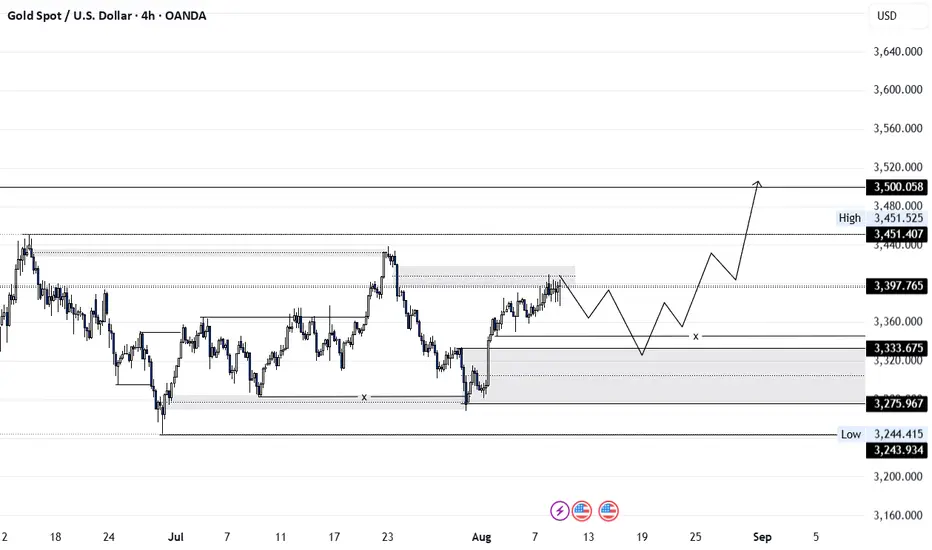
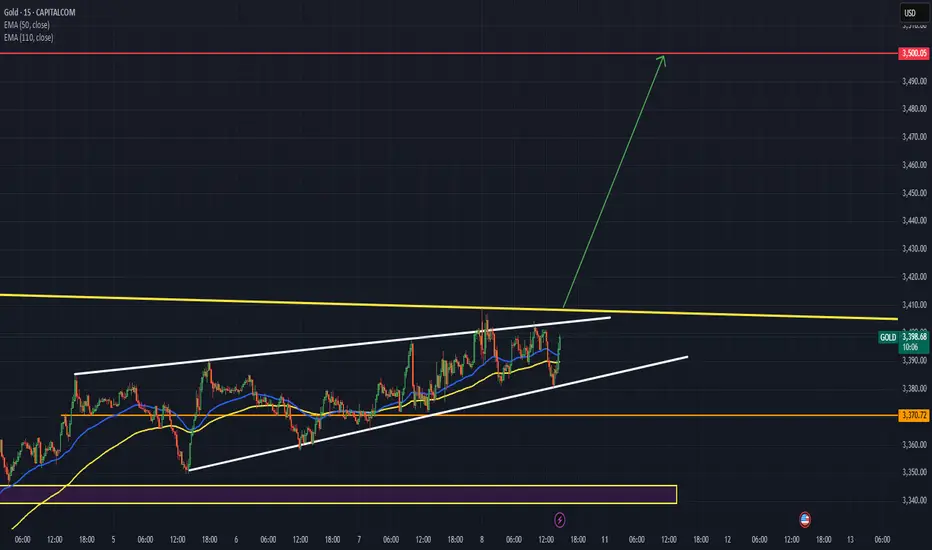
XAUUSD – Sweep the Lows, Target the HighsGold is currently trading near 3,397 after a sustained bullish leg, holding just above an ascending trendline that has acted as a structural support base. Price action indicates the potential for a deliberate liquidity sweep below the trendline, targeting stops positioned under recent higher lows. This corrective leg is expected to extend toward the 3,300–3,325 daily demand zone, an area of prior accumulation that remains unmitigated and aligns with the 61.8–65% Fibonacci retracement of the latest impulse leg.
This demand zone is further reinforced by an H4–Daily imbalance (FVG) and high-volume node on the volume profile, suggesting significant institutional interest. A strong bullish reaction from this level could confirm the continuation of the macro uptrend. Upside objectives remain the prior swing high at 3,451, followed by the 3,500 psychological level — both of which hold notable resting liquidity.
Gold is showing signs of a trendline breakdown to capture liquidity beneath recent lows. A drop into the $3,300–$3,325 daily demand zone — backed by Fibonacci, imbalance fill, and volume profile confluence — could set up the next impulsive rally. Upside targets remain $3,451 and $3,500 once demand is validated.
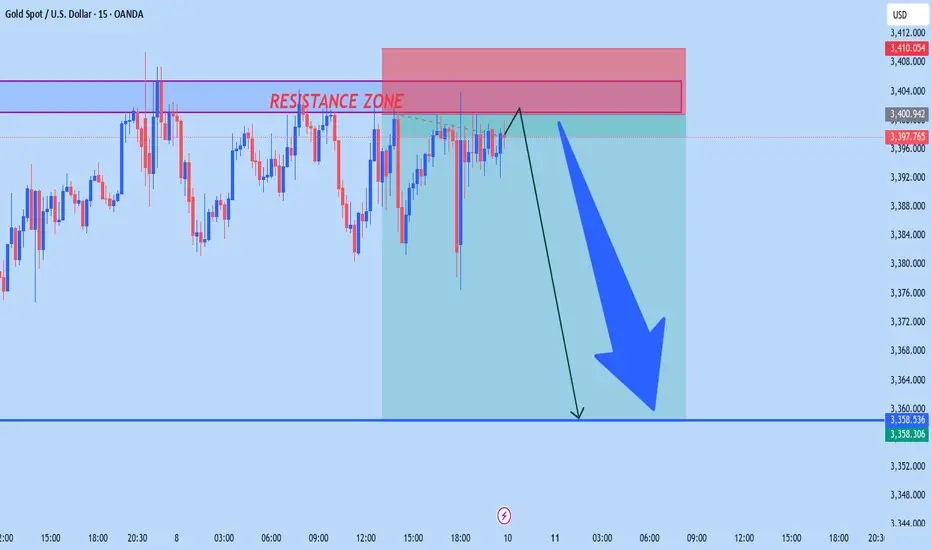
XAUUSD NEW OUTLOOKAccording to M15 analysis gold market is running side wave from 3375 to 3400 now market will be reject from RESISTANCE ZONE be caureful use money management dont be greedy
TRADE AT YOUR OWN RISK
XAUUSD – HTF structure points to higher TPLooking at the higher timeframe structure, this 4H move is aligning perfectly with bullish momentum. Even if we see a pullback, it’s likely just a retest for continuation — not a full reversal.
Key points:
• HTF bias: Bullish, with room beyond local 3,440 resistance
• Pullback zones: 3,377 / 3,361 — both valid re-entry levels if retested
• Targets: First watch 3,508, but HTF suggests we can push higher
• Plan: Stay patient, treat dips into structure as opportunities to stack buys
Bigger picture remains bullish until HTF structure breaks.

Diagonal doradaGold has completed the projection I had for a contracting diagonal. I see a very possible deep correction, the last of the cycle, as I mentioned. I feel this move is very positive for a bullish gold price in the future. We will likely surpass 3400. The gold metal is possibly giving us one last opportunity to buy low and sell high.
The coefficients are converging, the movement is precise, the indicators are screaming. We saw this move two weeks ago; it has developed perfectly, and only time will tell if we were right.
A range from 3340 to 3300 would be the perfect buying zone, unmissable in my personal opinion. We will be attentive to buying.

XAU / USD 30 Min. ChartHello traders. It was a great analysis, but I missed the scalp move up. $3400 is the area to watch for rejection or a continued push up. Let's see how things play out. Happy Friday. Big G gets a shout out. Be well and trade the trend.

I see a Bullish momentum to reach the old time high!Gold confirming bullish momentum. The breakout signals strong buying pressure, with price action targeting the previous all-time high. Sustained volume and favorable macroeconomic conditions are supporting the upward move, indicating potential for further gains if momentum holds.
BULL RUN EXPECTED TO CONTINUEBased on the current trend, bull run is expected continue to at the current support level.
GOLD: Long Trading Opportunity
GOLD
- Classic bullish setup
- Our team expects bullish continuation
SUGGESTED TRADE:
Swing Trade
Long GOLD
Entry Point - 3372.6
Stop Loss - 3367.3
Take Profit - 3383.4
Our Risk - 1%
Start protection of your profits from lower levels
Disclosure: I am part of Trade Nation's Influencer program and receive a monthly fee for using their TradingView charts in my analysis.
❤️ Please, support our work with like & comment! ❤️

XAUUSD: Market Analysis and Strategy for August 7Gold Technical Analysis:
Daily Chart Resistance: 3430, Support: 3335
4-Hour Chart Resistance: 3400, Support: 3358
1-Hour Chart Resistance: 3400, Support: 3368.
Yesterday's pattern for gold was similar to the day before. Following a volatile decline in the Asian session, the New York market bottomed out and rebounded at support levels. The market is still maintaining a volatile upward trend, with rising lows, a step-by-step rise. Short-term adjustments won't affect the overall market trend. Today's strategy is undoubtedly to follow the trend and buy low!
Currently, the hourly chart lows are rising, from 3345 to 3350, and then to 3358. Today's Asian session low is 3365. Therefore, until 3365 is broken, there is a buying opportunity on the dip. Consider yesterday's low of 3358 as a defensive buying position for a bullish outlook.
BUY: 3390near
BUY: 3368near

Daily Analysis- XAUUSD (Thursday, 6th August 2025)Bias: Bearish
Notes:
- Daily consolidating after Friday spike up
- Looking for price to retrace back down to daily structure
- Potential SELL if there's
confirmation on lower timeframe
- Pivot point: 3390
Disclaimer:
This analysis is from a personal point of view, always conduct on your own research before making any trading decisions as the analysis do not guarantee complete accuracy.

Correction first and then rise during the day, TP3400Yesterday, gold hit the bottom near 3350 and then quickly rose to break the high. It fell back slightly in the evening and closed with volatility. The daily line closed with a long lower shadow bullish line. The short-term correction process has been completed, and there is still momentum for an upward impact. The overall structure is still a bullish trend. Focus on 3365-3355 below. As long as the bullish thinking above this level remains unchanged, any decline will provide an opportunity to enter the market. The target can be around yesterday's high of 3390. Once it breaks through 3390, the gold price is expected to reach 3405-3415.
OANDA:XAUUSD

XAUUSD NEW OUTLOOKAccording to M15 analysis gold market is in falling pressure from last few hours now market will be go back from SUPPORT LEVEL if you want then go from from support level dont be greedy use money management
TRADE AT YOUR OWN RISK

Gold: Yesterday’s Surge & Today’s Session StrategyDuring yesterday’s U.S. trading session, gold surged to around 3390 🚀, driven by a series of tariff-related remarks from Trump, Fed personnel changes, and market expectations that the probability of a September rate cut has risen to 91% ⚡️. We successfully took profit near 3355 yesterday, locking in close to maximum gains 💰.
Today’s trading strategy:
Go short at highs during the Asian session 📉
Go long at lows during the European session 📈
Go short at highs again during the U.S. session 📉
⚡️⚡️⚡️ XAUUSD ⚡️⚡️⚡️
🚀 Sell@ 3390 - 3380
🚀 TP 3375 - 3366 - 3356
Daily updates bring you precise trading signals 📊 When you hit a snag in trading, these signals stand as your trustworthy compass 🧭 Don’t hesitate to take a look—sincerely hoping they’ll be a huge help to you 🌟 👇