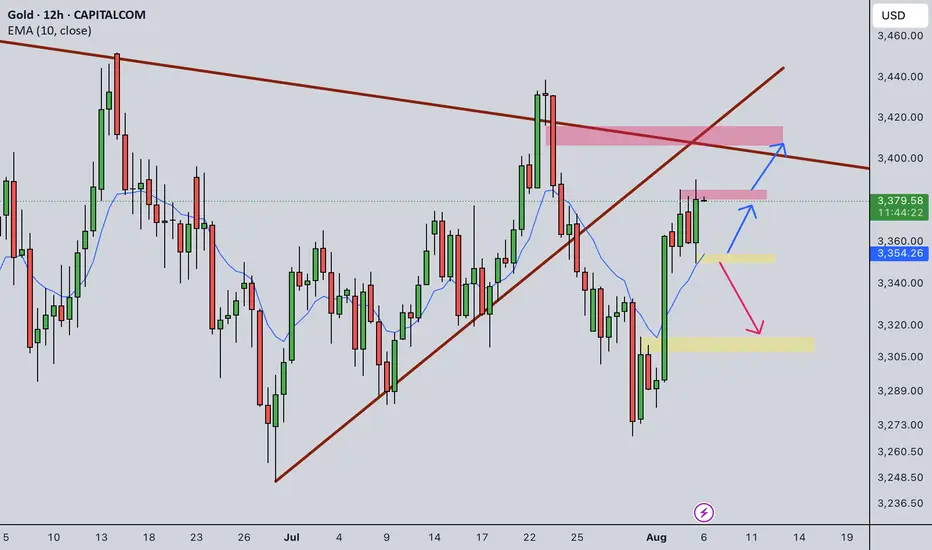
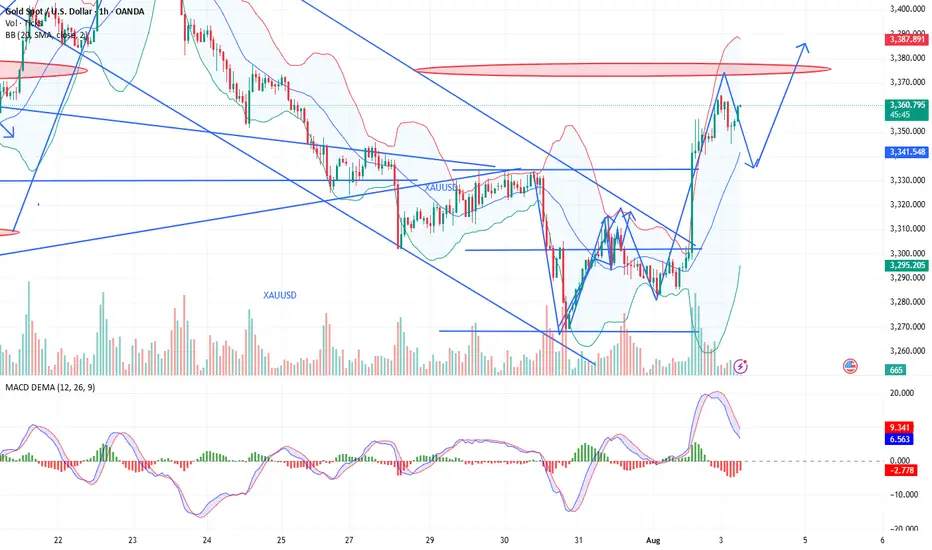
Gold Intraday Trading Plan 8/6/2025In 12hrly TF, gold seems to form bullish continuation pattern. Therefore, I will be cautious in engaging selling orders today.
For today's trading plan, I will only sell if 3350 is broken. I will buy if there is rejection from 3350 or if 3385 resistance is broken.
XAUUSD trade ideas
Will gold break through on August 5th?
1. Key News Drivers
✅ Expectations of a Fed Rate Cut Strengthen (Core Logic)
Weak non-farm payroll data (the probability of a September rate cut soars to 90%) leads the market to anticipate two rate cuts this year, with the first likely in September.
The US dollar weakens: expectations of interest rate cuts suppress the US dollar, and the attractiveness of gold as an interest-free asset increases.
✅ Rising risk aversion
Trump's tariff policy has sparked trade concerns, compounded by global economic uncertainty (such as a slowdown in Europe and geopolitical risks).
Fragile market sentiment: If subsequent economic data (such as CPI and retail sales) falls short of expectations, gold could rally further.
⚠️ Risk Warning: If Fed officials signal hawkishness (such as downplaying rate cuts) or if economic data rebounds, gold could experience a short-term correction.
2. Key Technical Signals
📈 Bullish Trend Confirmation Conditions:
A break above $3,375 (previous resistance level) opens up upside potential, with targets between $3,390 and $3,400, or even $3,450. Hold the support of 3335 (bull defense line). If the pullback does not break this level, the trend will remain strong.
📉 Pullback Risk Warning:
If 3335 is broken, a pullback to 3300 (a key psychological barrier) is possible, turning into a volatile market.
4-hour chart is overbought: Be wary of short-term profit-taking after consecutive days of gains.
🔍 Key Levels:
Resistance: 3375 → 3390-3400 → 3450
Support: 3360-3350 → 3335 → 3300
3. Today's Trading Strategy
🎯 Main Strategy: Buy on pullbacks (low-cost buying), supplemented by shorting at key resistance levels.
👉 Long Opportunities:
Conservatives: Enter after a pullback to 3360-3350 and stabilization. Stop loss at 3340, target at 3380-3390.
Aggressive: If it breaks through 3375, go long with a light position, set a stop-loss at 3360, and target 3400.
👉 Short Opportunities:
Short if it first hits the 3390-3400 range and finds resistance, set a stop-loss at 3410, and target 3375-3360.
⚠️ Notes:
Avoid chasing the ups and downs, and wait for key levels to be confirmed.
If it falls below 3335, pause long positions and wait for support at 3300 before repositioning.
4. Medium- to Long-Term Outlook
Bull Market Start Signal: A weekly break above 3400 could confirm the start of the Fed's rate cut cycle.
Potential target: 3500-3600 (historical high area).
Risks: If US economic data improves or the Fed turns hawkish, gold could experience a deep correction to 3200-3150.
Summary
Short-term outlook: 3375 is the dividing line between bulls and bears. If it breaks through, go long; if it hits resistance, trade in a range.
Medium- to long-term: Focus on Fed policy and economic data. Trend-setting long positions should wait for clearer signals.
📌 Action suggestion: Give priority to callback of long orders during the day, strictly set stop-loss, and be wary of high-level shocks and washouts!
GOLD: Bulls Testing the Top of the RangeGold is attempting to break above the well-established horizontal resistance near $3,430, which has capped price action since April. The metal continues to respect its ascending trendline from the December 2024 low, supported by the rising 50-day SMA ($3,344). The lower boundary of the consolidation range is marked near $3,245, making this a textbook triangle/range structure within a broader uptrend.
Momentum indicators support the bullish case:
MACD has crossed bullish above the signal line, although still near the zero line.
RSI is rising and sits at 55.46, showing room for further upside before entering overbought territory.
If bulls succeed in securing a daily close above $3,430, this would confirm a bullish breakout from multi-month consolidation, potentially opening the door to a fresh leg higher. On the downside, any failure to break out cleanly may lead to a retest of the ascending trendline and the $3,245 support area.
Summary:
Gold remains in an uptrend and is challenging the top of a 4-month range.
Break above $3,430 would signal bullish continuation.
MACD and RSI both point to building momentum.
Support lies at $3,344 (50 SMA) and $3,245 (range low).
Patience is key here—traders may wait for confirmation of a breakout or watch for rejection candles near resistance to determine the next directional bias.
-MW

TRADE UPDATE XAUUSD Hey everyone at the start of the week we was waiting to see if price would pullback to 3,250 zone to take buys after price missed our entry just a little bit of pips if you check out my last few posts but my projections for Gold is that price might be heading to 3434 zone and can’t see a pullback to our area of interest and if price get to the 3434 zone I will be waiting to see if sellers would jump in or I wait for a breakout so I will update you guys before the week ends or if am about to execute a trade….

180 Pips Secured on GOLD! | Sniper Strategy in Action📈 Tired of Gold Trades Going Against You? This Sniper Strategy Just Bagged +180 Pips!
Hello Traders,
Struggling with XAUUSD’s volatility?
Taking small wins but suffering big losses?
You’re not alone — and we’ve built something just for you.
🔥 Introducing GOLD SNIPER — a high-probability strategy engineered for serious Gold traders.
With a consistent 1:2 risk-reward and precision entry logic, it’s designed to help you ride big moves and avoid common traps in XAUUSD.
🚀 Today’s Live Trade Recap:
Signal 1
🟢 Buy @ 3355.91
🔴 SL @ 3349.91
🟢 TP @ 3367.91
✅ Result: +120 Pips
Signal 2
🟢 Buy @ 3368.32
🔴 SL @ 3362.32
🟢 TP @ 3380.32
❌ Result: -60 Pips
Signal 3
🟢 Buy @ 3373.29
🔴 SL @ 3367.29
🟢 TP @ 3385.29
✅ Result: +120 Pips
📊 Total Profit Today: +180 Pips
✅ What Makes Gold Sniper So Effective?
✔️ Catches real momentum, not noise
✔️ Keeps entries & exits disciplined and mechanical
✔️ Aims for high-reward trades, not scalp scraps
🎯 Want better entries and more consistent wins on XAUUSD?
📩 DM us now to get instant access and start using Gold Sniper on your TradingView chart.
If this helped you, like the idea and drop a comment — let’s grow together!
Happy Trading,
InvestPro India

In-depth Analysis of the Gold Bull-Bear Game on August 4th:
I. Gold's Current Core Contradiction
Bull Support Factors
Weak non-farm payroll data reinforces expectations of a Fed rate cut, with the market betting on an over 80% probability of a September rate cut.
Risk Aversion: Although the tariff extension has not yet been finalized, the market remains concerned about escalating trade frictions, and gold is in high demand as a safe-haven asset.
Technical Breakout: Friday saw a strong breakout above the 3340-3350 resistance zone, with the daily chart showing a positive enveloping negative trend. Short-term bullish momentum prevails.
Potential Short-Term Opportunities
Monthly Top Signal: Consecutive high-level doji candlesticks with long upper shadows suggest medium-term selling pressure.
Fundamental Bearish Hidden Dangers:
The Fed's independence remains, and Powell may not cut interest rates prematurely due to pressure from Trump.
II. Key Technical Signals
1. Weekly Level: Range Unbroken
The 3268-3438 range persists, currently nearing its upper limit, so be wary of a pullback.
Bollinger Bands are converging, with the MA5/MA10 convergence signaling an approaching market reversal window.
2. Daily and short-term cycles: Overbought correction needs
After Friday's surge: 4-hour/1-hour RSI is overbought, the Bollinger Band opening is unsustainable, and a technical retracement is needed.
Key positions:
Resistance: 3376 (previous high) + 3385 (Fibonacci expansion level);
Support: 3340 (top and bottom conversion) + 3315 (bull defense line).
3. Triangle convergence pattern:
If it opens high and breaks through 3376 on Monday, August 4, it may test 3400; if it opens low and falls below 3340, it will look down to 3315-3280.
III. Operation strategy for next week on August 4
(1) Response to three opening scenarios
Scenario 1: Opening high (above 3370)
Strategy: Short in batches in the 3376-3385 area, stop loss at 3400, target 3340→3315.
Logic: Positive overdraft + technical overbought, betting on a pullback.
Scenario 2: Flat opening (around 3360)
Strategy: If the price rises from 3366 but does not break through, go short with a light position, stop loss at 3376, target 3340; if it falls below 3340, go short and look at 3315.
Alternative: If the support at 3340 is effective, go long, stop loss at 3330, target 3360.
Scenario 3: Low opening (below 3340)
Strategy: Go long in the 3338-3340 area, stop loss at 3325, target 3360; if it breaks through 3315, go short.
(2) Mid-term layout
Short opportunity: Go short in the 3385-3400 area, stop loss at 3420, target 3245 (monthly support).
Buy opportunity: If the price falls back to 3315-3280 at the beginning of the week and stabilizes, go long in the mid-term, stop loss at 3260, target 3400.
IV. Risks and Warnings
Beware of institutional manipulation: Friday's late-day surge may be a trap for buying; beware of a flash crash at Monday's opening.
Data disturbance: Pay close attention to the speeches of Fed officials. If inflation rebounds or hawkish remarks are made, it will be bearish for gold.
Undetermined trend: The market is still volatile and unilateral trends need to wait for confirmation of a breakthrough in the range.
Conclusion
Short-term: Prioritize shorting in the 3370-3385 area, and enter long positions in the 3340-3315 area when appropriate, maintaining strict stop-loss orders.
Mid-term: The monthly bearish pattern has not changed, and above 3385 is the ideal entry point for short positions.
Key Strategies: "Don't chase long positions during strong resistance; don't sell short during deep declines; follow the trend after a breakout; exercise caution in controlling the market."
GOLD: Next Move Is Down! Short!
My dear friends,
Today we will analyse GOLD together☺️
The price is near a wide key level
and the pair is approaching a significant decision level of 3,372.04 Therefore, a strong bearish reaction here could determine the next move down.We will watch for a confirmation candle, and then target the next key level of 3,363.00..Recommend Stop-loss is beyond the current level.
❤️Sending you lots of Love and Hugs❤️
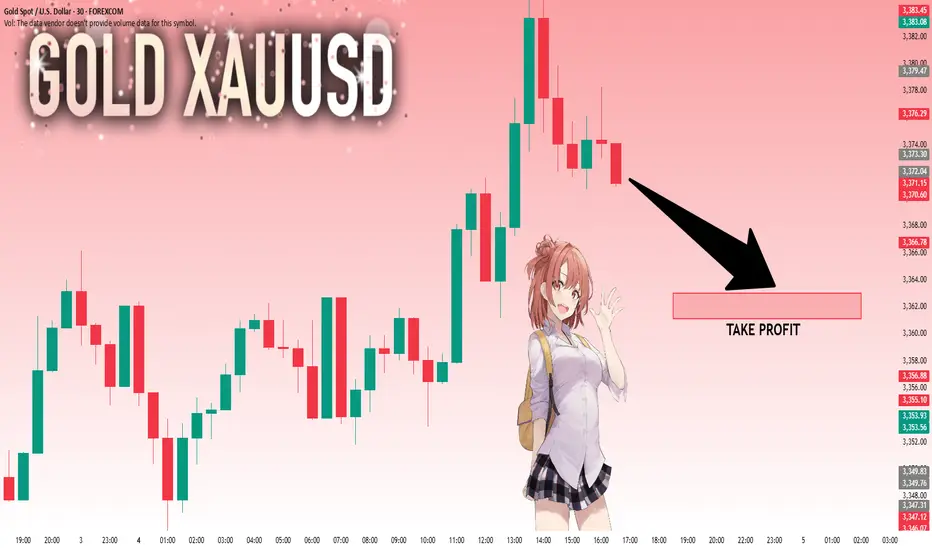
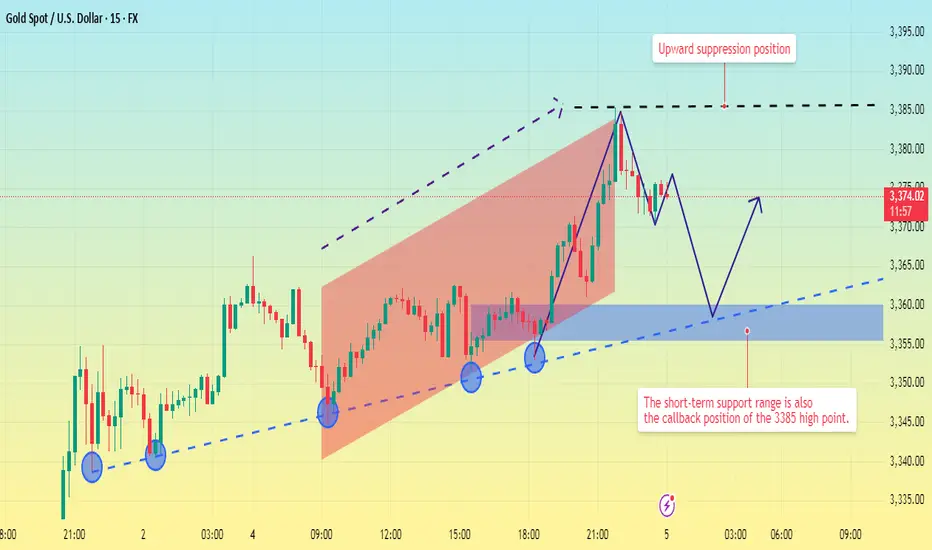
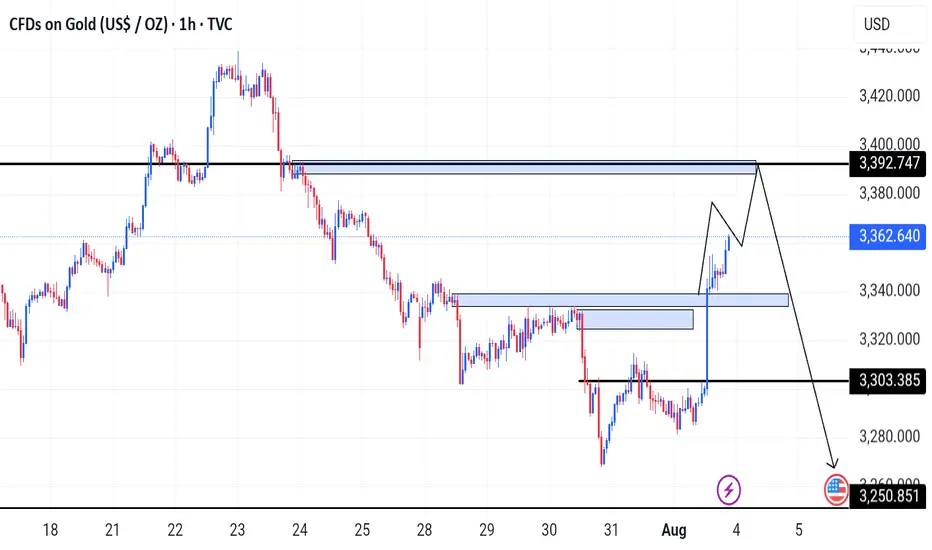
Upward movement suppressed. Price pullback?Gold prices have now perfectly reached the short-selling target range predicted by Quaid.
The current 4-hour chart clearly shows that gold's current resistance level remains around 3385.
Looking at the shorter 15-minute chart, gold has been slowly rising within an upward channel today. The resistance level of 3385 has not been effectively broken, and there is a high probability of a further pullback to test the 15-minute trendline.
Currently, 15-minute trendline support remains around 3355-3360. Focus on this support range in the short term, as it also represents a profit-taking opportunity after shorting at the 3385 high. This level can also be considered a watershed between bulls and bears. If the price pulls back to this level and does not continue to decline, there is a high probability of another upward move at this level.
However, if it falls below the 3350 trendline, the market will enter a downward trend.
Good luck to everyone in the new week.
XAU/USD DAILY - TRIANGLE BREAKOUT CONFIRMED Gold has just broken out of a symmetrical triangle after several weeks of price compression. The price bounced cleanly from the lower trendline (point 0), signaling completed accumulation. The projected target based on the triangle breakout is $3,626, with a protective stop loss at $3,340. Clean breakout with strong indicator confluence. One to watch closely 👀
🎯 Take Profit (TP): 3,626
🛡️ Stop Loss (SL): 3,340
📈 Buy Confidence Level: 88%
🔍 Pure technical analysis – not financial advice.
#Gold #XAUUSD #Breakout #TechnicalAnalysis #TrianglePattern #TradingView #PriceAction

XAUUSD Outlook – From Bias to Execution Previous day (Friday) closed bullish, leading to a buy bias on XAUUSD, Narrowing down to the 4H timeframe, I identified my recent and important supply and demand zones, On the 45M timeframe, I then looked out for a possible entry and exit zone.

Report - 4 August, 2025OPEC+ Ends Output Restraint, Glut Risk Emerges
OPEC+ announced a production increase of 547,000 barrels/day starting in September, marking the end of its nearly two-year output restraint policy. The move comes after coordinated cuts of 2.2 million b/d by core members like Saudi Arabia and the UAE failed to stabilize prices amid weak Chinese demand and rising EV adoption. With U.S., Canada, and Brazil gaining market share, internal cohesion within the cartel has weakened.
Implication: Bearish short-term crude oil outlook. A Q4 glut risk rises. Watch for downside toward $65/barrel. Inflationary pressures may abate, reducing urgency for central bank hawkishness.
U.S. Wage Inequality Deepens, Data Integrity in Question
New Atlanta Fed data shows low-income workers (<$806/week) saw wage growth fall to 3.7% YoY — nearly half its 2022 peak — while the top 25% still enjoy 4.7% gains. This uneven recovery is amplifying scrutiny of Trump’s economic policies. The president’s firing of the Labor Statistics chief post-weak jobs report has alarmed economists and investors, raising fears of political interference in vital data.
Implication: Undermines institutional trust in U.S. economic data. Increases political risk premium. Weighs on confidence in Treasury markets and complicates Fed response amid wage stagnation for key consumer segments.
Swiss Trade Shock – Tariffs Spike to 39%
Switzerland faces a 39% U.S. tariff after being blindsided by Trump’s administration, which rejected a presumed 10% baseline deal. Despite pledging $150B in U.S. investments, the Swiss were penalized over a $39B trade deficit, most of which stems from gold and pharma — sectors already exempt. President Keller-Sutter is under political fire, with comparisons drawn to historic national embarrassments.
Implication: Undermines smaller neutral economies' negotiating leverage. Risks spillover into Swiss equities (e.g., watchmakers, pharma). FX safe-haven status of CHF could weaken if investor confidence wavers.
European Bank Stocks Surge to 2008 Highs
Europe’s banks are outperforming globally, with shares in HSBC, Santander, Barclays, and UniCredit reaching decade highs. The rally is driven by sharply rising long-term yields (30Y–2Y spread at 1.3%+), boosting net interest margins. Though Trump’s latest tariff shock pulled back gains slightly, the sector is still up 34% YTD — outpacing U.S. peers.
Implication: Positive for European financials. But sustainability is tied to rate curve steepness — a flattening or ECB dovish pivot could halt momentum. Sector rotation trades favor EU banks over U.S. for now.
Dollar Rallies, Then Retreats on Weak Jobs Print
The U.S. dollar rallied 1.5% during the week — its strongest since Trump’s re-election — but Friday’s dismal jobs data triggered a 1.3% drop. Downward revisions and signs of broader labor market weakness are raising bets on Fed rate cuts. Trump’s abrupt removal of the BLS head has added institutional risk to dollar sentiment.
Implication: Dollar strength narrative interrupted. Expect near-term softness as markets price deeper cuts. Watch for EURUSD support around 1.08 and DXY pullback toward 101. Tech and gold likely to benefit from a weaker USD outlook.
Trade War Creates Uneven U.S. Corporate Profit Map
Big Tech and banks (Apple, Meta, JPMorgan) are defying tariffs with strong Q2 earnings, while consumer staples and materials suffer margin erosion despite rising sales. Over half of S&P 500 companies report lower margins YoY. The top 10 stocks now account for one-third of total index profits, underlining concentration risk.
Implication: Fragile breadth in equity markets. Overweight tech/financials remains dominant strategy, but under-the-surface weakness in consumer cyclicals may pressure indices on earnings misses. Trade war effects are being absorbed by the bottom end of the corporate and household spectrum.

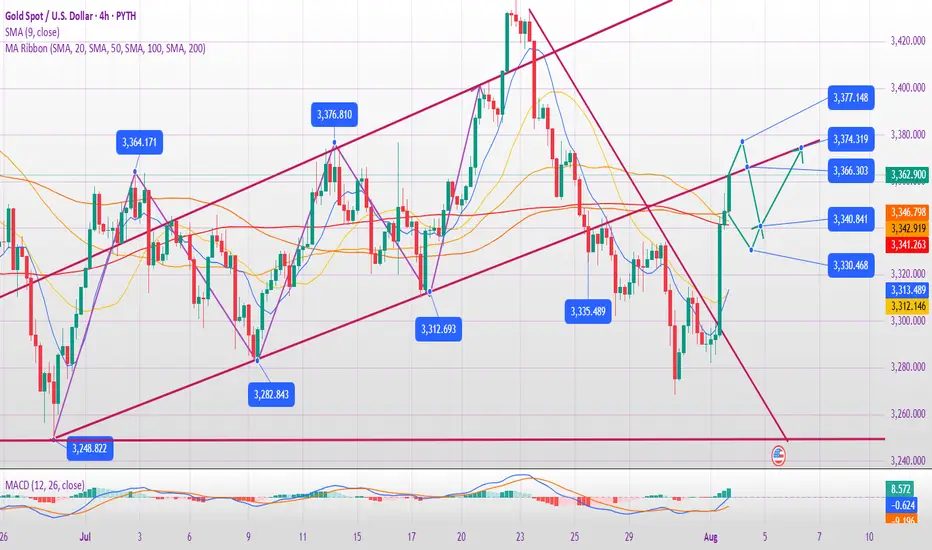
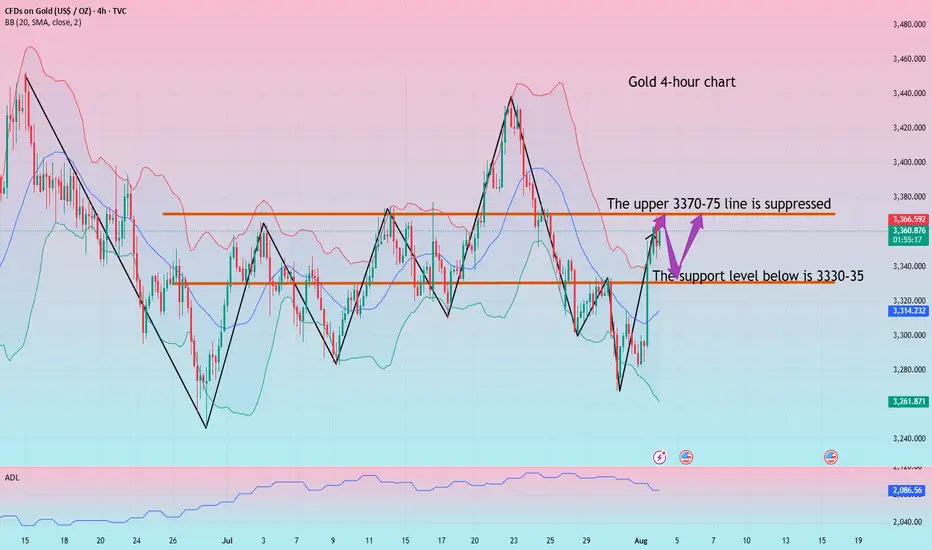
Gold falls back and looks for opportunities to go long
Bullish momentum remains the primary trend. The market opened higher near 3368 before experiencing a period of volatile decline under pressure. Technically, the market has tested resistance and needs to adjust. Overall support at higher levels has also weakened, so it's best not to chase the market too much. Opportunistically, buy on dips and stabilization before buying.
From a 4-hour analysis, short-term resistance is expected to be near 3370-3375, with a key resistance area at 3395-3400. Support is expected at 3330-35, so consider buying on dips. In the middle, maintain a cautious wait-and-see approach. I'll provide detailed trading strategies during the trading session, so stay tuned.
Gold Trading Strategy:
Buy on dips to 3330-35, with a stop-loss at 3318 and a target at 3370-3375. Continue holding if the market breaks above.
GOLD SHORT TRADE VIEWAronnoFX will not accept any liability for loss or damage as a result of
reliance on the information contained within this channel including
data, quotes, charts and buy/sell signals.
If you like this idea, do not forget to support with a like and follow.
Traders, if you like this idea or have your own opinion, please feel free command me.

GOLD/USD – 1H ChartGold has recently shown a clear Change of Character (CHoCH) near the 3275 level, signaling a potential shift from bearish to bullish momentum. After a strong downtrend, the market formed a base and then launched an aggressive bullish rally, breaking previous structure and indicating a possible trend reversal. Currently, price is consolidating around the 3350–3360 zone, just above a key demand zone between 3330 and 3340, which is likely to act as a support area. This zone also aligns with a previous supply area that has now flipped into demand, confirming smart money interest.
The projected move shows a potential short-term dip into this demand zone before continuing the upward push toward the 3370–3390 range, where buy-side liquidity is likely resting. This level could act as a near-term target or resistance. If price holds above 3330 and shows bullish confirmation (like an engulfing pattern or FVG reaction), buyers could look for opportunities with targets near 3370 and 3390. However, if the price breaks below 3330 with strong bearish momentum, the bullish bias may be invalidated, and we could see further downside.
Overall, the structure is bullish, but traders should watch for a retest of the demand zone before entering long positions. Risk should be managed carefully with stops below 3330.
What You Should Watch:
Entry confirmation around 3,335–3,340 with bullish engulfing or FVG reaction
Set TP1 = 3,370
TP2 = 3,390
SL = Below 3,330
Weak non-farm payroll data injects newconfidence into gold bullsGold rebounded strongly late last week, shaking off early-week losses and surging toward key resistance at $3,400 per ounce as weak US jobs data rekindled hopes for a September rate cut by the Federal Reserve.
Spot gold closed at $3,363.16 on Friday (August 1st), up 2.23% on the day, or $73.24, after hitting a high of $3,363.37.
Lukman Otunuga, senior market strategist at FXTM, said Friday's rally in gold prices was impressive, driven by a plunging US dollar.
"From the chart, bulls were on a rampage that day, with $3,400 within 2% of the price at that point," he said. "With prices breaking through $3,330 resistance, the weekly chart is significantly bullish. A weekly close above this level could signal a move toward $3,400."
Last week, gold faced significant selling pressure after the Federal Reserve held interest rates steady and Chairman Powell raised uncertainty about a possible September rate cut.
"We haven't made a decision about September yet," Powell said at a press conference following the Fed's decision.
After disappointing U.S. job market data, lingering doubts about a September rate cut dissipated. According to the Bureau of Labor Statistics, the U.S. economy created only 73,000 jobs last month. Furthermore, total job growth in May and June was revised downward by 258,000. According to the revised data, only 14,000 jobs were created in June and 19,000 in May.
"This weaker-than-expected jobs report has dented confidence in the U.S. economy and put pressure on the dollar as markets anticipate a more dovish Fed, potentially leaning toward rate cuts to stimulate growth," said Aaron Hill, senior market analyst at FP Markets. "For gold, the disappointing jobs data reinforces its role as a hedge against economic uncertainty, supporting prices as investors seek stability."
According to the CME FedWatch tool, the market currently sees a 92% probability of the Fed easing monetary policy in September. Last Thursday, the market saw only a 38% chance of a rate cut.
Jamie Cox, managing partner at Harris Financial Group, said the Federal Reserve may ultimately regret its decision to hold interest rates steady earlier this week.
"A rate cut in September is a definite possibility, perhaps even a 50 basis point cut, to make up for lost time," he said.
Naeem Aslam, chief investment officer at Zaye Capital Markets, said he sees the potential for gold prices to steadily rise to $3,400 an ounce given the sharp shift in interest rate expectations.
"If the Fed signals a dovish stance, speculative inflows could push gold prices above the psychological $3,400 level, especially as investors seek safe havens during economic uncertainty," he said. "Technical indicators, such as a bullish trend in gold ETFs and rising open interest, support this potential breakout. We believe traders are already positioning for a dip bounce, with some analysts pointing to seasonal patterns in gold that typically gain traction after August. While volatility may still limit near-term gains, the overall trend looks positive, and the typical summer lull may be over."
This week will be light on economic data, with investors continuing to digest Friday's jobs report. Meanwhile, some analysts expect the economic uncertainty stemming from President Trump's ongoing trade war and global tariffs to further boost safe-haven demand for gold.
Trade tensions are providing another layer of support for gold. President Trump set an August 1st deadline for countries to finalize a trade deal. While the United States reached agreements with Japan and the European Union, resulting in a 15% increase in import tariffs, many major trading partners still face the risk of tariff increases.
As a result, exports from many countries now face significant cost increases. Specifically, Canada, the United States' second-largest trading partner, faces a 35% tariff increase. Meanwhile, India faces a 25% increase, Taiwanese exports will be subject to a 20% tariff, South African products face a 30% tariff, and Swiss goods face a 39% tariff.
Pepperstone market strategist Michael Brown said he remains bullish on gold, citing global trade uncertainty as a key factor driving its value as a monetary asset.
He said: "The diversification of reserves away from the US dollar and into gold, particularly in emerging markets, will continue for the foreseeable future. Of course, potential safe-haven demand stemming from concerns about the state of the US economy will further support the bullish view. The upside levels to watch remain the $3,400 mark, followed by a high of around $3,445, and then a potential run towards the all-time high of $3,500. I certainly wouldn't rule out the possibility of new highs in gold prices before the end of the year."
Chris Vecchio, Head of Futures Strategy and FX at Tastylive, said he sees gold as a very beneficial global currency.
"Tariffs mean that countries will trade less in US dollars, so I expect gold to continue to perform well as the world searches for an alternative monetary asset."
GoldTVC:GOLD price overall is bullish after NFP event on Friday, but now it's approaching for that resistance that can result in to price forming a H&S Patten On the H4 time frame. Now let's wait on price as it goes for that supply also an Oder block.
What to trade if you can't trust jobs data? U.S. President Donald Trump has dismissed the head of the Bureau of Labor Statistics (BLS), reportedly in response to jobs figures he disagreed with.
This raises concerns about the integrity of government-reported economic data, especially ahead of the next key Non-Farm Payrolls (NFP) release on September 5.
This upcoming report also includes the BLS’s annual revision, adjusting past job growth figures from April 2024 through March 2025. Goldman Sachs “estimate a downward revision on the order of 550,000 to 950,000 jobs—or a reduction of 45,000 to 80,000 jobs per month over the April 2024 to March 2025 period.”
Given macro uncertainty and signs of distrust in U.S. economic data, the bid for gold may persist.
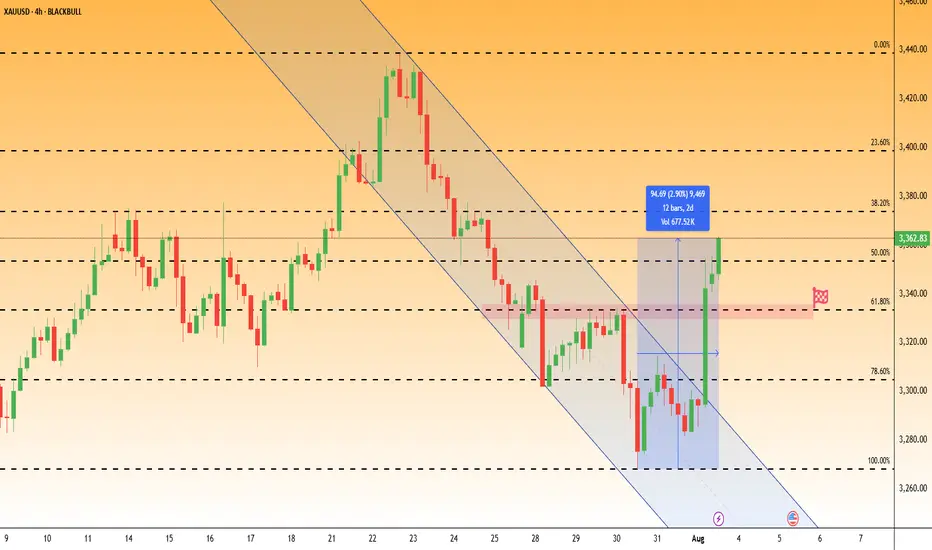
Gold has rebounded sharply in recent sessions, breaking a short-term downtrend and climbing back above the 3,360 level. Price has now retraced more than 50.0% of the July 24–31 selloff. The pair may be Short-term bullish, if price holds above 3,310.
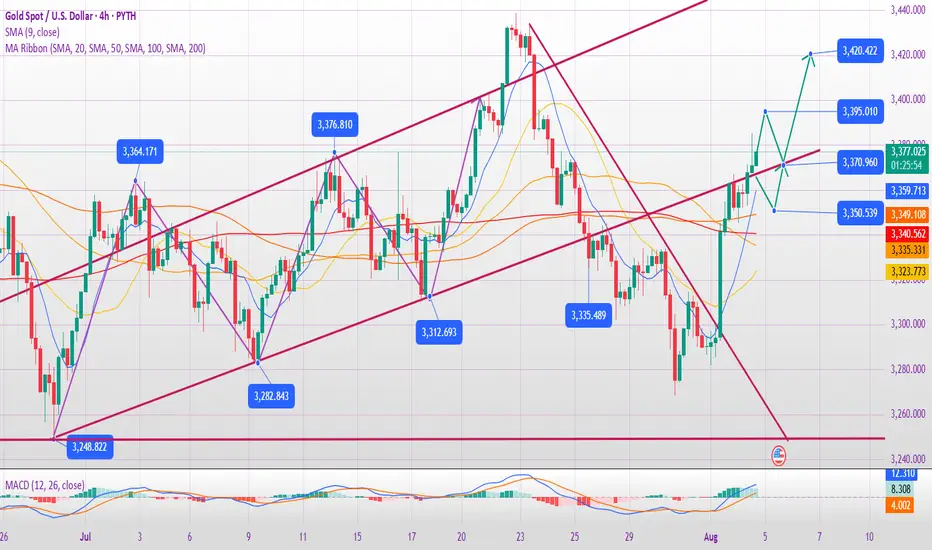
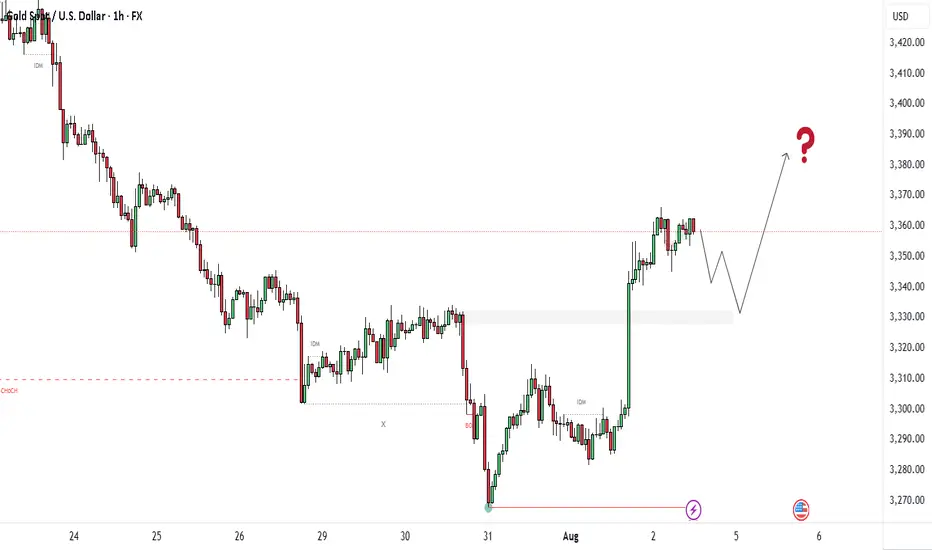
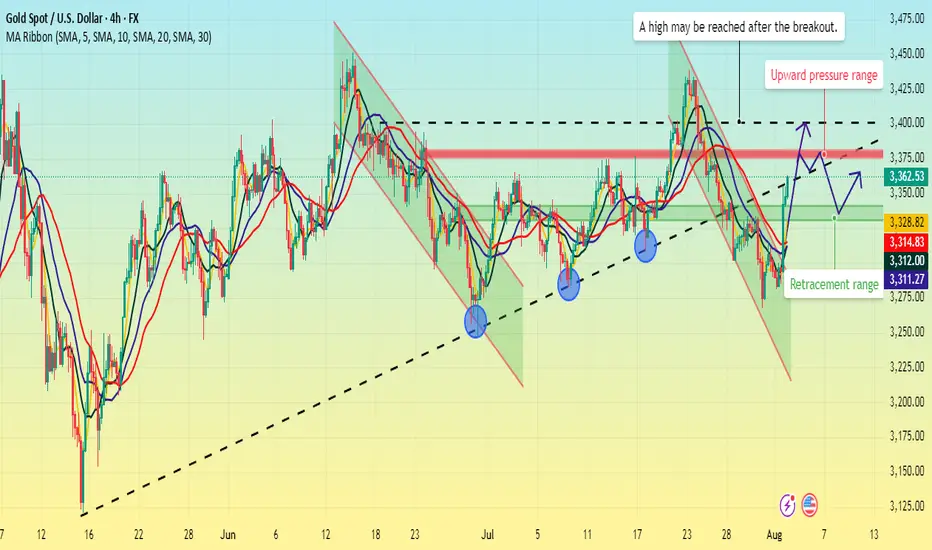
Interest rate cuts intensify. Will gold break out?No noteworthy news events occurred this weekend. So, we'll have to wait and see how the market interprets gold's trajectory at the start of next week.
From the 4-hour chart, the first thing we can confirm is that the 3363 level is unlikely to be the high point of this pullback. Because Friday's non-farm payroll report re-priced expectations for a rate cut, Friday's figures were merely a reaction from the US market. Furthermore, after hitting 3355, the price retreated slightly to 3340 before embarking on a second wave of gains.
The Asian and European markets were closed at the time, so when Monday opens, the Asian and European markets will likely also interpret expectations for a rate cut and the impact of the non-farm payroll data on the market.
Therefore, gold is likely to continue its upward trend next Monday. Currently, the first resistance level is around 3375-3380. It's uncertain whether this resistance can be overcome, but if it breaks through and stabilizes above 3380, it's likely to continue to move towards 3400.
On the other hand, if 3375-3380 holds strong resistance, a retest of Friday's retracement lows of 3330-3340 is possible.
Thus, avoid blindly shorting at the opening of next week. If the market retraces back to around 3330, then a long position is possible. If the market opens directly testing the upward pressure level, then do not chase the long position, as there is a possibility of a pullback at the pressure level.
XAUUSDXAUUSD trend If the price can still stand above 3249, it is expected that there is a chance that the price will rebound. Consider buying the red zone.
🔥Trading futures, forex, CFDs and stocks carries a risk of loss.
Please consider carefully whether such trading is suitable for you.
>>GooD Luck 😊
❤️ Like and subscribe to never miss a new idea!

Follow master candle for today's SELL strategy✏️ OANDA:XAUUSD has continued a strong downtrend. Yesterday's D1 candle closed with a 60-price decrease, forming a master candle that determines the market trend. With the market having a master candle, pay attention to the 25% or 50% candle zones to trade in the direction of the trend. Today's main trading strategy will be to SELL according to the master candle. The BUY strategy will only be implemented when the 3313 zone is broken.
📉 Key Levels
Support: 3285-3270-3250
Resistance: 3301-3312-3333
SELL Trigger. Rejection 3301, 3312
Target 3250
Leave your comments on the idea. I am happy to read your views.

XAUUSD Sell setup 09/08/25Bearish reversal (rising wedge/exhaustion): a rising wedge (higher highs + rising lower highs in a narrowing range) on a weekly chart after a big run can be a reversal or deep retracement signal
Follow risk management
Risk no more than 1%

XAU/USD – Rising Wedge Near Supply – Possible PullbackTimeframe: 1H | Broker: OANDA
Gold is trading inside a rising wedge after rallying from the $3,345–$3,355 demand zone. Price is now testing the upper wedge boundary near a supply zone at $3,405–$3,410.
Key Points
Multiple CHoCH & BOS show mixed sentiment; latest BOS hints at seller pressure.
Volume spikes on down moves indicate active selling at $3,400.
Demand zones below: $3,375–$3,365 and $3,355–$3,345.
Scenarios
Bearish (Favored): Rejection from $3,400–$3,410 could trigger a drop.
Targets:
$3,375 (first liquidity zone)
$3,355 (equilibrium zone)
$3,324 (major support)
Bullish: Break & retest above $3,410 → Targets $3,425–$3,440.
Plan
Short on wedge rejection or breakdown; SL above $3,415.
Long only if breakout holds above $3,410.

XAUUSD – Is Gold Ready for Its Final Rally? 📈 Elliott Wave Analysis on XAUUSD – Is Gold Ready for Its Final Rally? 💥
On the daily chart of XAUUSD, we’re observing the completion of a wave 4 triangle correction (ABCDE), which seems to be setting the stage for the beginning of wave 5 in the larger bullish cycle.
✅ Wave 3 showed a strong impulsive structure, and now the wave 4 triangle suggests consolidation before an explosive breakout toward the $3900 zone.
📍Key Resistance: 3900
🌀 We're anticipating a breakout above the upper channel line, potentially launching a sharp move as wave 5 unfolds.
💬 Share your thoughts in the comments! Do you think gold is ready to break its all-time high?
🔥 Save this idea & follow for future updates!
------------------------------------------------------------------------------------------------------
🚀 Who am I?
I'm Mahdi, a prop firm trader with 7+ years of experience in technical analysis, mainly focusing on Smart Money Concepts and Elliott Wave theory.
I specialize in delivering high-quality trading signals, market insights, and educational content tailored for serious traders and investors.
📊 My Tools: SMC, Elliott Wave, Fibonacci, Liquidity Grabs, Order Blocks
💼 Prop Challenge Passed: Yes | Funded Account: In Progress
🔗 Follow for consistent updates and trading insights.
